


Body composition (BC) is a science that explores nutritional status in view of the different contributions of lean v. adipose tissue and its impact on health. The fast growing evidence of the importance of BC assessment may be attributed to the development of new in vivo technology and the resulting identification of abnormal BC phenotypes that can, in turn, negatively impact prognosis in any population. Here, we will briefly discuss recent advances in BC assessment, focusing on the prevalence and significance of these abnormal phenotypes in patients with cancer. Additionally, we will contextualise abnormal BC in view of the need for targeted nutrition interventions. Although the focus of this paper is oncology patients, we argue that issues hereby discussed are broadly relevant to other populations that, like cancer, have chronic diseases characterised by older age and inflammation and where concurrently obesity also occurs. These include, but are not limited to chronic obstructive pulmonary disease( Reference Schols 1 , Reference Sheean, Peterson and Gomez Perez 2 ), insulin resistance/type II diabetes( Reference Staal-van den Brekel, Schols and Dentener 3 ), cirrhosis( Reference Montano-Loza, Meza-Junco and Prado 4 , Reference Montano-Loza, Angulo and Meza-Junco 5 ), rheumatoid arthritis( Reference Roubenoff 6 ) and congestive heart failure( Reference Wannamethee and Atkins 7 ).
Variability in body composition: a new face of an old problem
When one is asked to imagine how abnormal BC looks like in cancer, the idea of a cachectic looking, extremely emaciated person would likely be conceived by most people. As a public person, Steve Jobs’ weight loss towards the end of his cancer disease trajectory was a classic example of how terminal illness is pictured. Weight loss (and muscle loss) is an important component of cancer, particularly advanced cancer and is observed as part of the conceptual model of cancer progression. This trajectory is characterised by involuntary weight loss that increases exponentially in incurable cancers with a notable acceleration in the last few months prior to death( Reference Baracos 8 ), a process also known as cancer cachexia.
Cancer cachexia can nonetheless manifest without the concurrent phenotype of emaciation. Medical oncologists nowadays face a new issue as 40–60 % of their patients present with excess body weight (overweight and obesity) at the time of cancer diagnosis( Reference Martin, Senesse and Gioulbasanis 9 ). Nonetheless, obesity does not preclude the presence of cancer cachexia and can indeed mask its appearance( Reference Prado, Lieffers and McCargar 10 , Reference Prado and Heymsfield 11 ), a concept that has been changing paradigms in oncology research and practice. This new face of an old problem was first identified with the use of BC analysis, which looks beyond body weight and BMI and quantifies the different proportions of lean v. adipose tissue within a unit of body weight( Reference Prado and Heymsfield 11 ).
Computerised tomography: an opportunistic tool
Our understanding of BC research in cancer has substantially advanced due to the use of computerised tomography (CT) imaging scans. These images are readily available from electronic libraries of medical images taken for cancer diagnosis and prognostic follow up( Reference Prado, Birdsell and Baracos 12 ). CT images can be retrieved for the additional purpose of BC analysis providing accurate and reliable information on muscle and different adipose tissue depots at the third lumbar vertebra cross-sectional area (Fig. 1), an area chosen as the best correlate to whole BC( Reference Shen, Punyanitya and Wang 13 ). Using image specific analysis software (free-of-charge and paid): SliceOMatic, Tomovision; MeVislab, MeVis Medical Solutions AG; UltraVisual, UltraVisual Medical Systems Inc; ImageJ, National Institutes of Health; OsiriX, Pixmeo; analyzer Synapse Vincent 3D image analysis system, Fujifilm Medical, among others, tissue marking and automated computation can be accomplished. In addition to the availability of the image and the software for its analysis, trained personnel are also essential for accurate and reliable evaluation (note a radiologist is not required). These methods are highly reproducible, and have minimal additional cost. Importantly, automated software is currently being developed for rapid and practical imaging analysis( Reference Chung, Cobzas and Lieffers 14 ). Two brief videos containing an overview of the third lumbar vertebra CT analysis for BC using two different software are available at our UofANutrition YouTube Channel: https://www.youtube.com/watch?v=s1eJSK_CWco and https://www.youtube.com/watch?v=KJrsQ_dg5mM

Fig. 1. (Colour online) Cross-sectional area at the third lumbar vertebra (L3) region analysed for body composition. Note muscle green area termed intermuscular adipose tissue represents both intra- and extra-myocellular lipid.
The procedures for image analysis include finding the landmark of interest (third lumbar vertebra) and retrieving it for analysis (Digital Imaging and Communications in Medicine, DICOM format) by utilising the software of choice or a specific browser (e.g. iQ-VIEW, PACS, which are free DICOM viewers). Next, the image is uploaded in the software of choice for tissue analysis, where muscle and adipose tissue can be evaluated based on differences in pre-established measures of Hounsfield unit attenuations as follows: −29 to +150 for skeletal muscle( Reference Mitsiopoulos, Baumgartner and Heymsfield 15 ), −190 to −30 for subcutaneous and intermuscular adipose tissue( Reference Mitsiopoulos, Baumgartner and Heymsfield 15 ) and −150 to −50 for visceral adipose tissue( Reference Miller, Jones and Yanovski 16 ).
Defining divergent behaviour of muscle and adipose tissue in cancer
Using CT image analysis we, and others, were able to identify a great variability of BC in contemporary cancer patients( Reference Prado, Lieffers and McCargar 10 , Reference Lieffers, Bathe and Fassbender 17 – Reference Martin, Birdsell and Macdonald 20 ), Fig. 2. As illustrated in this figure, patients with any given BMI can present with severe muscle depletion (sarcopenia) or with normal muscle mass. Alternatively, individuals may present with BMI of different (and extreme) categories, yet have exactly the same amount of muscle mass, Fig. 3.
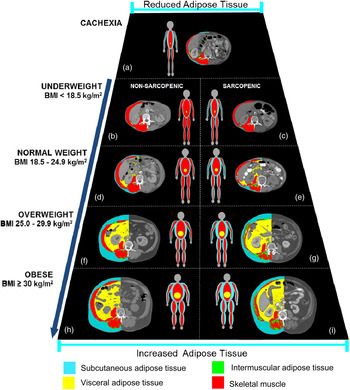
Fig. 2. (Colour online) Trapezium model of body composition in cancer illustrating the variability in body composition in patients with identical BMI. Male patients with lung or colorectal cancer. Muscle cross-sectional area (cm2): (a) = 28·6, (b) = 51·5, (c) = 40·3, (d) = 52·8, (e) = 35·3, (f) = 51·3, (g) = 33·7, (h) = 70·7, (i) = 50·1 and for total adipose tissue cross-sectional area (cm2/m2): (a) = 2·7, (b) = 5·0, (c) = 3·5, (d) = 27·9, (e) = 27·9, (f) = 146·8, (g) = 161·2, (h) = 175·3, (i) = 218·3. Cancer patients of the same height, weight and hence BMI category can present with very distinct amount of skeletal muscle mass. Non-sarcopenic patients are depicted on the left side, while sarcopenic patients are shown on the right side. This figure also illustrates how overweight and obese cancer patients can present with severe muscle depletion, highlighting how sarcopenic obesity is a potential hidden condition to health care professionals.
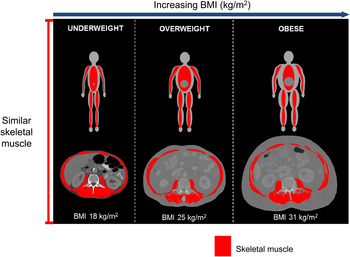
Fig. 3. (Colour online) Illustration of three male patients of different BMI presenting with similar amount of muscle cross-sectional area (skeletal muscle index = about 42·4 cm2/m2).
As a catabolic illness, a defining feature of cancer is muscle loss. Low muscle mass, also termed sarcopenia is common in people with cancer regardless of stage (i.e. from curative to palliative). In fact, the overall prevalence of sarcopenia in the studies hereby reviewed is about 40–50 % in people with newly diagnosed cancer, considerably higher than about 15 % prevalence in healthy individuals of similar age (median 65 years)( Reference von Haehling, Morley and Anker 21 ). Since only about 10 % of cancer patients are clinically underweight( Reference Martin, Birdsell and Macdonald 20 ), this widespread phenomenon of muscle depletion is independent of body weight or fat mass. Fig. 4 illustrates the widespread distribution of sarcopenia across the BMI spectrum using population cohort data of patients with colorectal cancer treated at a regional cancer centre in Alberta, Canada. Sarcopenia increased at all lower BMI strata, but was also substantially present at higher BMI. As discussed previously, sarcopenia can coexist with obesity (sarcopenic obesity), compounding health consequences for physical function and survival in cancer( Reference Prado and Heymsfield 11 , Reference Prado, Wells and Smith 22 ).

Fig. 4. (Colour online) Prevalence of sarcopenia (dots) in patients with stages I–IV colorectal cancer, n 684. Consecutive patients referred to a medical oncology service in a regional cancer centre in Alberta, Canada. Considering BMI categories, sarcopenia was prevalent in 74 % of underweight patients, 42 % of normal weight, 39 % overweight, 24·4 % obese (all classes). Among the obese individuals, sarcopenia was present in 28·8 % of class I, 18·2 % class II and 14·3 % of class III obese patients. Sarcopenia defined using BMI-specific cutpoints( Reference Martin, Birdsell and Macdonald 20 ). Data courtesy of Dr Vickie Baracos, University of Alberta.
Sarcopenia is different from cancer-associated cachexia. In cancer cachexia diagnoses, sarcopenia needs to be defined in conjunction with weight loss( Reference Fearon, Strasser and Anker 23 ). The understanding of abnormal BC in cancer has also impacted the definition of cancer cachexia. The international consensus group definition now recognises cancer cachexia as a:
‘Multifactorial syndrome defined by an ongoing loss of skeletal muscle mass (with or without fat mass) that cannot be fully reversed by conventional nutritional support and leads to progressive functional impairment‘(emphasis added)( Reference Fearon, Strasser and Anker 23 ).
Therefore, sarcopenia, sarcopenic obesity and cancer cachexia can manifest at any given BMI and body weight, which may be undetected by use of these anthropometric tools alone, hence the importance of additional assessment using BC techniques. The most commonly used cutpoints to define sarcopenia have been developed in obese patients with lung or gastrointestinal cancer using optimal stratification analysis. The gender-specific values below which patients are categorised as sarcopenic are 52·4 cm2/m2 for men and 38·5 cm2/m2 for women( Reference Prado, Lieffers and McCargar 10 ). These cutpoints have been used in many different cohorts of patients and clinical populations, consistently demonstrating an association with patient prognostication( Reference Sheean, Peterson and Gomez Perez 2 , Reference Montano-Loza, Meza-Junco and Prado 4 , Reference Tan, Birdsell and Martin 24 ). In the optimal stratification analysis approach, patients are stratified from least to most muscular and a gender-specific threshold for increased risk of a clinical outcome (in this case survival) identified. Using the same approach, Martin et al.( Reference Martin, Birdsell and Macdonald 20 ) have more recently published BMI-specific cutpoints for sarcopenia diagnosis (underweight and normal weight: <43 cm2/m2 for men and <41 cm2/m2 for women; overweight and obese: <53 cm2/m2 for men and <41 cm2/m2 for women) Since these cutpoints are BMI-specific, they provide a better indication of the prevalence of sarcopenia in non-obese individuals (compared with Prado et al.( Reference Prado, Lieffers and McCargar 10 ) defined for obese individuals only). It is important to note that the cutpoints mentioned in this paragraph were developed in a North American population, which may limit its use in different ethnicities( Reference Silva, Shen and Heo 25 ).
Although similar to the Prado et al. cutpoints( Reference Prado, Lieffers and McCargar 10 ), the ones proposed to diagnose sarcopenia by the cachexia consensus group( Reference Fearon, Strasser and Anker 23 ) are not the same. The consensus group cutpoints( Reference Fearon, Strasser and Anker 23 ) are the conversion from kg/m2 to cm2/m2 of Baumgartner's dual-energy X-ray absorptiometry-assessed sarcopenia cutpoints defined for elderly individuals: <7·26 kg/m2 for men and <5·45 kg/m2 for women( Reference Baumgartner, Koehler and Gallagher 26 ). These are converted to <55 cm2/m2 for men and <39 cm2/m2 for women, as reported in Fearon et al.( Reference Fearon, Strasser and Anker 23 ) using a regression equation previously published( Reference Mourtzakis, Prado and Lieffers 27 ). In addition to dual-energy X-ray absorptiometry and CT cutpoints, the international consensus group has also suggested cutpoints developed using bioelectrical impedance analysis, and for surrogate measurements of BC using the mid upper-arm muscle area( Reference Fearon, Strasser and Anker 23 ). Sarcopenic obesity has been most commonly identified using a combination of any sarcopenia cutpoints defined earlier in conjunction with BMI cutpoints (provided very muscular individuals can be identified by the CT image and are not incorrectly classified as obese)( Reference Prado, Lieffers and McCargar 10 , Reference Martin, Birdsell and Macdonald 20 , Reference Tan, Birdsell and Martin 24 , Reference Anandavadivelan, Brismar and Nilsson 28 , Reference Lodewick, van Nijnatten and van Dam 29 ).
Implications of abnormal body composition
Despite the variability of available BC assessment tools and cutpoints, sarcopenia and sarcopenic obesity have been consistently associated as predictors of unfavourable outcomes in oncology patients. Selected examples will be discussed in this section.
Treatment toxicity
One of the very first research questions regarding the potential impact of abnormal BC on cancer prognosis was related to the issue of individualising chemotherapy treatment( Reference Prado, Baracos and McCargar 30 ). Most chemotherapy drugs are administered based on body surface area, which is a calculation that only accounts for height and weight. Therefore, individuals with identical height, weight and hence body surface area (as presented in each BMI category in Fig. 2) would consequently be receiving exactly the same amount of chemotherapy drug( Reference Prado 31 ). Such practice ignores the large individual variability in muscle mass and hence lean tissue compartment, where pharmacokinetics (drug metabolism) occurs( Reference Prado, Maia and Ormsbee 32 – Reference Narjoz, Cessot and Thomas-Schoemann 35 ). This concept has been extensively reviewed previously and we refer the reader to other articles for a more detailed discussion( Reference Prado 31 , Reference Prado, Maia and Ormsbee 32 ). Based on this concept, the original hypothesis was that a sarcopenic person would receive a large amount of drug for a small lean tissue compartment; increasing this person's risk for developing dose limiting toxicity (DLT)( Reference Prado 31 ). DLT is an unfavourable and undesirable outcome of chemotherapy, which leads to treatment termination, discontinuation, hospitalisation or death. The original hypothesis was investigated using several different studies with different chemotherapy drugs and in individuals with different cancer types( Reference Prado 31 , Reference Prado, Antoun and Sawyer 36 ). In a recently published paper by Anandavadivelan et al.( Reference Anandavadivelan, Brismar and Nilsson 28 ), DLT was investigated in seventy-two patients receiving neo-adjuvant therapy for oesophageal cancer. Unfortunately, absolute values of muscle mass were not stratified by gender when comparing those presenting v. not presenting with DLT. Nonetheless, using a gender-specific definition of sarcopenia, they showed that sarcopenic obese presented with higher DLT compared with their non-sarcopenic obese counterparts (OR 5·54; (95% CI 1·12, 27·44).
Collectively, these studies show that sarcopenia (withor without concurrent obesity) is an independent predictor of severe toxicity, affecting cancer treatment and its outcomes. The same hypothesis holds true for studies on targeted chemotherapy agents( Reference Cushen, Power and Teo 19 , Reference Antoun, Birdsell and Sawyer 37 ) (Fig. 5) and for hydrophobic agents, where both muscle and adipose tissue may play a role in predicting toxicity( Reference Prado, Baracos and Xiao 34 ).

Fig. 5. (Colour online) Summary of individual study studies relating sarcopenia with dose-limiting toxicity; several antineoplastic therapies and cancer types represented. 5FU (5-fluorouracil), colorectal cancer( Reference Prado, Baracos and McCargar 30 ); Capecitabine, breast cancer( Reference Prado, Baracos and McCargar 42 ); Adjuvant FEC (%-fluorouracil, epirubicin, cyclophosphamide), breast cancer( Reference Prado, Lima and Baracos 33 ); Sorafenib, renal cell cancer( Reference Antoun, Birdsell and Sawyer 37 ); Sorafenib, renal cell cancer( Reference Mir, Coriat and Blanchet 77 ); Sunitinib, renal cell cancer( Reference Huillard, Mir and Peyromaure 78 ); Vandetabin, advanced medullary thyroid carcinoma( Reference Massicotte, Borget and Broutin 79 ); Fluoropyrimidine, colorectal cancer( Reference Barret, Antoun and Dalban 80 ); Imatinib, gastrointestinal stromal tumour (anaemia and fatigue)( Reference Moryoussef, Dhooge and Volet 81 ); ECX and CF (Epirubicin, Cisplatin, Capecitabine) and CF (Cisplatin and 5-Fluorouracil), oesophagogastric cancer( Reference Tan, Brammer and Randhawa 82 ).
Therefore, there is enough evidence to suggest these patients behave as if they were overdosed. Future dose-escalating studies personalised by BC will illustrate the value of personalising chemotherapy treatment( 38 ) using BC, and the respective impact on decreasing the risk of DLT consequently increasing the number of planned chemotherapy cycles in sarcopenic patients.
In addition to cancer being a catabolic condition leading to muscle loss, cancer-treatment itself can impact BC. Chemotherapy treatment can decrease muscle mass by 4·6 cm2( Reference Stene, Helbostad and Amundsen 39 ) which is about 0·8 kg at the whole body level using the regression equation in Shen et al.( Reference Shen, Punyanitya and Wang 13 ): whole body muscle mass = 0·166 × (CT measured skeletal muscle (cm2)) + 2·142, but using only the slope since the line has a non-zero intercept.
Survival
We have pioneered the findings of sarcopenic-obesity as an independent predictor of physical impairment (47 v. 26 % in non-sarcopenic obese, P = 0·005) and survival in a population cohort of patients with lung or gastrointestinal cancer( Reference Prado, Lieffers and McCargar 10 ). Survival was shorter for sarcopenic obese patients compared with non-sarcopenic obese (hazard ratio (HR) 4·2; 95% CI 2·4, 7·2)( Reference Prado, Lieffers and McCargar 10 ). We have also reported similar findings in sarcopenic patients with hepatocellular carcinoma( Reference Meza-Junco, Montano-Loza and Baracos 40 ), and lung or colorectal cancer( Reference Prado, Mourtzakis and Baracos 41 ) and that sarcopenia is an independent predictor of shorter time to tumour progression( Reference Prado, Baracos and McCargar 42 ).
More recently, 2-year overall survival was lower in sarcopenic patients with diffuse large B-cell lymphoma, compared with the non-sarcopenic counterparts (46 v. 84 %, respectively) with a HR 3·22; 95 % CI 1·73, 5·98( Reference Lanic, Kraut-Tauzia and Modzelewski 43 ). Miyamoto et al.( Reference Miyamoto, Baba and Sakamoto 44 ) investigated the prognostic effect of sarcopenia in patients with stages I–III colorectal cancer undergoing curative resection surgery. Sarcopenia was an independent predictor of shorter recurrence-free survival (HR 2·18; 95 % CI 1·20, 3·94) and overall survival (HR 2·27; 95 % CI 1·15, 4·5). In a separate study, the authors also showed that muscle loss was similarly associated with poor prognosis in patients with unresectable colorectal cancer( Reference Miyamoto, Baba and Sakamoto 45 ). Muscle loss >5 % after chemotherapy treatment was associated with shorter overall survival (HR 2·08; 95 % CI 1·19, 3·62). Sarcopenia was also a significant predictor of overall survival in patients with urothelial cancer (HR 3·36; 95 % CI 1·9, 6·1)( Reference Fukushima, Yokoyama and Nakanishi 46 ), hepatocellular carcinoma (HR 3·2; 95 % CI 1·28, 8·0)( Reference Voron, Tselikas and Pietrasz 47 ), and metastatic renal cell carcinoma (HR 2·13; 95 % CI 1·15, 3·92)( Reference Sharma, Zargar-Shoshtari and Caracciolo 48 ). Additionally, several other recent studies have investigated the prognostic impact of sarcopenia on survival on cancer ( Reference Stene, Helbostad and Amundsen 39 , Reference Reisinger, Bosmans and Uittenbogaart 49 – Reference Reisinger, van Vugt and Tegels 51 ); the growing body of literature on the topic is impressive.
Broader implications
Much broader implications can be attributed to abnormalities in BC. Sarcopenia has been associated with the development of postoperative infections, the need for inpatient rehabilitative care, incidence of hospitalisation and length of hospital stay as shown in Lieffers et al.( Reference Lieffers, Bathe and Fassbender 17 ) and Peng et al.( Reference Peng, van Vledder and Tsai 52 ). More recently, Ida et al.( Reference Ida, Watanabe and Yoshida 53 ) reported a higher incidence of postoperative respiratory complications among sarcopenic patients compared with non-sarcopenic (15·5 v. 6·5 %, respectively, P = 0·01) and showed sarcopenia (OR 5·82; P = 0·0001) was a risk factor for the occurrence of respiratory complication in patients with oesophageal cancer. In patients following pancreatectomy, sarcopenia was an independent predictor of major grade III complications, length of stay, intensive care unit admission, delayed gastric emptying, and infectious, gastrointestinal, pulmonary and cardiac complications( Reference Joglekar, Asghar and Mott 54 ). Similar results were reported by van Vugt et al.( Reference van Vugt, Braam and van Oudheusden 55 ) who demonstrated that sarcopenia was associated with severe postoperative complications in patients undergoing cytoreductive surgery with hyperthermic intraperitoneal chemotherapy for peritoneal carcinomatosis of colorectal cancer.
Cancer therapy can also lead to abnormal BC. As an example, patients undergoing breast cancer therapy and androgen deprivation therapy for prostate cancer develop a pattern of fat gain with concurrent loss of lean mass (i.e. sarcopenic obesity)( Reference Di Sebastiano and Mourtzakis 56 ). These patterns of change have been linked to decreased quality of life, decreased disease-free survival, increased risk of CVD, increase risk of insulin resistance/diabetes, reduced bone mass, increased risk of fractures at multiples sites and also, metabolic imbalances, consequences likely related to both sarcopenia and obesity( Reference Di Sebastiano and Mourtzakis 56 – Reference Demark-Wahnefried, Peterson and Winer 58 ). Additionally, some drugs commonly used can also promote muscle loss such as corticosteroids, statins and tyrosine kinase inhibitors, as reviewed previously( Reference Prado, Antoun and Sawyer 36 ).
Impact of muscle radiodensity
Another metric associated with key health outcomes is muscle radiodensity. Prado et al. were the first to report an association between low muscle attenuation and sarcopenia in cancer patients( Reference Prado, Lieffers and McCargar 10 ). Reduced muscle attenuation is reflective of intermuscular adipose tissue or poor ‘quality’ skeletal muscle. Aubrey et al.( Reference Aubrey, Esfandiari and Baracos 59 ) introduced a radiation attenuation map of paraspinal/psoas muscles depicting the myoesteatosis phenomenon, a concept illustrated in Fig. 6. This concept highlights that skeletal muscle may contain areas of normal and reduced attenuation; and that these reduced attenuation areas are within radiodensity ranges of adipose tissue. Therefore the ‘quality’ of the muscle may be affected with individuals having less than half of muscle falling within normal muscle attenuation areas. Importantly, low muscle radiodensity is emerging as an important and in some cases stronger predictor of clinical outcomes (compared with muscle mass alone). In Sabel et al.( Reference Sabel, Lee and Cai 60 ) low (psoas) muscle radiodensity was associated with disease-free and distant disease-free survival (P = 0·04 and P = 0·0002, respectively). These results were supported by a Martin et al.( Reference Martin, Birdsell and Macdonald 20 ) study, where low muscle attenuation was a powerful predictor of survival (HR 1·36, 95 % CI 1·2, 1·6), and more recently by Okumura et al.( Reference Okumura, Kaido and Hamaguchi 50 ), who showed low muscle quality associated with poor overall (HR 2·5, P < 0·001) and recurrence free (HR 1·6; P = 0·004) survival.

Fig. 6. (Colour online) Muscle radiodensity variability for psoas, erector spinae and quadratus lumborum at the third lumbar vertebra. A1, B1 represent contrast enhanced images of computerised tomography images analysed for body composition for two individual patients; A2 and B2 represent the pie chart of variability in muscle radiodensity attenuation showing the percentage total tissue area within the ranges of adipose tissue (light blue, −190 to −30 Hounsfield Units, HU), normal attenuation muscle (red, +30 to +150 HU) and abnormal (reduced) attenuation muscle in two ranges (dark blue, −29 to 0 HU; yellow, +1 to +29 HU). The patient on the right (B1) presents with a significant amount of skeletal muscle lipid content and hence lower overall HU attenuation. This is indicative of muscle myosteatosis which more than 50 % of the tissue area following in HU range for the adipose tissue. Conversely, the patient on the left (A1) has the majority of tissue area within normal muscle radiation attenuation values. This concept is presented in Aubrey et al.( Reference Aubrey, Esfandiari and Baracos 59 ).
The impact of abnormal body composition on nutritional therapy
All of the implications of sarcopenia and sarcopenic-obesity in cancer can be conceived as the potential clinical benefits of reversing these abnormalities by nutritional therapy. We now know cancer patients have anabolic potential( Reference Prado, Sawyer and Ghosh 61 ). Contrary to popular belief, sarcopenia in cancer is reversible even in people of older age, deconditioning, inflammation and concurrent comorbid conditions( Reference Baracos 62 ). Evidence also shows that anabolic responsiveness is not suppressed by nutrition interventions( Reference Dobs, Boccia and Croot 63 – Reference MacDonald, Johns and Stephens 68 ). In spite of this evidence, recent pharmacological studies on retention or gain of muscle mass in cancer have failed to provide (or account for) sufficient energy and protein to sustain muscle mass accretion( Reference Dobs, Boccia and Croot 63 , Reference Garcia, Boccia and Graham 65 ). While the importance of adequate nutrient intake is obvious, an important unanswered question relates to the optimal energy and protein intakes during cancer disease trajectory.
Muscle loss in cancer is partially driven by increased muscle protein catabolism, when substrate availability (protein intake) is insufficient. Not only is a supply of protein essential, but an adequate dose and balance of calories and essential nutrients are required to support maintenance or gain of muscle. The optimal amounts of protein and calories are undefined for preventing or treating sarcopenia in people with cancer. Protein intake by cancer patients is variable (0·2–2·7 g/kg)( Reference Hutton, Martin and Field 69 ) and many do not meet current dietary guidelines of 0·8 g/kg for healthy individuals( 70 ) or 1·0–1·5 g/kg for those with cancer( Reference Martin, McCallum and Polisena 71 – Reference Arends, Bodoky and Bozzetti 73 ). We previously reported that 35 % of cancer patients had protein intakes below 1·0 g/kg( Reference Prado, Lieffers and Bergsten 74 ) and that protein intake correlated with muscle mass (r 0·4; P = 0·001) and lean mass (r 0·4; P = 0·003)( Reference Prado, Lieffers and Bowthorpe 75 ).
Current protein and energy guidelines in cancer, and across a broad spectrum of other chronic conditions, recommend daily ranges of intake adjusted by body weight. This ignores the large variability of BC in contemporary population extensively discussed earlier and also shown in Fig. 7(a). As a theoretical example, patients who weigh the same and are provided protein at 0·8 g/kg body weight would receive anywhere between 0·8 and 2·1 g protein/kg lean mass, owing to differences in BC, Fig. 7(b). The proposition that lean mass drives protein requirements is widely accepted; thus adjusting dietary targets by BC is more appropriate. The same logic can be applied to energy recommendations, which estimate 25–35 kcal/kg per d for people with cancer( Reference Arends, Bodoky and Bozzetti 73 ) without considering BC. A sarcopenic obese patient thus would receive more calories than required, but less protein than needed( Reference Prado and Heymsfield 11 ), leading to gains in fat mass that are not associated with treatment success and longevity( Reference Prado, Lieffers and McCargar 10 , Reference Gonzalez, Pastore and Orlandi 76 ).

Fig. 7. (Colour online) (a) Correlation of lean mass (LM, which is primarily muscle mass) and body weight in patients (n 684) with colorectal cancer (stages I–IV cancer) receiving treatment at a regional cancer centre in Alberta, Canada and (b) variability in theoretical dose of protein per kg LM by body weight in the same cohort. The defect in defining a person by body weight: a person of 80 kg (highlighted in red box) can have anywhere between about 30 and 70 kg lean mass. This is a substantial difference. Example based on intake of 0·8 g protein/kg body weight/d, showing a wide range in dose of protein/kg of LM. In the highlighted example, people weighing 80 kg who are fed 0·8 g protein/kg/body weight would receive between 0·8 and 2·1 g protein/kg LM, depending on the amount of LM in their total BW. Data courtesy of Dr Vickie Baracos, University of Alberta.
Current nutrition recommendations are inconsistent with findings of variable BC and do not meet the physiological needs of most cancer patients. At one end of the spectrum, underweight patients have elevated protein requirements due to their illness. They may receive adequate energy but inadequate amounts or quality of protein, placing them at risk for protein malnutrition and sarcopenia. In contrast, obese patients may have secondary pathologies related to their excess fat mass. They require tailored amounts and types of energy, targeted to prevent increases in fat mass and worsening of problems such as insulin resistance and lipid control. The obese patient may also have sarcopenia (sarcopenic obese), which would increase their protein needs. Thus, dietary prescriptions for energy and protein need to be disconnected. Their energy needs must relate to their obesity and other comorbidities, with protein intake targeted to protect muscle mass( Reference Prado and Heymsfield 11 ).
Conclusion
BC is variable within patients with identical body size. Sarcopenia and sarcopenic obesity are prevalent, can occur concurrently with cachexia and are prognostic for poorer quality of life, longer length of hospital stay, rehabilitation care, postoperative complication, survival, among others. Given the high and increasing prevalence of cancer and the high incidence of sarcopenia in people with cancer, sarcopenia and its attendant health risks and functional deficits are a significant problem potentially affecting hundreds of thousands of cancer patients.
The variability in BC in contemporary cancer population creates diverse nutritional requirements which have nonetheless been established as a range of intake, with no specific target for patients to achieve. Assuming that protein and energy feeding may be done by body weight ignores this variability in BC, promoting or enhancing the sarcopenic or sarcopenic obesity phenotype. Dietary guidelines for people with cancer are not optimal or evidence-based( Reference Prado and Heymsfield 11 ). The need is compelling for a more comprehensive and differentiated understanding of energy and protein requirements in this heterogeneous population. Future research should integrate nutritional goals of energy retention and balance, for the development of guidelines and recommendations targeting individuals with different physiological needs to prevent or delay sarcopenia, and improve muscle mass while also optimising fat mass.
Acknowledgement
We thank Dr Vickie Baracos for kindly providing the data for the development of Figs. 4 and 7.
Financial Support
None.
Conflicts of Interest
None.
Authorship
C. M. P. was responsible for conception and draft of this review (presented at The Nutrition Society Irish Section Meeting, June, 2015); S. J. C., C. E. O. and R. M. O. are collaborators who contributed towards literature review and summary, the development of figures and online supplementary material, also providing scientific input in all content hereby presented. All authors reviewed and approved the manuscript prior to submission.


