


Insulin-resistant states such as obesity and type 2 diabetes are characterised by metabolic abnormalities including increased plasma NEFA levels(Reference Ferrannini, Camastra and Coppack1). Incretin hormones play a vital role in regulating insulin response and gastric emptying in the postprandial period. However, the impact of SFA on incretin hormone secretion and subsequent insulin response is currently unknown.
The present study examined the impact of increasing dietary NEFA on circulating insulin, C-peptide, gastric inhibitory peptide (GIP) and glucagon-like peptide-1 (GLP-1). Seven men (mean age 26.7 (sd 8) years and BMI 22.4 (sd 2) kg/m2) consumed 50 g palm stearin (source of SFA), high-oleic sunflower oil (source of MUFA) or high-oleic sunflower oil supplemented with fish oil (source of n-3 PUFA) on separate occasions; a fourth day included no fat as a control. Lipids were emulsified into hot chocolate drinks and given throughout the 6 h study day as a main oral load at baseline followed by smaller amounts every 30 min. An intravenous infusion of heparin (500 IU bolus+0.4 IU/kg body weight per min) was initiated 2 h after the main lipid load to achieve elevated NEFA. Venous blood samples were taken every 30–60 min. Time-course data were compared using repeated measures ANOVA with Bonferroni correction for multiple comparisons.
The protocol resulted in sustained elevated serum NEFA (P<0.001) and insulin (P<0.05) during each lipid load compared with the control. The levels of NEFA achieved from SFA were significantly higher than those achieved when PUFA was consumed (P=0.005). Insulin levels peaked after the first oral load and again after the heparin infusion raised NEFA levels. Absolute insulin levels were not significantly different between the test lipids for either peak, but incremental area under curve (iAUC) showed trends towards lower insulin on the SFA study day (Figure; A). There were no significant differences in C-peptide response between any of the study days; however, there were significant differences in the molar ratio C-peptide:insulin (P=0.002) during consumption of SFA that resulted in the lowest ratio (only SFA was significantly lower than the control, P=0.003). For both incretin hormones there was a significant effect of study day (P⩽0.001). GLP-1 levels were significantly higher during consumption of MUFA (P<0.001) and PUFA (P=0.006) as compared with the control, whilst SFA showed a lower response (NS) (Figure; B). All three lipids induced a higher response in plasma GIP than the control (P<0.001) and despite no significant differences between the test lipids the data show a trend of decreased GIP response during the first part of the study day when SFA was consumed (Figure; C).
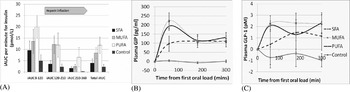
Figure. (A) iAUC per min for insulin; time 0–120 min corresponds to the effect of oral feeding and time 120–210 min corresponds to the effect of increased NEFA; (B) change in plasma GIP from baseline; (C) change in plasma GLP-1 from baseline.
The present pilot study has indicated a potential negative impact of elevated saturated NEFA on insulin clearance and incretin hormone secretion. As high levels of NEFA are implicated in insulin resistance, the present study gives an insight on how different types of fatty acid may impact on incretin hormone secretion and subsequent insulin response during this condition.
The authors gratefully acknowledge funding from BBSRC, Unilever and FRST (New Zealand).

