


Background
Lifestyle is a crucial factor in the prevention of non-communicable diseases. Large long-term prospective cohort studies have shown that 60–75 % of coronary events and 36 % of cancer incidences can be explained by modifiable risk factors such as unhealthy diets, overweight, obesity, physical inactivity, smoking and excessive alcohol intake(Reference Chiuve, McCullough and Sacks1, Reference Ford, Bergmann and Kroger2). According to the most recent report by the global burden of disease (GBD) 2016 study, an unhealthy diet is a leading risk factor for premature death and disability worldwide(3). Dietary risk factors were associated with nearly 10 % of the GBD(3).
Research to reduce dietary risk should address the level of consumption of food groups in combination with nutrients and other dietary compounds. A major advantage of analyses on the food group level is that the results are better interpretable compared with nutrients or complex dietary patterns, and therefore easier to transfer into recommendations on primary prevention of non-communicable disease, including CVD, type 2 diabetes (T2D), hypertension and different cancer types. A major approach to reduce non-communicable diseases in a population by modifying food intake is directly linked to the concept of food-based dietary guidelines (FBDG)(4, 5). FBDG are the preferred approach to guide the population regarding their dietary habits. However, such guidelines should be based on a high grade of evidence as requested in many other areas of public health practice.
An adequate approach to clarify inconclusive data and knowledge in the field of public health nutrition is to systematically review and meta-analyse the published data in order to further strengthen our understanding of the interplay between lifestyle, diet and health(Reference Lichtenstein, Yetley and Lau6). However, the issue of quality of such systematic reviews with quantitative meta-analyses is getting more and more into the focus. The widespread implementation of meta-analyses is a novel phenomenon and the standards of its application not always well known(Reference Ioannidis7, Reference Page and Moher8).
To close the gap between the evidence generated by meta-analyses and the often direct transfer of such evidence into recommendations, a careful implementation of the systematic review and meta-analysis methods is needed. This is particularly important for the dietary recommendations such as the FBDG that often address disease reduction as the aim.
Thus, in this paper, we will summarise the methodological background of meta-analyses with dietary variables, the evaluation of risk of bias and the methods to assess the quality of evidence. The focus is given to meta-analyses on food and food groups. We will also highlight the evidence in this field generated by meta-analyses of randomised controlled trials (RCT) with the new option of network analyses and the evidence generated by observational studies. The concept of disability-adjusted life year (DALY) will be proposed as a method to quantify the food–disease relation across various health outcomes and to rank the results in terms of level of impact.
Generating the evidence for food-based dietary guidelines
General methodological background and standards of meta-analyses
During past decades, the number of systematic reviews with impact quantification has remarkably increased and they continue to replace narrative reviews previously used to combine data from multiple studies. Narrative reviews are often characterised by a lack of transparency and are therefore inherently subjective(Reference Cook, Mulrow and Haynes9). With the tremendous increase of scientific publications(Reference Larsen and von Ins10), the methodology of narrative reviews has become less useful and systematic approaches have become the preferred option. Systematic reviews are described as comprehensive and objective summaries of all relevant high-quality research evidence addressing precise questions(Reference Higgins and Green11). In all fields of health sciences including nutritional sciences, systematic reviews have become an important tool for the evaluation of intervention trials and the transfer of the results into evidence-based science/medicine. The use of systematic reviews and meta-analyses to investigate lifestyle-related topics is also becoming increasingly popular due to the accumulation of scientific data in the course of the past years(Reference Bastian, Glasziou and Chalmers12).
To avoid flooding the media with poorly conducted systematic reviews and meta-analyses, as already has been criticised(Reference Ioannidis7), researchers should comply with distinct guidelines that ensure high-quality results when using this technique.
The Cochrane handbook defined five key characteristics for systematic reviews(Reference Higgins and Green11): (1) A clearly stated set of objectives with pre-defined eligibility criteria for studies; (2) An explicit, reproducible methodology; (3) A systematic search that attempts to identify all studies that would meet the eligibility criteria; (4) An assessment of the validity of the findings of the included studies, e.g. through the assessment of risk of bias; (5) A systematic presentation and synthesis of the characteristics and findings of the included studies.
Authors of systematic reviews and meta-analyses of RCT are encouraged to follow the Preferred Reporting Items for Systematic Reviews and Meta-Analyses guidelines(Reference Moher, Liberati and Tetzlaff13), while the appropriate tool for systematic reviews and meta-analyses of observational studies is the Meta-analysis of Observational Studies in Epidemiology checklist(Reference Stroup, Berlin and Morton14). The Preferred Reporting Items for Systematic Reviews and Meta-Analyses statement consists of a twenty-seven-item checklist and a four-phase flow diagram. A particularly important Preferred Reporting Items for Systematic Reviews and Meta-Analyses checklist point includes an explicit statement of study questions being addressed with reference to participants, interventions/exposure, comparisons, outcomes and study design. Table 1 demonstrates an example from a previously published meta-analysis using the participants, interventions/exposure, comparisons, outcomes and study design criteria regarding the research question: Which dietary approach offers the greatest benefits in the management of glycaemic control in T2D patients(Reference Schwingshackl, Chaimani and Hoffmann15, Reference Schwingshackl, Chaimani and Hoffmann16).
Table 1. Example for the application of the participants, interventions/exposure, comparisons, outcomes and study design criteria regarding the research question: Which dietary approach offers the greatest benefits in the management of glycaemic control in type 2 diabetes (T2D) patients?(Reference Schwingshackl, Chaimani and Hoffmann15, Reference Schwingshackl, Chaimani and Hoffmann16)

Systematic reviews are a form of observational research, and the methods for the review should be agreed on before the review commences. Recording a detailed protocol of each systematic review is an essential part of manuscript submission now required by most peer-reviewed journals. This can take the form of registration (e.g. at PROSPERO – https://www.crd.york.ac.uk/PROSPERO/), an open publication journal (e.g. BMJ Open or Systematic Reviews) or a dated submission to a research office or research ethics board. Adherence to a well-developed protocol reduces the risk of bias in the systematic review. Other important items of the Preferred Reporting Items for Systematic Reviews and Meta-Analyses checklist include: the presentation of full electronic search strategy of at least one database; study selection process; data extraction process; assessment of risk of bias; description of methods to handle data and combine results; reporting of evidence synthesis and additional analyses; summary of the main findings and strength of the evidence; and reporting of sources of funding(Reference Moher, Liberati and Tetzlaff13).
Statistical heterogeneity in a meta-analysis refers to variations in study estimates between the included studies, and may be due to variability in the participants, interventions, outcomes studied or methodological diversity. To explore statistical heterogeneity between studies, the Cochrane Q test and the I 2 statistic are important formal tests(Reference Higgins and Green11). Moreover, it is recommended to calculate the 95 % CI for the estimates of heterogeneity(Reference Ioannidis, Patsopoulos and Evangelou17). A value for I 2 >50 % is considered to represent substantial heterogeneity(Reference Higgins and Green11). Important strategies to investigate the sources of statistical heterogeneity include subgroup analysis (e.g. by sex, age, length of follow-up, geographic location and dietary assessment methods), meta-regression and sensitivity analysis for low risk of bias studies.
Another important issue of meta-analyses are small study effects, since smaller trials often report larger treatment effects compared with larger trials. Publication bias may be one of the reasons, since significant results are more likely submitted by authors and accepted by peer-reviewed journals even if these results come from small trials. Publication bias and small study effects can be explored visually by checking funnel plot for symmetry and by applying formal tests, including the Egger's and Begg's test(Reference Higgins and Green11, Reference Egger, Davey and Schneider18, Reference Begg and Mazumdar19).
The observed effects in a study might be distorted by dependencies that could arise when comparing several treatment groups with one control group or several categories of exposures with one reference category. Such within-study dependence of measures of effect should be addressed in treatment comparisons and dose–response analyses using approaches proposed for multivariate meta-analysis(Reference Gleser, Olkin, Cooper and Hedges20–Reference Hamling, Lee and Weitkunat22). However, adjustments for such correlated measures of effect are often overlooked in practice.
Specific features of meta-analyses of randomised controlled trials
In RCT of dietary interventions the most common measures of effect are the absolute differences of the mean value of a continuous outcome variable between two groups (intervention group and control group). If studies measure the outcome on different scales, the results have to be standardised to a uniform scale and the standardised mean difference has to be used(Reference Higgins and Green11).
In meta-analyses, the overall intervention effect is summarised as weighted average of the (standardised) mean difference of individual studies. Usually, a random-effects model is used to combine the results, with the underlying assumption that there is not only one true effect size, but a distribution of true intervention effects across studies. Differences in effect size may vary by sex, age, geographic location, etc. If it is assumed that individual studies are estimating one common true effect size and differences are explained by sampling errors, a fixed-effect model is used(Reference Riley, Higgins and Deeks23). When there is clinical and statistical heterogeneity, a random-effects model should be the first choice. In the random-effects model, the true effect could vary from study to study. The random-effects method and the fixed-effect method will give identical results when there is no statistical heterogeneity among the studies(Reference Higgins and Green11). Summary estimates with their corresponding 95 % CI can be presented in a forest plot(Reference Lewis and Clarke24).
RCT in nutrition research are often prone to inherent methodological constraints. They sometimes cannot be controlled with true placebos, but rather by a limitation of certain aspects of nutrient compositions, food groups or dietary patterns. Other limitations include the lack of double blinding, poor compliance and adherence, cross-over bias, and high drop-out rates. Failure of allocation concealment, blinding and follow-up losses are well-established limitations of RCT(Reference Bjelakovic, Nikolova and Gluud25). Low-quality RCT may lead to an overestimation of intervention effect estimates and raise heterogeneity(Reference Savovic, Jones and Altman26). Assessing the risk of bias/study quality/study limitations of individual RCT included in a meta-analysis is highly recommended, and sensitivity analyses excluding high risk of bias RCT should be conducted(Reference Higgins and Green11, Reference Moher, Liberati and Tetzlaff13). The risk of bias tool by the Cochrane collaboration takes the following items into account: sequence generation, allocation concealment, blinding of participants and personnel, blinding of outcome assessment personnel, incomplete outcome and selective reporting. The risk of bias for each item is expressed simply as low risk, high risk or unclear risk of bias(Reference Higgins, Altman and Gotzsche27). A previous analysis of fifty randomly selected meta-analyses of RCT(Reference Schwingshackl, Knuppel and Schwedhelm28) showed that 70 % applied the risk of bias assessment tool by the Cochrane collaboration, 10 % the Jadad scale(Reference Jadad, Moore and Carroll29), 14 % reported no risk of bias/study quality/study limitations item, 4 % applied their own score and one study used the Rosendal scale(Reference Khalesi, Irwin and Schubert30).
A promising new evidence-synthesis method for intervention studies is network meta-analysis (NMA), which is an extension of pairwise meta-analysis that enables a simultaneous comparison of multiple interventions, forming a connected network while preserving the internal randomisation of individual trials. NMA combines direct (e.g. from trials comparing directly two interventions) and indirect (e.g. from a connected root via one more intermediate comparators) evidence in a network of trials (Fig. 1)(Reference Schwingshackl, Dias and Hoffmann31–Reference Schwingshackl, Missbach and Dias33). For example, in Fig. 1, none of the studies have compared intervention B (whole grains) with intervention C (nuts), but each has been compared with a common intervention A (refined grains), then we assume an indirect comparison of B and C on the direct comparison of B and A and the direct comparison of C and A. In this way, it enables inference about every possible comparison between a pair of interventions in the network even when some comparisons have never been evaluated in a trial. By conducting NMA, it is possible to derive a relative ranking of the different intervention for each outcome using the distribution of the ranking probabilities and the surface under the cumulative ranking curves(Reference Salanti, Ades and Ioannidis34). A fundamental assumption of NMA, often called the transitivity assumption, is that trials comparing different sets of interventions should be similar enough in all characteristics that may affect the outcome(Reference Salanti35–Reference Mavridis, Giannatsi and Cipriani37). To evaluate the assumption of transitivity, the distribution of potential effect modifiers (e.g. in Fig. 1, changes in body weight, age, duration of diabetes) across the available direct comparisons should be compared. To evaluate the presence of statistical inconsistency (i.e. disagreement between the different sources of evidence), the loop-specific approach (to detect loops of evidence that might present important inconsistency)(Reference Bucher, Guyatt and Griffith38), as well as the side-splitting approach (to detect comparisons for which direct estimates disagree with indirect evidence from the entire network)(Reference Dias, Welton and Caldwell39) should be applied.
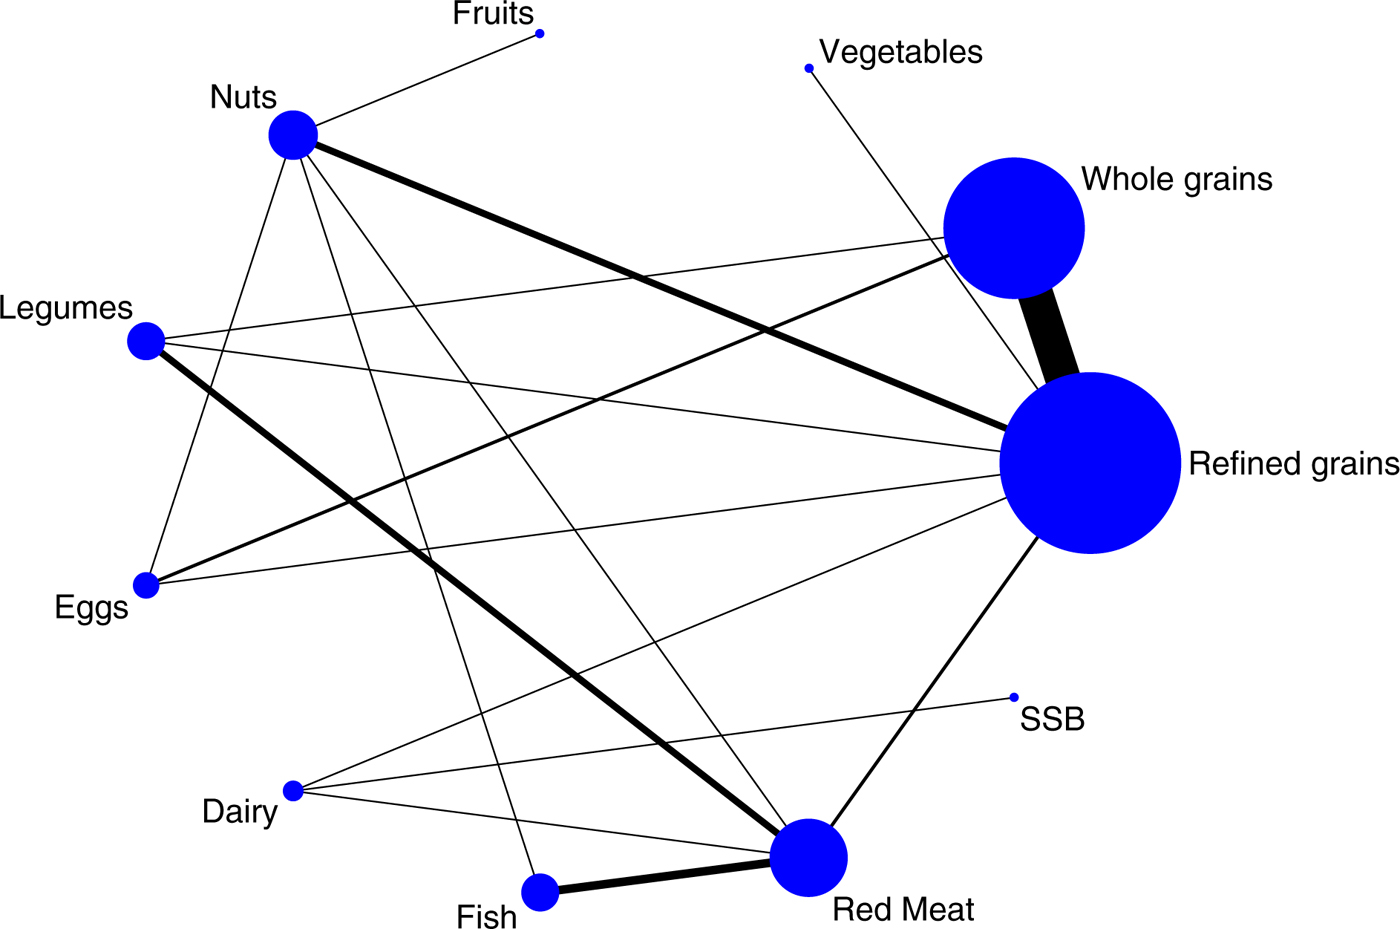
Fig. 1. (Colour online) Example of a network diagram. The size of the nodes is proportional to the total number of participants allocated to each dietary approach and the thickness of the lines is proportional to the number of studies evaluating each direct comparison. SSB, sugar-sweetened beverages.
Specific features of meta-analyses of cohort studies
Effect estimates in observational studies mostly refer to binary or count outcomes (e.g. incidence of a disease, mortality or prevalence) and are expressed mostly as hazard ratios or OR as an estimate of relative risk. In nutritional epidemiology, three types of meta-analysis regarding the combination of estimates are recommended.
Usually, in a first step, a high v. low meta-analysis is conducted. Here, the summary risk estimate with the corresponding 95 % CI for a specific outcome (e.g. incidence of a chronic disease) is calculated by comparing high v. low intake of a single food or food group by applying a random-effects model. As described earlier, the random-effects model assumes that the true effect may differ between studies and is more appropriate in nutritional epidemiology. The natural logarithm of the risk estimate is calculated for each study and weighted according to the method of DerSimonian and Laird(Reference DerSimonian and Laird40). The high v. low meta-analysis provides an overview about the average risk of high intake of a specific food or food group compared with low intake regarding the outcome of interest. One of the major limitations of high v. low meta-analysis includes the comparability of the level of exposure categories across studies because intake categories generated in the original studies are not always comparable between them.
Thus, meta-analyses should not solely focus on ‘simple’ high v. low analysis, but also examine the summary effect for dose–response relations. In this analysis, the association between a dietary factor, measured as a continuous variable, and risk of the outcome of interest is investigated by performing a meta-analysis of the dose–response relation from each study. If original studies do not report on dose–response relations, the slope (linear trend and 95 % CI) for each study can be estimated using the method of generalised least squares for trend estimation proposed by Greenland and Longnecker(Reference Greenland and Longnecker21) and implemented by Orsini et al. (Reference Orsini, Li and Wolk41). In this case, information on the risk estimates with corresponding 95 % CI, the quantified exposure value and the distribution of cases and person-years (or non-cases) is required for at least three categories of the exposure. Missing information on the distribution of person-years or non-cases can be estimated if studies provide the number of total cases in addition to total person-years or the number of total participants plus follow-up period(Reference Chene and Thompson42, Reference Aune, Greenwood and Chan43). If studies report ranges of the exposure categories instead of the mean value, the mid-point between the lower and upper limits for each category can be calculated. For open categories (e.g. the highest quantile), a similar range to the adjacent category can be assumed.
Finally, to explore the shape of the diet–disease risk association, a non-linear dose–response meta-analysis can be performed for instance by using fractional polynomial models, or restricted cubic spline regression models(Reference Durrleman and Simon44, Reference Bagnardi, Zambon and Quatto45). Non-linearity of the association can be visually evaluated in graphs and by using a likelihood ratio test(Reference Orsini, Li and Wolk41).
Well-designed cohort studies provide important evidence with complementary strength (decade long exposures in large sample size of general populations with hard endpoints) and limitations (residual confounding and measurement error) as well. Ascertainment of exposure, adjustment factors, assessment of outcome and adequacy of follow-up are important challenges in conducting these studies.
Similar to meta-analyses of RCT, assessment of the risk of bias/study quality/study limitations of individual cohort studies included in a meta-analysis is important(Reference Stroup, Berlin and Morton14). A previous analysis of fifty randomly selected meta-analyses of cohort studies(Reference Schwingshackl, Knuppel and Schwedhelm28) showed that 40 % of these meta-analyses applied no quality assessment score and 38 % used the Newcastle Ottawa Scale (points range 0–9), while the remaining 22 % applied a variety of less well-known tools(Reference Wells, O'Connell and Peterson46).
Recently, we proposed a risk of bias assessment of cohort studies that takes into account ascertainment of exposure such as usual dietary intake, adjustment factors, assessment of outcome and adequacy of follow-up(Reference Schwingshackl, Knuppel and Schwedhelm28):
Usual dietary intake (e.g. long-term average) cannot usually be observed directly. Hence, in nutritional studies, dietary intake is mostly assessed by self-report instruments. The most prominent assessment instruments are FFQ, food record, 24 h dietary recall and dietary screener. All self-report dietary assessment instruments are prone to different types of measurement error and therefore can lead to biased risk estimates and loss of power(Reference Freedman, Schatzkin and Midthune47). The risk of bias depends on the applied dietary assessment instrument, which is determined by the study design and study aim. In our risk of bias assessment tool, we proposed a low risk of bias rating for validated and calibrated FFQ, multiple 24 h dietary recalls and food records. Conversely, non-validated FFQ and single 24 h dietary recalls should be rated with a high risk of bias(Reference Schwingshackl, Knuppel and Schwedhelm28). A useful overview and description of the applicability of most prominent dietary assessment instruments is given in the Dietary Assessment Primer(48). In cohort studies, covariate adjustment is done to address confounding and other sources of bias (e.g. selection bias) or to increase precision in a diet–health outcome model. Therefore, the choice of an adequate set of adjusting variables depends on the assumed relationship between the exposure, the outcome and adjusting variables as well as the purpose of the statistical analyses. As in nutritional observational studies many confounding factors are often assumed to be present, we simplified the risk of bias by counting the number of adjusting variables, rating low risk of bias for models with two or more adjusting variables. This simplification is based on the assumption that the adjustment variables of the studies that have been carried out are reasonable. It is important to remind that different adjustment sets can lead to different study results. A cohort study is rated with a low risk of bias for the assessment of outcome if the study provides record linkage (International Classification of Diseases codes), accepted clinical criteria or if assessment was blinded or independent. Conversely, self-reported and no assessment of study outcomes was rated as having a high risk of bias. Taking into account adequacy of follow-up we recommend for a rating of low risk of bias, a median follow-up of, e.g. ≥10 years for CVD, and ≥5 years for T2D.
Credibility of the evidence within meta-analyses
We recently developed the NutriGrade scoring system (maximum of ten points), to evaluate the trustworthiness (credibility) of evidence for the effect/association of a dietary factor and the outcome of interest(Reference Schwingshackl, Knuppel and Schwedhelm28).
Compared with the well-established Grading of Recommendations Assessment, Development and Evaluation approach, NutriGrade differs in the following aspects: it gives more weight to the evaluation of cohort study designs, because such design is important for the investigation of diet–disease relations; it assesses nutrition-specific aspects, such as dietary assessment methods and their validation, calibration of FFQ, and the assessment of diet-associated biomarkers; finally, it also considers the conflict of interest and funding bias as a separate item.
NutriGrade is based on the following seven items for RCT: (1) risk of bias, study quality, study limitations (maximum 3 points); (2) precision (maximum 1 point); (3) heterogeneity (maximum 1 point); (4) directness (maximum 1 point); (5) publication bias (maximum 1 point); (6) funding bias (maximum 1 point); (7) study design (+2 points); and the following eight items for cohort studies: (1) risk of bias, study quality, study limitations (maximum 2 points); (2) precision (maximum 1 point); (3) heterogeneity (maximum 1 point); (4) directness (maximum 1 point); (5) publication bias (maximum 1 point); (6) funding bias (maximum 1 point); (7) effect size (maximum 2 points); and (8) dose–response relations (maximum 1 point).
To evaluate and interpret the meta-evidence, we recommend four categories based on this scoring system: high confidence in the effect estimates (≥8 points); moderate confidence in the effect estimates (6 to <8 points); low confidence in the effect estimates (4 to <6 points); very low confidence in the effect estimates (0 to <4 points).
There is also a need to evaluate the credibility of NMA evidence in a systematic way. The confidence in NMA (http://cinema.ispm.ch/) framework has been developed to judge the confidence that can be placed in the results obtained from a NMA by adapting and extending the Grading of Recommendations Assessment, Development and Evaluation approach domains (study limitations, inconsistency, indirectness, imprecision and publication bias). The system is transparent and applicable to any network structure(Reference Salanti, Del Giovane and Chaimani49).
Evaluating the methodological quality of meta-analyses
AMSTAR, a measurement tool to assess systematic reviews, is one of the most widely used instruments to assess the methodological quality of systematic reviews, and consists of eleven-item questionnaire (e.g. provision of an a priori design, use of two independent reviewers for data extraction, assessment and documentation of study quality, assessment of publication bias, conflict of interest statement) that asks reviewers to answer yes, no or can't answer, and was published in 2007 (maximum score of 11)(Reference Shea, Grimshaw and Wells50). An umbrella review of fourteen meta-analyses investigating the impact of nut intake on biomarkers of CVD showed that ten out of fourteen reported an AMSTAR score <8(Reference Schwingshackl, Hoffmann and Missbach51). Two recent overviews of reviews suggest that current meta-analyses/systematic reviews evaluating the association of Mediterranean diet on health ouctomes varied strongly regarding their methodologic quality (total score 4–20), assessed with a modified AMSTAR quality scale (maximum score 22)(Reference Huedo-Medina, Garcia and Bihuniak52, Reference Dinu, Pagliai and Casini53). Recently, an update of the AMSTAR has been published (AMSTAR 2). This update is based on sixteen items and has an overall rating based on weaknesses in critical domains(Reference Shea, Reeves and Wells54).
A new tool for assessing the risk of bias in systematic reviews (the ROBIS tool) mainly covers research questions relating to effectiveness, aetiology, diagnosis and prognosis(Reference Whiting, Savovic and Higgins55). Important flaws and limitations in the design, conduct or analysis of a systematic review will influence the results or conclusions of the review. It is important to note that a systematic review can be judged with a low risk of bias, even if the included studies were rated with a high risk of bias, as long as the systematic review has rigorously assessed the risk of bias of the included studies when summarising the evidence. The tool includes three phases: the first focuses on the relevance of the research question (define the participants, interventions/exposure, comparisons, outcomes and study design criteria) (which is optional); the second evaluates potential bias (study eligibility criteria, identification and selection of studies, data collection and study appraisal, and synthesis and findings of the review process) and in the third phase, the risk of bias is judged(Reference Whiting, Savovic and Higgins55).
Quantification of health impact of diet–disease relations
Given the multi-facetted nature of population health, the health impact or burden of disease and risk factors can be described by a variety of indicators(Reference Devleesschauwer, Maertens de Noordhout and Smit56). Typical health impact indicators include cause-specific mortality rates, incidence rates and prevalence ratios. These metrics however do not allow for a comprehensive comparison or aggregation of health outcomes. Indeed, these unidimensional measures of population health only quantify the effects of either mortality or morbidity, thus impeding comparisons between fatal and disabling conditions. Furthermore, they only take into account disease occurrence, without quantifying disease severity. In response to these limitations, several authors have developed summary measures of population health that integrate multiple dimensions of health impact. Driven by the influential GBD studies, led by the WHO and the Institute for Health Metrics and Evaluation, the DALY has become the key summary measure of population health for quantifying burden of disease(Reference Devleesschauwer, Havelaar and Maertens de Noordhout57, Reference Murray58). The DALY is a health gap measure, quantifying the health gap from a life lived in perfect health as the number of years of healthy life lost due to illness (years lived with disability, YLD) and premature death (years of life lost, YLL):
YLD = number of incident cases × duration until remission or death × disability weight,
YLL = number of deaths × residual life expectancy at the age of death.
An alternative formula for calculating YLD follows an incidence rather than a prevalence perspective(Reference Murray, Ezzati and Flaxman59):
YLD = number of prevalent cases × disability weight.
Two complementary approaches may be defined for quantifying the disease burden associated with dietary or other risk factors(Reference Devleesschauwer, Haagsma and Angulo60). In the bottom-up approach, dose–response relations of dietary exposure and health outcomes are combined in a risk assessment model to predict the expected disease burden(61). The top-down approach starts from available epidemiological data and associates health states with the concerned risk factor at an individual level (e.g. categorical attribution) or at a population level (e.g. comparative risk assessment). In the GBD studies, comparative risk assessment is the standard approach for quantifying diet-related health problems(3, Reference Micha, Kalantarian and Wirojratana62, 63). This approach is based on the calculation of population-attributable fractions (PAF), which represent the proportion of risk that would be averted if exposure would have been limited to an ideal exposure level. Estimates of the attributable burden (AB) for risk–outcome pairs are obtained by multiplying the overall burden estimate with the PAF:
AB = DALY × PAF.
The PAF for a continuous risk factor, such as consumption of fruit and vegetables quantified in terms of g/d, is defined as follows:
 $${\rm PAF} = \displaystyle{{\int \nolimits_{x = l}^u {\rm RR}(x)P(x)dx - {\rm RR}({\rm TMREL})} \over {\int \nolimits_{x = l}^u {\rm RR}(x)P(x)dx}},$$
where RR(x) is the relative risk as a function of exposure level x, which ranges between a lower bound l and an upper bound u; P(x) is the prevalence of exposure at level x; and TMREL is the theoretical minimum-risk exposure level.
In a similar way, the PAF for a discrete risk factor which can take on u different distinct exposure levels, such as consumption of fruit and vegetables quantified as specific consumption levels, is defined as:
 $${\rm PAF} = \displaystyle{{\sum \nolimits_{x = 1}^u {\rm RR(}x)P(x) - {\rm RR}({\rm TMREL})} \over {\sum \nolimits_{x = 1}^u {\rm RR}(x)P(x)}}.$$
The most recent iteration of the GBD project is the GBD 2016, which provides estimates for the period 1990–2016(3, 63). By providing estimates on the burden of dietary risk factors, the GBD project allows for a direct identification and ranking of diet-related health problems at a global, regional or national level(3, 63). The GBD 2016 estimates can be explored in an interactive way via http://vizhub.healthdata.org/gbd-compare/.
According to the GBD 2016 study, dietary risk factors were associated with nearly 10 % of the GBD. The major diet-associated disease clusters were CVD (8·0 % of total DALY), diabetes (1·0 % of total DALY) and neoplasms (0·6 % of total DALY). The group of dietary risk factors comprised fifteen individual dietary risks, with diets low in whole grains and diets low in fruit as major contributors (Fig. 2).
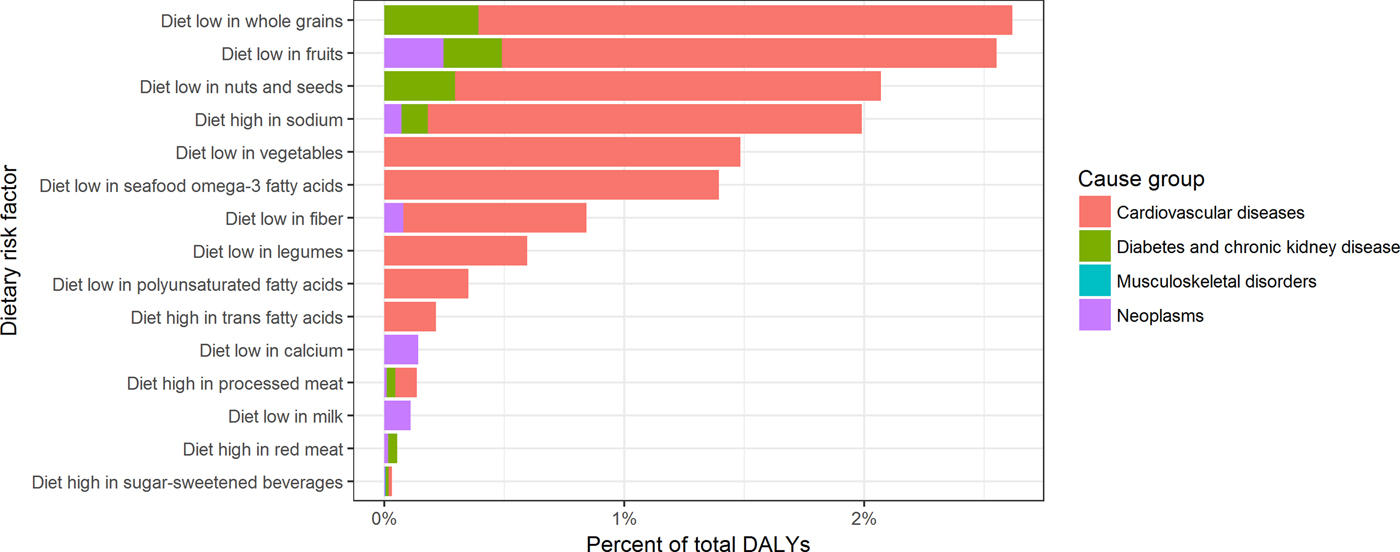
Fig. 2. (Colour online) Contribution of dietary risk factors to the global burden of disease, 2016. DALY, disability-adjusted life years.
In this context, attention should be given to the potential dependencies between measures of effect/association if the overall impact of an exposure, e.g. a food, is compared across health outcomes. For example, a certain food group (exposure) having an impact on multiple, dependent health outcomes such as mortality and CVD, where CVD also contributes to mortality itself. The current meta-analyses aggregate the study results for a single outcome and assume that the measured effect/association are independent across all health outcomes(Reference Viechtbauer64). However, this assumption is not realistic and it can be assumed that health outcomes correlate with each other(Reference Thompson and Becker65). It could be shown that correlations between health outcomes result in dependences between measures of effect/association across health outcomes that could lead to biased estimates(Reference Riley66), underestimated standard error of the effect estimate (leading to narrow CI) and incorrect rejection of the null hypothesis(Reference Becker, Tinsley and Brown67).
A number of approaches have been proposed to meta-analyse dependent effect sizes. If the correlations between effect sizes are available, the dependence can be mathematically modelled using approaches proposed by means of a multivariate model for the meta-analysis(Reference Gleser, Olkin, Cooper and Hedges20, Reference Raudenbush, Becker and Kalaian68–Reference Borenstein, Hedges and Higgins70). However, as correlations among measurements of effect are not often reported in the studies, a meta-analysis using a multi-variate approach may be challenging. Alternatively, a three-level meta-analysis can be used when correlations between the measurements of effect are not known(Reference Konstantopoulos71, Reference Cheung72). A three-level meta-analysis is the extension of the two-level meta-analysis in which the within-study-dependent effect sizes are clustered at level 2 and the between-study effects are estimated at level 3. Other possible approaches when correlations among effect estimates are not known include robust variance estimation(Reference Hedges, Tipton and Johnson73) and methods of moments(Reference Jackson, White and Riley74, Reference Chen, Cai and Hong75). Many of these approaches are available in the statistical software package R(Reference Viechtbauer64, Reference Gasparrini, Armstrong and Kenward76, Reference Cheung77).
Current evidence for food-based dietary guidelines
Meta-analyses of randomised controlled trials
Compared with the tremendous number of published meta-analyses of observational studies on the association between food groups and risk of chronic diseases, the number of meta-analyses of RCT investigating the effect of food groups on metabolic risk factors is very low. Although very large long-term RCT have been conducted, e.g. the Women's Health Initiative Dietary Modification Trial or the Prevención con Dieta Mediterránea trial(Reference Estruch, Ros and Salas-Salvado78, Reference Howard, Manson and Stefanick79), most dietary intervention studies are of short-term duration with small sample sizes, and focus on dietary approaches (e.g. low-carbohydrate diet, Mediterranean diet), and/or dietary supplements (e.g. vitamins, minerals) often in high-risk populations, and did not often investigate the effects of single-food groups. Nevertheless, some meta-analyses on the effects of food groups on cardiovascular risk factors have been published (Table 2).
Table 2. Evidence summary from meta-analyses of intervention trials investigating the effects between food groups and metabolic risk factors(Reference Hollaender, Ross and Kristensen80–Reference O'Connor, Kim and Campbell101)

CRP, C-reactive protein; DBP, diastolic blood pressure; HbA1c, glycosylated Hb; HDL-C, HDL cholesterol; LDL-C, LDL cholesterol; NA, not assessed; SBP, systolic blood pressure.
↔ No effect with increased intake; ↑ increased with higher intake; ↓ reduction with increased intake.
A meta-analysis of twenty-four RCT showed that the consumption of whole-grain diets compared with control diets reduces LDL-cholesterol (LDL-C) and total cholesterol (TC), but not HDL-cholesterol (HDL-C) or TAG(Reference Hollaender, Ross and Kristensen80), whereas other meta-analyses showed a reduction in fasting glucose (FG), but no effect on diastolic blood pressure and systolic blood pressure (SBP), respectively, or body weight(Reference Ye, Chacko and Chou81, Reference Pol, Christensen and Bartels82). A Cochrane review of ten RCT focusing on interventions to increase fruit and vegetable consumption showed reductions in diastolic blood pressure, SBP and LDL-C, but analyses were based on only two trials(Reference Hartley, Igbinedion and Holmes83). Other meta-analyses reported no effect on HDL-C, TAG, FG or body weight(Reference Shin, Kim and Kang84, Reference Kaiser, Brown and Bohan Brown85). Meta-analyses investigating the effects of nut consumption reported reductions in TC, LDL-C, TAG, diastolic blood pressure, FG and glycosylated Hb (both in T2D patients)(Reference Musa-Veloso, Paulionis and Poon86–Reference Viguiliouk, Kendall and Blanco Mejia88), but no effects on body weight, HDL-C, SBP and C-reactive protein(Reference Mohammadifard, Salehi-Abargouei and Salas-Salvado87, Reference Flores-Mateo, Rojas-Rueda and Basora89, Reference Neale, Tapsell and Guan90). Focusing on legumes, one meta-analysis of ten RCT indicated that interventions to increase the intake of legumes were associated with decreased TC and LDL-C levels compared with a control group(Reference Bazzano, Thompson and Tees91), others reported reductions in C-reactive protein, SBP and FG(Reference Viguiliouk, Blanco Mejia and Kendall92, Reference Salehi-Abargouei, Saraf-Bank and Bellissimo93), but no effects on body weight(Reference Viguiliouk, Blanco Mejia and Kendall92). Evidence from meta-analyses of intervention trials showed that higher consumption of sugar-sweetened beverages (SSB) leads to a considerable increase in body weight(Reference Malik, Pan and Willett94, Reference Te Morenga, Mallard and Mann95).
Considering food groups of animal origin, higher consumption of eggs increased TC, LDL-C and HDL-C, but not TAG compared with control diets low in egg consumption(Reference Rouhani, Rashidi-Pourfard and Salehi-Abargouei96). A meta-analysis of RCT showed that higher dairy intake has no significant effect on change in SBP for interventions over 1–12 months(Reference Ding, Huang and Bergholdt97), and other meta-analyses showed no significant effects of either high- or low-fat dairy products on cardiovascular risk factors and body weight compared with a diet with lower amount of dairy(Reference Benatar, Sidhu and Stewart98, Reference Chen, Pan and Malik99). A recent meta-analysis showed that there is evidence indicating that consuming oily fish leads to significant improvements in two important biomarkers of cardiovascular risk, such as TAG and HDL-C, whereas no effects were observed for TC, LDL-C, diastolic blood pressure, SBP, FG and C-reactive protein(Reference Alhassan, Young and Lean100). Regarding meat intake, consumption of more than a half serving of total red meat daily does not influence blood lipids and lipoproteins or blood pressure compared with lower red meat intakes(Reference O'Connor, Kim and Campbell101).
Meta-analyses of cohort studies
A series of dose–response meta-analyses investigated the association between twelve a priori-defined food groups and risk of all-cause mortality, CHD, stroke, heart failure, T2D, colorectal cancer and hypertension (Table 3)(Reference Schwingshackl, Chaimani and Bechthold102). The meta-analysis for all-cause mortality included 100 cohort studies, and showed that higher intakes of whole grains, vegetables, fruit, nuts and fish were associated with lower risk of premature death, whereas higher intakes of red and processed meat and SSB were associated with higher overall mortality risk in the linear dose–response meta-analysis(Reference Schwingshackl, Schwedhelm and Hoffmann103). Focusing on T2D, the optimal consumption of risk-decreasing foods (two servings/d whole grains; two to three servings/d vegetables; two to three servings/d fruit; three servings/d dairy) resulted in a 42 % reduction of T2D risk, and consumption of risk-increasing foods (one serving/d eggs, two servings/d red meat, four servings/d processed meat and three servings/d SSB) was associated with a 3-fold T2D risk, compared with non-consumption of these food groups(Reference Schwingshackl, Hoffmann and Lampousi104). Regarding CVD, 123 cohort studies were identified. An inverse association was present for whole grains, vegetables and fruit, nuts and fish consumption, while a positive association was present for egg, red meat, processed meat and SSB consumption in the linear dose–response meta-analysis(Reference Bechthold, Boeing and Schwedhelm105). Taking into account twenty-eight reports investigating the association between the twelve food groups and the risk of hypertension, we could show that optimal intakes of whole grains, fruit, nuts, legumes and dairy were associated with a 44 % risk reduction, whereas high consumption of red and processed meat and SSB was related with a 33 % increased risk of hypertension(Reference Schwingshackl, Schwedhelm and Hoffmann106). Eighty-six cohort studies were included in the meta-analysis investigating the association between the twelve food groups and colorectal cancer risk. Optimal consumption of risk-decreasing foods (six servings/d whole grains, vegetables and dairy; and three servings/d fruit) results in a 56 % risk reduction of colorectal cancer, whereas consumption of risk-increasing foods of two servings/d red meat and four servings/d processed meat was associated with a 1·8-fold increased risk(Reference Schwingshackl, Schwedhelm and Hoffmann107). Previous meta-analyses of cohort studies comparing high v. low dietary intake reported a significant lower risk of weight gain for higher intake of whole grain products(Reference Ye, Chacko and Chou81) and a lower risk of adiposity for higher intake of fruit and vegetables and dairy(Reference Schwingshackl, Hoffmann and Kalle-Uhlmann108, Reference Schwingshackl, Hoffmann and Schwedhelm109). Another meta-analysis of observational studies reported consistent evidence that both red and processed meat intake was positively associated with the risk of obesity(Reference Rouhani, Salehi-Abargouei and Surkan110). Consistent evidence from another meta-analysis of cohort studies showed that high consumption of SSB is associated with a higher risk of weight gain(Reference Malik, Pan and Willett94).
Table 3. Evidence summary from meta-analyses of cohort studies investigating the association between twelve food groups and the risk of major chronic disease(Reference Ye, Chacko and Chou81, Reference Malik, Pan and Willett94, Reference Schwingshackl, Chaimani and Bechthold102–Reference Rouhani, Salehi-Abargouei and Surkan110)

*High v. low analysis; ![]() no association between food group intake and chronic disease; ↑ increased risk with higher intake;
no association between food group intake and chronic disease; ↑ increased risk with higher intake; ![]() decreased risk with higher intake; NA, not assessed. The thickness of arrows corresponds to the quality of evidence:
decreased risk with higher intake; NA, not assessed. The thickness of arrows corresponds to the quality of evidence: ![]() /
/![]() = high;
= high; ![]() /
/![]() = moderate;
= moderate; ![]() /
/![]() = low;
= low; ![]() /
/![]() = very low.
= very low.
Credibility of the evidence
Table 3 gives an overview of the NutriGrade judgement on the association between intake of food groups and the risk of chronic diseases derived from meta-analyses of cohort studies(Reference Schwingshackl, Schwedhelm and Hoffmann103–Reference Schwingshackl, Schwedhelm and Hoffmann107). The credibility of evidence was rated high for the inverse association between whole grain intake and the risk of all-cause mortality and T2D, as well as for the positive association between red meat, processed meat and SSB and the risk of T2D. For these associations, further research probably will not change our confidence in the estimates. Most of the evidence for the associations between the twelve food groups and chronic disease risk is based on low and moderate quality of evidence, and further research could provide or add (important) evidence.
Conclusions
FBDG are the preferred approach to guide the population regarding their dietary habits, and such guidelines should be based on a high grade of evidence as requested in many other areas of public health practice. The most straightforward approach to generate evidence is meta-analysing published data based on a careful phrasing of the research question (participants, interventions/exposure, comparisons, outcomes and study design). Hereby, it is important to generate evidence by applying meta-analytical methods to both major study designs (RCT and cohort studies). Regarding credibility of evidence assessment, risk of bias and other characteristics of the meta-analyses should be assessed, rated and scored (NutriGrade).
Evidence from large meta-analyses of cohort studies suggest that higher intake of plant origin food groups such as whole grains, fruit, vegetables, nuts and legumes are associated with a lower risk of chronic diseases, whereas higher intake of red and processed meat and SSB are associated with increased risk of T2D, CVD and hypertension. Although the evidence from meta-analyses of RCT is much more incomplete, it was shown that several food groups such as whole grains, fruit and vegetables, nuts, legumes and fish had a beneficial effect on the cardio-metabolic risk profile. To further contribute to the evaluation of the complete picture of FBDG, we propose conducting NMA of RCT considering and rating different food groups in one analysis. Moreover, the health impact of the different foods can be calculated by DALY for the various clinical outcomes and the overall results compared across the food groups and across approaches that consider the correlations between health outcomes. For future FBDG, we recommend to implement evidence from pairwise and NMA and to quantify the health impact of diet–disease relationships.
Financial Support
None.
Conflict of Interest
None.
Authorship
L. S., S. S., B. D., K. I., S. K., and H. B. wrote the first draft of the paper. All authors contributed to the paper's content and made suggestions and edits to drafts. All authors have read and approved the final version of the paper.


 Open access