


There is widespread acknowledgement of the presence of vitamin D deficiency in the community and the pressing need from a public health perspective to address this deficiency( Reference Cashman and Kiely 1 ). Taking a serum 25-hydroxyvitamin D (25(OH)D) concentration of 30 nm/l as the cut-off below which the risk of clinical vitamin D deficiency increases (manifesting as nutritional rickets in children and osteomalacia in adults)( 2 , Reference Munns, Shaw and Kiely 3 ), prevalences of vitamin D deficiency (based on standardised serum 25(OH)D data) in representative population samples in the USA (n 15 652)( Reference Schleicher, Sternberg and Looker 4 ), Canada( Reference Sarafin, Durazo-Arvizu and Tian 5 ) (n 11 336) and Europe (n 55 844)( Reference Cashman, Dowling and Škrabáková 6 ) have been recently reported as 5·9, 7·4 and 13 %, respectively. Even a crude estimation based on the magnitude of populations in these three regions coupled with the earlier prevalences, suggest something in the region of 120 million individuals deficient. Dietary reference intervals for vitamin D, which are estimates of the dietary requirements for the vitamin, are crucial from a public health perspective in providing a framework for prevention of vitamin D deficiency and optimising vitamin D status of individuals( Reference Cashman 7 ). While in North America the term used to describe the distribution of dietary requirements is dietary reference intakes (DRI), its equivalent in Europe is dietary reference values (DRV)( Reference Cashman 8 ). An enormous body of research in relation to various aspects of vitamin D and health over the past few decades and a half has been instrumental in informing recent DRV/DRI for vitamin D( Reference Cashman 7 ). While there are a family of nutrient reference values within the DRI and DRV, two shared constituent values within both, and which are of key public health importance, are the estimated average requirement (EAR) and the RDA (or its equivalent). The EAR is the level of (nutrient) intake that is adequate for half the people in a population group, and also serves as the basis for calculating the RDA (or equivalent), a value intended to meet the needs of nearly all (i.e. 97·5 %) healthy individuals in a population( 2 , 9 ). Despite the fact that the DRI/DRV for vitamin D have been re-evaluated on either side of the Atlantic in the past 5 years( Reference Cashman 7 ), and has culminated in quite contrasting recommendations (see later), nevertheless, they collectively point very strongly towards a need for creative food-based approaches for prevention of vitamin D deficiency and maintenance of nutritional adequacy. However, persistent knowledge gaps are barriers to developing and implementing such safe and effective food-based approaches( Reference Kiely and Cashman 10 ). First of all, the present review concisely overviews current DRI/DRV for vitamin D as key dietary targets. It will then also briefly benchmark current intakes of vitamin D in selected representative samples in Europe and North America against these dietary targets, and, finally, it considers means of addressing the gap between current intakes and these dietary targets. In particular, focus will be placed on the area of fortification of food with vitamin D, and especially ‘biofortification’ with vitamin D, as a means of increasing the distribution of vitamin D intake in the population to prevent vitamin D deficiency.
Dietary reference intakes/dietary reference values from North America, the UK and European Union: variable estimates of dietary vitamin D requirement
It is important to re-iterate that devising nutrient recommendations for population intakes relies on scientific analysis and judgement of data that exist within a specified time frame and is an iterative process( Reference Cashman and Kiely 1 ). It is notable in that context, within the past 5 years there have been re-evaluations of vitamin D recommendations by at least six expert bodies on either side of the Atlantic, and four of these have been reviewed in detail elsewhere( Reference Cashman 7 , Reference Cashman 8 , Reference Cashman and Kiely 11 ). For this present work, we will focus on the two very most recent DRV in Europe, namely those from the Scientific Advisory Committee on Nutrition (SACN) in the UK( 12 ) and from the European Food Safety Authority (EFSA)( 13 ), as well as referencing the DRI from the Institute of Medicine (IOM) in the USA( 2 ), as their most current recommendations but also a landmark evaluation and report in the current era of dietary requirement estimates for vitamin D. Of note, despite being based on a largely similar underpinning scientific evidence-base, there is significant variation in the recommendations from these three sets of DRI/DRV (see later). It is not within the scope of the present review to explore in detail all the reasons why the recent DRI/DRV differ, but in the context of considering food-based solutions for prevention of vitamin D deficiency, it is worth summarising briefly what these three agencies established as their DRI/DRV and also based on what criteria to establish nutrient adequacy for vitamin D. All three agencies used serum 25(OH)D as the biochemical indicator of vitamin D exposure/status( 2 , 12 , 13 ). This is not surprising as it has been shown to be a robust indicator of vitamin D status( Reference Seamans and Cashman 14 ), albeit with some potential limitations( Reference Cashman and Kiely 1 ).
Selection of criteria to establish vitamin D adequacy
All three agencies adhered to the risk assessment framework for DRI/DRV development and, as such, following a review of the evidence-base in relation to vitamin D and health (skeletal and non-skeletal) effects, all three agencies used (musculo-)skeletal health outcomes (and in addition EFSA used pregnancy-related health outcomes) upon which to base the development of their respective DRI/DRV( 2 , 12 , 13 ). The IOM DRI committee selected calcium absorption, bone mineral density and either rickets in children or osteomalacia in adults, for which the evidence was sufficiently strong, for DRI development for vitamin D( 2 ). SACN selected musculoskeletal health (rickets, osteomalacia, falls, muscle strength and function, depending on age group)( 12 ), whereas EFSA considered that the available evidence on serum 25(OH)D concentration and musculoskeletal health outcomes and pregnancy-related health outcomes were suitable to set DRV for vitamin D for adults, infants, children and pregnant women, respectively( 13 ). Even though the DRI/DRV were majorly influenced by bone-related health outcomes, the choice of these different individual outcomes, either collectively or individually, influenced the selection of serum 25(OH)D concentration(s) upon which to base the DRI/DRV (Table 1). The IOM DRI committee established a serum 25(OH)D concentration of 40 nm/l as the median value above which approximately half the population might meet its vitamin D requirement in terms of bone health (and below which half might not; and which formed the basis for establishment of their EAR) and 50 nm/l as its estimate of the serum 25(OH)D concentration that would meet the requirement of nearly all (i.e. 97·5 %) normal healthy persons, and which thus formed the basis of the establishment of their RDA( 2 ). The EFSA panel concluded that serum 25(OH)D concentration of 50 nm/l is a suitable target value to set the DRV for vitamin D, for all age and sex groups( 13 ). In contrast, SACN considered that the evidence overall suggested the risk of poor musculoskeletal health was increased at serum 25(OH)D concentrations below about 20–30 nm/l( 12 ). They felt it was not possible to identify a specific serum 25(OH)D threshold concentration between 20 and 30 nm/l associated with increased risk of poor musculoskeletal health due to different analytical methods for serum 25(OH)D used in the various studies, so decided to retain the previously used 25 nm/l( 12 ). This previous threshold was used to indicate increased risk of vitamin D deficiency as relates to rickets and osteomalacia( 15 ), which is largely consistent with 30 nm/l, which the IOM DRI committee had indicated reflects increased risk of vitamin D deficiency( 2 ). Furthermore, SACN suggested that the use of 25 nm/l represents a ‘population protective level’ in that it is a concentration that individuals in the UK should be above, throughout the year, in terms of protecting musculoskeletal health( 12 ).
Table 1. Selected dietary reference values/dietary reference intakes for vitamin D*
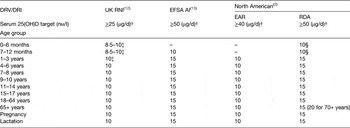
DRI, dietary reference intakes; DRV, dietary reference values; RNI, reference nutrient intake; AI, adequate intake; EAR, estimated average requirement; 25(OH)D, 25-hydroxyvitamin D.
* All established under conditions of minimal cutaneous vitamin D synthesis.
† To convert vitamin D reference intakes from μg/d to IU/d, multiply by 40.
‡ Set as a safe intake; set for some nutrients if there were insufficient data to set DRV. They are judged to be a level or range of intake at which there is no risk of deficiency, and below a level of where there is undesirable effects( 15 ).
§ Set as adequate intake.
Vitamin D dietary reference intakes and dietary reference values
Using these various serum 25(OH)D target concentrations, the three expert bodies were able to derive dietary requirement estimates, which form their respective DRI/DRV for vitamin D. Both IOM and EFSA used a mega-regression approach on data from winter-based vitamin D randomised controlled trials (RCT) which reported serum 25(OH)D response( 2 , 13 ), while SACN used requirement estimates derived from analysis and modelling of individual subject-level data from what they considered as three highly UK-appropriate vitamin D dose-related RCT( Reference Cashman, Hill and Lucey 16 – Reference Cashman, FitzGerald and Viljakainen 18 ), all of which focused on the estimation of vitamin D dietary requirements in different population age-groups. The pros and cons of these two different approaches have been well versed elsewhere( Reference Cashman 7 , Reference Cashman and Kiely 11 – 13 , Reference Cashman, Fitzgerald and Kiely 19 ), but undoubtedly contribute to intake estimates, which differ dramatically, even if one uses the same serum 25(OH)D target concentration( Reference Cashman, Fitzgerald and Kiely 19 ). Irrespective of this, it is notable that while all three agencies have an EAR and RDA (or equivalent) available within their family of respective DRV/DRI, the IOM established EAR and RDA values for most age-groups( 2 ), whereas SACN established only a reference nutrient intake (RNI; their RDA equivalent) for most age-groups but not an EAR (because in general there is never as high as 50 % with serum 25(OH)D <25 nm/l, prohibiting its estimation for most age-groups)( 12 ), and EFSA established adequate intake values in place of either EAR or population reference intakes (their RDA equivalent)( 13 ) (Table 1). EFSA in their 2010 scientific opinion on principles for deriving and applying DRV had proposed that an adequate intake should be derived when population reference intakes cannot be established for a nutrient because an EAR cannot be determined( 9 ). An adequate intake is the average observed daily level of intake by a population group (or groups) of apparently healthy people that is assumed to be adequate( 9 ). To illustrate the variability in the current recommendations, if one selects adults aged 19–64 years as an example, the vitamin D intakes established to ensure the adequacy of the vast majority of individuals (97·5 %) in either North America or the European Union are 15 µg/d (with serum 25(OH)D at 50 nm/l as the target), 10 µg/d will meet the needs of half the individuals in North America (again at 50 nm/l as the target), whereas in the UK, 10 µg/d will ensure the adequacy of the vast majority of individuals but using serum 25(OH)D at 25 nm/l as the target (see Table 1).
Application of dietary reference intakes and dietary reference values for vitamin D
Not only do the types of DRV/DRI that the three different agencies established differ, so too does their application from a public health nutrition perspective in terms of assessing the risk of (in)adequacy of nutrient intake in populations. For example, EFSA suggest that the EAR can be used to estimate the prevalence of inadequate intakes of micronutrients (the average requirement cut-point method), if the distribution of nutrient intakes is normal, and intakes are independent from requirements( 9 ). The percentage of the population with a habitual daily nutrient intake that is lower than the EAR is taken as an estimate of the percentage of the population with probable inadequate intakes. Thus, the IOM established EAR( 2 ) can be utilised in this context in terms of nutritional surveillance. The RDA (and RNI/population reference intakes) is an intake level that covers the requirement of 97·5 % of all individuals when requirements of the group have a normal distribution( 2 , 12 , 13 ), it should therefore not be used as a cut-point for assessing nutrient intakes of groups because a certain overestimation of the proportion of the group at risk of inadequacy would result( 9 ). The current North American RDA( 2 ) and UK RNI( 12 ), however, will have application in terms of assessing diets of individuals( Reference Cashman 8 , 9 ). Groups with mean intakes at or above the adequate intake (as established by EFSA and for infants and/or young children by IOM and SACN) can be assumed to have a low prevalence of inadequate intakes for the defined criterion of nutritional status( 9 ). Higher intakes convey no additional health benefit and in fact if they exceed the tolerable upper level, may cause harm( 9 ).
A clear public health lesson despite the dietary reference values/dietary reference intakes being disparate
Notwithstanding the variability in current DRV/DRI, benchmarking European population intakes against a vitamin D intake value of 10 µg/d, corresponding both to the North American EAR( 2 ) and the RNI in the UK( 12 ), shows that there is between 55 and 100 % of adults (19–64 years) and older adults (>64 years) with inadequate intakes( Reference Roman Viñas, Ribas Barba and Ngo 20 ) on this basis. Typical average intakes by adult populations in the European Union are generally about 3–7·5 µg/d, depending on the country( Reference Roman Viñas, Ribas Barba and Ngo 20 ). The European Nutrition and Health Report summarised vitamin D intake in children and teenagers (aged 4–14 years) and showed that intakes were in the range 1·2–6·5 µg/d( Reference Elmadfa, Meyer and Nowak 21 ). The dietary intakes of children and adults in North America and some European countries have been comprehensively reviewed elsewhere by Kiely and Black( Reference Kiely and Black 22 ), and the readers are referred to that review for more detailed analysis of population intakes of vitamin D from select countries relative to the EAR. The estimates clearly show that the habitual mean vitamin D intakes by European and North American populations are below the estimates of intake requirement. While at first glance recommending improving intake of naturally occurring vitamin D-rich foods would appear intuitive, it is the least likely strategy to counteract low dietary vitamin D intake due to the fact that there are very few food sources that are rich in vitamin D( Reference Cashman 7 , Reference Kiely and Black 22 ). Furthermore, most of these are not frequently consumed by many in the population( 12 , Reference Kiely and Black 22 – Reference Henderson, Irving and Gregory 24 ). There have been calls for use of vitamin D supplements as a means of correcting low vitamin D status in European populations, and vitamin D supplement use has been recommended as national policy in certain countries, particularly for at-risk population groups( 15 ). While vitamin D supplementation has been shown to significantly improve vitamin D intake across a variety of age and sex groups, with dose-dependent increases in serum 25(OH)D( Reference Seamans and Cashman 14 ), relying on supplements is not an appropriate public health strategy to increase intakes across the population distribution because supplements are only effective in those who consume them and uptake within the population being generally too low to provide widespread population protection, has been outlined elsewhere( Reference Kiely and Cashman 10 , Reference Cashman 25 , Reference Cashman and Kiely 26 ). Data from three nationally representative cross-sectional dietary surveys in Ireland (a survey in children (n 594; 5–12 years)( Reference Black, Walton and Flynn 27 ), teenagers (n 441; 13–17 years)( Reference Black, Walton and Flynn 27 ) and adults (n 1274; 18–64 years)( Reference Black, Walton and Flynn 23 ), illustrate this point very clearly. The surveys showed that 97–99 % of all boys, 98–99 % of all girls and 90 % of all adults had inadequate intakes of vitamin D, as defined as ≤10 µg/d. The percentage of adults who consumed vitamin D-containing supplements was only 16 %( Reference Black, Walton and Flynn 23 ), and a total of 21 % of 5–8-year olds, 16 % of 9–12-year olds and 15 % of 13–17-year olds consumed a vitamin D-containing supplement at least once during the recording days of their survey( Reference Black, Walton and Flynn 27 ). Moreover, even in users of vitamin D-containing supplements within the three surveys, 88–96, 88–90 and 57 % of those boys, girls and adults (aged 18–64 years) with supplemental vitamin D, respectively, had inadequate intakes( Reference Black, Walton and Flynn 23 , Reference Black, Walton and Flynn 27 ).
In comparison with vitamin D supplementation or relying on improving intake of naturally occurring vitamin D-rich foods, food fortification may represent the best opportunity to increase the vitamin D supply to the population, even though it is not also without its challenges. Fortification of foods with vitamin D in the USA and Canada has an important effect on the mean daily intake of vitamin D by the average adult; however, Calvo and Whiting( Reference Calvo and Whiting 28 ) suggest that the current level of fortification in the USA and Canada is not effective in reaching the required levels of vitamin D intake. Fulgoni et al. showed using data from National Health and Nutrition Examination Survey 2003–2006 that the percentage of individuals in the USA aged 2 years and older below the EAR was reduced when the contribution of vitamin D-fortified foods was accounted for, but still 93·3 % did not reach the EAR( Reference Fulgoni, Keast and Bailey 29 ). The adult nutrition survey in Ireland, mentioned earlier, recently showed that the percentage failing to meet the EAR was 98 % in non-consumers of vitamin D supplements or vitamin D-fortified foods, and 95 % in non-consumers of vitamin D supplements but who consumed vitamin D-fortified foods( Reference Black, Walton and Flynn 23 ). Flynn et al., have shown that the 95th percentile of intake of vitamin D from voluntary fortified foods in Europe is low( Reference Flynn, Hirvonen and Mensink 30 ). These findings of relatively low impact of vitamin D-fortified foods to date may relate to the level of fortification, types and choice of food vehicles and the issue of mandatory or optional/voluntary fortification( Reference Kiely and Black 22 , Reference Cashman 25 ) as well as market penetrance of voluntary fortified foods. The remainder of the review will focus on how careful application of traditional food fortification (nutrient addition in controlled amounts) and ‘biofortification’ (enrichment of animal food sources, such as meats, eggs, and fish, as well as of mushrooms) strategies could be used to safely increase intakes of vitamin D across the distribution and prevent deficiency within the general population. In addition, it will highlight the ongoing need and role the research has in terms of addressing persistent knowledge gaps that exist and which are barriers to developing and implementing such safe and effective food-based approaches towards prevention of vitamin D deficiency.
Using food-based solutions for increasing vitamin D intake in the population
While under legislation in North America and Europe, several food types can be fortified, milk and margarine are the foods with the longest tradition of fortification( Reference Cashman and Kiely 31 ). Canada currently has mandatory fortification of milk and margarine with vitamin D as stipulated by the Canadian Food and Drug Regulations, while fluid milk in the USA is not required to have vitamin D added unless the label declares that it is fortified; in practice almost all milk is fortified with vitamin D on a voluntary fortification basis( Reference Calvo and Whiting 32 ). Currently within Europe, fortification practices vary between countries and may be applied voluntarily by manufacturers or implemented by national legislation. The evidence-base for effectiveness of vitamin D fortification of milk and other dairy food in terms of its impact on vitamin D intake and serum 25(OH)D has been reviewed elsewhere( Reference Cashman and Kiely 31 , Reference Black, Seamans and Cashman 33 ), and ranges from supportive data from several RCT to evidence from modelling of population intakes and status. Overall, there is little doubt that vitamin D-fortified dairy foods play a key role in addressing low vitamin D intakes, especially where there is mandatory fortification( Reference Cashman and Kiely 31 ). It is notable, even in Canada with mandatory fortification, there is still >80 % prevalence of dietary inadequacy of vitamin D; however, recent modelling of their nationally representative data (2004 Canadian Community Health Survey 2·2 with n 34 381) showed that this prevalence could be decreased to <50 % in all groups with increased vitamin D levels in milk and the addition of vitamin D to cheese and yoghurt at various levels( Reference Shakur, Lou and L'Abbe 34 ). Furthermore, in countries where fortification of milk is voluntary and the uptake is far less than in the USA, the impact of vitamin D-fortified milk and dairy on adequacy of intake of the vitamin is understandably low. The problem of fortifying a single staple, e.g. milk or focusing on a commodity sector such as dairy, is that it does not increase the vitamin D supply in non- or low consumers( Reference Black, Seamans and Cashman 33 ). Thus, while acknowledging the valuable contribution fortified milk makes to vitamin D intakes among consumers, particularly in children, and the continued need for fortification of milk and other dairy products, it has been suggested that additional strategic approaches to fortification, including biofortification, of a wider range of foods, have the potential to increase vitamin D intakes in the population( Reference Cashman and Kiely 31 ).
Traditional fortification of foods other than dairy with vitamin D
In terms of diversification of food fortification beyond milk, Madsen et al.( Reference Madsen, Rasmussen and Andersen 35 ) recently provided experimental evidence, in the form of RCT data, of the effects of vitamin D-fortified milk and bread on serum 25(OH)D in 201 families (n 782 children and adults, aged 4–60 years) in Denmark during winter. Bread was included as an additional vehicle for fortification in recognition of the skewness of milk intake across some population groups. The groups randomised to vitamin D unfortified and fortified foods had median intakes of vitamin D of 2·2 and 9·6 µg/d, respectively, over the 6 months of the study. By the end of the study period, none and 16 % in the fortified food group had serum 25(OH)D levels below 25 and 50 nm/l, respectively, with the corresponding prevalence estimates for the group receiving unfortified foods at 12 and 65 %, respectively( Reference Madsen, Rasmussen and Andersen 35 ). Evidence of effectiveness of food fortification approaches from RCT, which evaluate their impact on reducing the prevalence of vitamin D deficiency in the populations studied is a key priority( Reference Cashman and Kiely 1 ), but also dietary modelling analysis based on data from nationally representative dietary surveys can provide in silico projections of how these food interventions may impact on the degree of vitamin D intake inadequacy in the population( Reference Black, Walton and Flynn 23 ). For example, Allen et al. ( Reference Allen, Dangour and Tedstone 36 ) recently modelled the impact of a number of simulated vitamin D fortification scenarios, with milk and wheat starch identified as primary fortification vehicles, on vitamin D intake distribution within the first 2 years (2008–2010) of the UK National Diet and Nutrition Survey rolling programme (n 2127 individuals). At a simulated fortification of 10 µg vitamin D/100 g wheat starch, the proportion of at-risk groups estimated to have vitamin D intakes below the UK RNI was reduced from 93 to 50 %( Reference Allen, Dangour and Tedstone 36 ). Interestingly, the simulation of the fortification of wheat starch at this concentration was more effective than that of the fortification of milk (at concentrations between 0·25 and 7 µg vitamin D per 100 litre milk) or of the fortification of milk and starch combined. The authors suggested that vitamin D fortification of wheat starch could be a viable option for safely improving vitamin D intakes and the status of the UK population groups at risk of deficiency( Reference Allen, Dangour and Tedstone 36 ).
Vitamin D–calcium interactions: a consideration for vitamin D fortification of food?
The mandatory fortification of a food vehicle other than milk or margarine, raises an interesting issue. A general consideration underpinning the establishment of DRV/DRI is that there is the presupposition that in setting the requirements for one nutrient, requirements for energy and all other nutrients are met( 2 , 12 , 13 ). For example, despite the strong interactions between vitamin D and calcium, the DRV/DRI for vitamin D are set on the assumption that requirements for calcium are met and vice versa. In reality, however, this does not happen, since a significant proportion of populations in the USA and Europe have dietary calcium intakes that are inadequate( 2 , Reference Flynn, Hirvonen and Mensink 30 ). In fact, the US 2015–2020 Dietary Guidelines for Americans Committee identified both vitamin D and calcium as two of the four identified nutrients of public health concern( 37 ). The IOM( 2 ) in their DRI report on calcium and vitamin D highlighted that there was ambiguity in the available data on the influence of dietary calcium intakes on regulation of serum 25(OH)D and its catabolism. This is of consequence when considering vitamin D fortification policies, due to the inter-relationship that exists between calcium and vitamin D in the body and raises the question if the range of foods for vitamin D fortification, should have calcium naturally present (e.g. dairy produce) or if both of these nutrients should be added in tandem.
Data from animal studies suggest that low calcium intake can reduce the plasma half-life of 25(OH)D, due to its increased hepatic conversion to metabolites, which are excreted in bile( Reference Clements, Johnson and Fraser 38 ). This increased catabolism of serum 25(OH)D could potentially increase the dietary vitamin D requirement. Indeed, calcium intake has been reported as a significant determinant of serum 25(OH)D in some, but not all observational studies( Reference Lips 39 ). One RCT in healthy men reported a large increase (30 %) in serum 25(OH)D in subjects supplemented with calcium compared with that in subjects with normal calcium intakes( Reference Berlin and Bjorkhem 40 ), whereas two other RCT showed no effect of additional calcium on serum 25(OH)D in healthy adults( Reference Goussous, Song and Dallal 41 , Reference McCullough, Bostick and Daniel 42 ). However, caution is needed because all three RCT had design characteristics that may have affected the interpretation of their findings in relation to vitamin D DRI/DRV. Data from a recent 15-week winter-based, randomised, placebo-controlled, double-blind vitamin D3 intervention study in older adults, aged >50 years (n 125), who were stratified according to calcium intakes (moderate-low (<700 mg/d) or high (>1000 mg/d) intake), showed responses in serum 25(OH)D concentrations throughout winter as well as indices of vitamin D activation and catabolism were similar irrespective of whether the older adults had relatively low or high habitual calcium intakes( Reference Cashman, Hayes and O'Donovan 43 ). Not only do these findings suggest that recent vitamin D DRI/DRV will cover the vitamin D needs of even those individuals who have inadequate calcium intakes( Reference Cashman, Hayes and O'Donovan 43 ), it also strengthens the case for consideration of widening the range of foods for fortification or biofortification with vitamin D beyond those that are also a source of calcium.
Vitamin D-biofortified foods
While traditional fortification practices in which exogenous vitamin D is added to dairy and other foodstuffs will continue to be an important approach for increasing vitamin D in the food supply, the use of vitamin D biofortified (also referred to as bio-addition( Reference Calvo and Whiting 32 )) foods also merits serious attention( Reference Cashman 7 , Reference Cashman and Kiely 31 ). In this approach, the animal produce (such as, for example, cultured fish, beef, pork, lamb, chicken and eggs) could have increased vitamin D and/or 25(OH)D contents by virtue of addition of vitamin D and/or 25(OH)D (where permissible) to the livestock feeds. In biofortification, the vitamin D compounds in the resulting foodstuffs from the animals will be incorporated in a manner similar to native vitamin D and unlike in traditional fortification will be under some degree of biological regulatory control mechanisms in the animal. In this regard, it is possible that biofortification may hold more consumer appeal in some cases. An important concept in relation to vitamin D biofortification is that it can increase the ‘total vitamin D activity’ of the biofortified foods. Total vitamin D activity is that used in several food composition tables( 44 – Reference Saxholt, Christensen and Møller 46 ), including the UK McCance and Widdowson( 44 ), and which accounts not only for the vitamin D content of the food, but also the content of the key metabolite in the food, 25(OH)D (which is usually multiplied by a factor of 5). In a RCT setting, consumption of orally consumed synthetic 25(OH) D3 has been shown to be five times more effective than an equivalent amount of vitamin D3 at improving serum 25(OH)D concentrations of older adults in winter( Reference Cashman, Seamans and Lucey 47 ). Improving the total vitamin D activity (i.e. content of vitamin D3 plus 25(OH)D × 5) of these foods may be of consequence not only to the population as a whole, but in particular, for low or non-consumers of vitamin D-fortified dairy products and also ethnic sub-groups. For example, in the Irish adult diet, the meat, fish, egg food groups, even without biofortification, collectively contribute about 40 % to the mean daily intake of vitamin D( Reference Black, Walton and Flynn 23 ). Van Horn et al.( Reference Van Horn, Bausermann and Affenito 48 ) reported that in US adolescent girls while the meat and bean food group contributed about 4 % to the mean daily intake of vitamin D in white girls, it contributed 26 % to the mean daily intake of vitamin D in African American girls. The possibility of enhancing the vitamin D activity of meat and other relevant foods further by biofortification and its potential impact on population and ethnic subgroup intake estimates is of significant public health nutrition relevance.
Vitamin D-enhanced eggs and other animal produce
The most researched vitamin D-biofortified food to date is, without doubt, eggs. In the past 15 years, there have been several reports illustrating that the vitamin D3 content of eggs can be significantly increased by the greater addition of vitamin D3 to the feed of hens( Reference Mattila, Lehikoinen and Kiiskinen 49 – Reference Hayes, Duffy and O'Grady 55 ); however, several of these studies( Reference Mattila, Rokka and Konko 50 – Reference Browning and Cowieson 54 ) used levels of inclusion above the upper allowable level for feeds in Europe (3000 IU/kg diet( 56 ); see Fig. 1). Addition of commercially available 25(OH) D3 to the diet of hens, has also been shown to increase egg 25(OH) D3 content( Reference Mattila, Valkonen and Valaja 52 , Reference Browning and Cowieson 54 , Reference Hayes, Duffy and O'Grady 55 ), albeit two studies( Reference Mattila, Valkonen and Valaja 52 , Reference Browning and Cowieson 54 ) used 25(OH) D3 at levels above the upper allowable level (0·080 mg/kg diet( 57 )). Many of these studies were predominantly focused on the effect that higher levels of vitamin D compounds in animal feeds may have on the welfare of the animal itself or the quality of their produce (e.g. eggshell strength and laying rate) rather than its impact on the vitamin D activity of the resulting eggs and their potential to improve the vitamin D status of human subjects. In terms of producing eggs that would be acceptable for human consumption, we have recently demonstrated that additional vitamin D and/or 25(OH) D3 at levels adhering to the maximum allowable European Union regulation( 56 , 57 ), resulted in eggs with increased vitamin D activity (providing about 5 µg per egg), and, importantly, no deterioration of consumer acceptability of the biofortified eggs compared with usual eggs( Reference Hayes, Duffy and O'Grady 55 ). Thus, such vitamin D-biofortified eggs could supply half the EAR for vitamin D. As mentioned earlier, evidence of effectiveness of food fortification approaches from RCT, which evaluate their impact on reducing the prevalence of vitamin D deficiency in the populations studied, is a key priority in terms of the evidence-base. Importantly, in that context, we have also very recently shown in a winter-based RCT of older adults (n 55) that weekly consumption of seven vitamin D-biofortified eggs, produced by hens provided with feed containing either vitamin D3 or 25(OH) D3 at the allowable maximum content, prevented the typical decline in serum 25(OH)D concentration during winter and any incidence of vitamin D deficiency( Reference Hayes, Duffy and O'Grady 55 ). The control group in the study, who were requested to consume weekly up to a maximum of two commercially available eggs, had a significant decline in serum 25(OH)D over the 8 weeks of winter, and 22 % had vitamin D deficiency (serum 25(OH)D <25 nm/l) at endpoint( Reference Hayes, Duffy and O'Grady 55 ). From a dietary guideline perspective, the general population can include up to seven eggs a week in their diet( Reference Krauss, Eckel and Howard 58 ), and our RCT showed no difference in serum total cholesterol among control and vitamin D-biofortified egg groups( Reference Hayes, Duffy and O'Grady 55 ).

Fig.1. The achieved vitamin D3 content of egg yolk (μg/100 g) reported from published studies of the effect of different vitamin D and/or 25-hydroxyvitamin D supplementation in laying hen feeds. The first number in parenthesis in the X-axis denotes the study from which these data are derived as follows: (1) Mattila et al.( Reference Mattila, Lehikoinen and Kiiskinen 49 ); (2) Mattila et al.( Reference Mattila, Rokka and Konko 50 ); (3) Mattila et al.( Reference Mattila, Valaja and Rossow 51 ); (4) Mattila et al.( Reference Mattila, Valkonen and Valaja 52 ); (5) Yao et al.( Reference Yao, Wang and Persia 53 ); (6) Browning & Cowieson( Reference Browning and Cowieson 54 ); (7) Hayes et al.( Reference Hayes, Duffy and O'Grady 55 ). Blue bars indicate where additions adhered to EU upper allowable levels; red bars indicate where additions exceeded EU upper allowable levels.
In a similar fashion, the potential of biofortification of other animal-derived foods (such as beef, pork and cultured fish) with vitamin D compounds are currently under investigation in a number of animal feeding trials in both an European Union Framework 7 collaborative project called ODIN (Food-based solutions for optimal vitamin D nutrition and health through the life cycle; www.ODIN-vitD.eu) and an Irish nationally funded project (EnhanceD Meats; http://www.ucc.ie/en/vitamind/history/ongoing/enhancedmeats). Vitamin D-biofortified foods, together with vitamin D-fortified dairy and bread, have also been tested in a winter-based RCT, within the ODIN project, in terms of evaluating their potential at raising serum 25(OH)D in Danish white and South Asian women at high risk of vitamin D deficiency. The results of this research will become available over the next 12 months. Following the demonstration of efficacy of these vitamin D-biofortified foods on response of serum 25(OH)D in RCT settings, as mentioned earlier, dietary modelling analysis based on data from nationally representative dietary surveys within ODIN will provide in silico projections of how these food interventions may impact on the degree of vitamin D intake inadequacy in the population.
Use of UV radiation to enhance vitamin D content of foods
Finally, biofortification with vitamin D could also embrace the practice of UV irradiation of mushrooms and baker's yeast, which have been shown to stimulate their endogenous vitamin D2 content. These foods may be a useful strategy to increase vitamin D intakes for vegetarians or those who do not consume meat or animal-derived foods for cultural reasons, but also for the wider population, particularly in the case of bread, as mentioned earlier. From a technological perspective, these UV-irradiated foods can be produced with anything from low to very high levels of vitamin D2. However, in terms of RCT-based evidence of effectiveness, a recent 8-week RCT within the ODIN project( Reference Itkonen, Skaffari and Saaristo 59 ), investigated the bioavailability of D2 from UV-irradiated yeast present in bread in healthy 20–37-year-old women (n 33) in Helsinki (60°N) during winter. Four study groups were given different study products, either a placebo pill and regular bread (providing 0 µg vitamin D2 or D3/d); a vitamin D2 supplement and regular bread (providing 25 µg vitamin D2/d); a vitamin D3 supplement and regular bread (providing 25 µg vitamin D3/d); or a placebo pill and vitamin D2-fortified bread (made with UV yeast; providing 25 µg D2/d). Serum 25(OH)D concentration was measured at baseline, midpoint (week 4) and endpoint (week 8). The study showed that consumption of the UV yeast–vitamin D2-fortified bread did not affect serum 25(OH)D concentration, unlike the increases seen in those receiving supplemental vitamin D together with regular bread( Reference Itkonen, Skaffari and Saaristo 59 ). This was despite the fact that the bread, even following the baking process, was analysed and shown to actually contain the 25 µg vitamin D2. Thus, this new data suggest that vitamin D2 from UV-irradiated yeast in bread, despite being present post-baking, was not bioavailable in human subjects.
The RCT data demonstrating that the vitamin D2 in UV-treated mushrooms can increase vitamin D status of consumers has been quite mixed, and accordingly, we recently undertook a systematic review and meta-analysis of the impact of UV-exposed mushrooms on serum 25(OH)D response in these RCT( Reference Cashman, Kiely and Seamans 60 ), again within the ODIN project. Our structured search yielded six RCT, meeting our inclusion criteria, and a meta-analysis of these six RCT showed serum 25(OH)D that was not significantly increased (P = 0·12) by UV-exposed mushrooms, but there was high heterogeneity (I 2 = 87 %). Including only the three European-based RCT (mean baseline 25(OH)D, 38·6 nm/l), serum 25(OH)D was increased significantly by UV-exposed mushrooms, whereas there was no significant effect in the three US-based RCT (P = 0·83; mean baseline 25(OH)D: 81·5 nm/l)( Reference Cashman, Kiely and Seamans 60 ). Analysis of serum 25(OH)D2 and serum 25(OH)D3 (n 5 RCT) revealed a statistically significant increase and decrease after supplementation with UV-exposed mushrooms (weighted mean differences of 20·6 and −13·3 nm/l, respectively: P ≤ 0·001)( Reference Cashman, Kiely and Seamans 60 ). Thus, consumption of UV-exposed mushrooms may increase serum 25(OH)D when baseline vitamin D status is low via an increase in 25(OH)D2 and despite a concomitant but relatively smaller reduction in 25(OH)D3. However, when baseline vitamin D status is high, the mean increase in 25(OH)D2 and a relatively similar reduction in 25(OH)D3 explain the lack of effect on serum 25(OH)D.
Artificial UV light technology has also recently been shown to increase the vitamin D3 content of exposed milk during processing to enhance shelf-life, a process approved by EFSA( 61 ). Furthermore, UVB light exposure of animals has been shown to improve the vitamin D activity of animal-based foods such as eggs( Reference Kühn, Schutkowski and Hirche 62 ) and pork( Reference Burild, Frandsen and Poulsen 63 ).
Conclusion
While current DRI/DRV for vitamin D are essential public health policy instruments in terms of promoting adequate vitamin D status in the population and prevention of vitamin D deficiency, the present review highlights how even the most recent DRV in European differ widely. Notwithstanding this, there is little doubt, irrespective of which set of vitamin D recommendations you choose, that current European population intakes of vitamin D fall well short of these targets. Increasing vitamin D intakes across the population distribution is important from a public health perspective to reduce the high degree of inadequacy of vitamin D intake in Europe and elsewhere, which contribute to prevalence of vitamin D deficiency. Fortification, including biofortification, of a wider range of foods, which accommodate diversity, is likely to have the potential to increase vitamin D intakes across the population distribution and in so doing minimise the prevalence of vitamin D deficiency. Vitamin D-biofortified eggs are a good example of one of these novel food-based solutions, which together with other vitamin D-containing foods, can play a role in tackling low vitamin D intakes. The development of vitamin D-biofortified eggs is underpinned by a number of hen feeding trials, which have examined different vitamin D compounds and doses, and the testing of the resulting egg is not only in terms of vitamin D content, but also egg quality characteristics and consumer acceptability, but also of key importance, evidence of efficacy in a RCT setting. This exemplifies the role research has had, and continues to have, in terms of developing food-based solutions and tackling vitamin D deficiency.
Acknowledgements
Aoife Haye's Ph.D. programme upon which the present review focused has received funding from the Department of Health, England; the Irish Department of Agriculture, Food and Marine under its Food Institutional Research Measures; and the European Union's Seventh Framework Programme (FP7/2007-2013) under grant agreement no. 613977 (ODIN).
Financial Support
None.
Conflicts of Interest
None.
Authorship
A. H. and K. D. C. contributed equally to this work.


