


The causes of age related loss of muscle mass and strength (sarcopenia) are incompletely understood. Conservation of muscle also has important metabolic consequences. The fat composition of the diet could influence muscle mass through its effects on inflammation which is known to increase loss of muscle mass, or through other mechanisms, since fatty acids are the major source of energy for resting and working muscle(Reference Keins1, Reference Schaap, Pluijm and Deeg2). Saturated and trans fatty acids are suggested to be pro-inflammatory, whereas PUFA is anti-inflammatory. The purpose of this study was to investigate the fat composition of the diet and indexes of muscle mass in a cohort of healthy women.
We investigated indexes of muscle mass in 2689 female twins aged 18–79 years(Reference Cassidy, Skidmore and Rimm3). Ethical approval was obtained from the St. Thomas's Hospital Research Ethics committee and informed consent obtained from all subjects. Body composition was measured using dual-energy X-ray absorptiometry (Hologic QDR, Ltd, Crawley, West Sussex, UK) with participants in a supine position on the tabletop with their feet in a neutral position and hands flat by their sides. Total fat mass and fat-free mass (FFM) were determined using standard software calculations. Fat-free mass index (FFMI) was calculated as: FFM kg/height(Reference Schaap, Pluijm and Deeg2). Fat and fatty acid composition of the diet were calculated using a validated FFQ(Reference Cassidy, Skidmore and Rimm3). FFM and FFMI were calculated by quartile of fatty-acid intake and adjusted for age, physical activity, smoking habit, total body fat and total fat intake using robust regression with the cluster option in Stata version 10 (StataCorp, College Station, TX, USA) with results shown in this table.
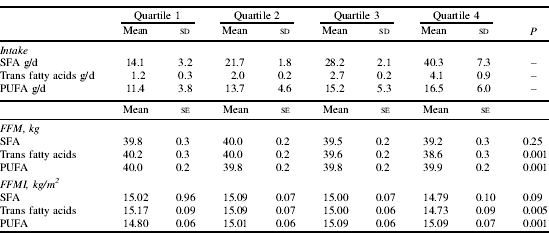
* P for trend calculated using ANCOVA. Data are mean intakes of fatty acids per quartile, or mean FFM or FFMI per quartile of fatty acids, after adjustment for covariates.
Mean fat intake was 69.6 g/d (sd 24.4), mean FFM was 39.6 kg (sd 5.3) and mean FFMI was 15.0 kg/m2 (sd 1.7). There was a significant difference of 1.6 kg FFM (P<0.001) and of 0.44 kg/m2 (P<0.005) for FFMI between quartile 1 and quartile 4 of trans fatty acids, and a trend to a significantly lower FFMI with saturated fat (P=0.09). FFMI was 0.29 kg/m2 greater in quartile 4 of PUFA than quartile 1 (P<0.001).
The results of this study suggest an association between indexes of FFM and fat composition of the diet, after accounting for the known influences on FFM, which deserves further investigation.

