


Introduction
Current National Health Service (NHS) policy promotes the potential benefits of early identification of dementia and the appropriate treatment and support to those who experience this condition (Department of Health, 2009). However, in 2012, NHS England estimated that only 47% of people with dementia had been diagnosed (Department of Health, 2012a). NHS England has been aiming to improve the diagnosis rates for dementia, following the Prime Minister’s Challenge to achieve two thirds of people with dementia being diagnosed by April 2015 (Department of Health, 2012b). ‘Diagnosis rate’ has been used as a term by the UK Government to describe the proportion of people predicted to have dementia in the population, who actually have a recorded diagnosis on electronic medical records in primary care.
Diagnosing dementia in primary care is not straightforward and requires the recognition of a syndrome which is challenging (Wilcock et al., Reference Wilcock, Jain, Griffin, Thune-Boyle, Lefford, Rapp and Iliffe2015). Large variation in the diagnosis rates has been reported, with some known factors associated with dementia diagnosis. Estimates of diagnosis rates indicated they ranged from 39 to 75% across areas of England in 2012 (Department of Health, 2013). One previous study (Connolly et al., Reference Connolly, Gaehl, Martin, Morris and Purandare2011) explored dementia diagnosis rates in Greater Manchester, England. The study found that singlehanded practices and practices in more affluent areas had significantly lower rates of dementia diagnosis.
Variation in diagnosis rates has been more extensively explored for other diseases, such as coronary heart disease, cancer and hepatitis. Several characteristics of general practices have been found to be associated with variations in diagnosis including deprivation of the practice population (Saxena et al., Reference Saxena, Car, Eldred, Soljak and Majeed2007; Bottle et al., Reference Bottle, Tsang, Parsons, Majeed, Soljak and Aylin2012), singlehanded practices (Coupland et al., Reference Coupland, Hippisley-Cox, Smith, Irving, Pringle, Ryder, Neal, Cater, Thomson, Pugh, Bicknell and Bullock2006), practice size (Saxena et al., Reference Saxena, Car, Eldred, Soljak and Majeed2007), size of caseload (Saxena et al., Reference Saxena, Car, Eldred, Soljak and Majeed2007), patient access (Bottle et al., Reference Bottle, Tsang, Parsons, Majeed, Soljak and Aylin2012), doctor characteristics (Coupland et al., Reference Coupland, Hippisley-Cox, Smith, Irving, Pringle, Ryder, Neal, Cater, Thomson, Pugh, Bicknell and Bullock2006; Bottle et al., Reference Bottle, Tsang, Parsons, Majeed, Soljak and Aylin2012), Quality and Outcomes Framework (QOF) performance (Bottle et al., Reference Bottle, Tsang, Parsons, Majeed, Soljak and Aylin2012) and financial factors related to GP contracts (Morgan and Beerstecher, Reference Morgan and Beerstecher2006). However, similar associations with dementia diagnosis have not previously been explored in the same way, other than the Greater Manchester study. We chose variables within our study based on these findings from studies in other diseases.
Using publically available data from across England we explored the association between dementia diagnosis rates of GP practices with a range of patient and practice characteristics to identify possible targets for intervention.
Methods
Study design and sample
We used a cross-sectional, ecological study design that sourced publicly available data from various sources for the year 2011 across all GP practices in England. Our outcome was the reported number of patients with a recorded dementia diagnosis per practice as a proportion of expected diagnosis to reflect the UK Government definition of ‘diagnosis rate’. Reported dementia diagnosis was taken from primary care disease registers of the QOF. Expected dementia diagnosis was calculated using the prevalence calculator commissioned and used by NHS England (NHS England, 2013). The dementia prevalence estimates used in the calculator model are taken from an expert panel commissioned by the Alzheimer’s Society, United Kingdom (Knapp et al., Reference Knapp, Prince, Albanese, Banerjee, Dhanasiri, Fernandez, Ferri, Snell and Stewart2007). The model has been constructed using estimates of the prevalence of dementia associated with the age and gender profiles of the GP populations and the proportion of people in residential care homes.
We chose the independent variables to explore their association with dementia diagnosis rates that had been previously identified in the diagnosis of other diseases in England. The type of primary care contract was taken from the Health and Social Care Information Centre (HSCIC) (General Medical Services contract (GMS) is a standard national contract, Personal Medical Services contract (PMS) and Alternative Provider Medical Services contract (APMS) contracts are individually negotiated by practices and local funders and Primary Care Trust Medical Services contract (PCTMS) is a standard localised contract). Practice list size, overall QOF score and GP experience data were also taken from HSCIC. Index of Multiple Deprivation (IMD) scores for each practice were sourced from Public Health England data. The IMD estimates an average deprivation score proportionally across a practice population. Patient-reported access measures were taken from the National General Practice Patient Survey, which is weighted to reflect the demographics of the practice population. Further details of each variable and data source are provided in Table 1.
Table 1 Data sources of patient and practice variables

NHS=National Health Service; GMS=General Medical Services contract; PMS=Personal Medical Services contract; APMS=Alternative Provider Medical Services contract; PCTMS=Primary Care Trust Medical Services contract.
Statistical analysis
As our outcome measure, dementia diagnosis rates, was positively skewed we used median (quantile) regression models to explore associations between diagnosis rates and selected variables (Kroenker and Hallock, Reference Kroenker and Hallock2001; Katz, Reference Katz2011). We performed univariate analysis and included any variables with statistically significant associations (P<0.05) into a multivariable model.
We tested for correlation between factors within the multivariable model and linearity in continuous variables. None of the correlations exceeded our threshold of >0.7 and P<0.05 and so no interaction terms were included in the multivariable model. We found that only ‘QOF performance’ did not have a linear relationship with diagnosis rate and so this variable was included in the model as quintiles. All data were collated and analysed using STATA version 12.
Results
Full data were available for 7711 general practices representing 92.7% of the practices in England in 2011 (n=8316). Practices excluded due to incomplete data were more likely to be smaller practices than those included for analysis (mean patient list size 2595 versus 6685). There was some geographical variation in excluded practices, for instance over 10% of London practices were excluded compared with 4% of practices in the South West region of England.
We found wide variation in reported dementia diagnosis rates across the 7711 practices included in this study. The median dementia diagnosis rate was 41.6% of expected rate, and interquartile range was 31.2–53.9%.
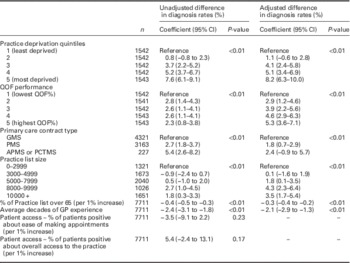
All variables except patient-reported access measures were found to be significantly associated with diagnosis rate in univariate analysis (Table 2) and so were included in the multivariable median regression model.
Table 2 Univariate and multivariable regression analysis of primary care practice characteristics and difference in dementia diagnosis rates
QOF=Quality and Outcomes Framework; GMS=General Medical Services contract; PMS=Personal Medical Services contract; APMS - Alternative Provider Medical Services contract; PCTMS=Primary Care Trust Medical Services contract.
Patient factors associated with dementia diagnosis rates included age and deprivation. Each percentage point increase in the proportion of the practice population over 65 years of age was associated with a 0.3% reduction in dementia diagnosis rate [−0.3%; 95% confidence interval (95% CI) −0.4 to −0.2], on adjustment for other factors. Therefore where the proportion of practices list over 65 differ by 10%, a difference of 3% would be expected in diagnosis rates. Diagnosis rates of dementia were 8% higher in the most deprived quintile of practices, compared to the least deprived (8.2%; 95% CI 6.3–10.0).
Practice factors associated with dementia diagnosis rates included practice size, average GP experience, contract type and QOF score attainment. Compared with the average diagnosis rate in the smallest practices (list size 0–2999 patients), the average diagnosis rate of practices between 8000 and 9999 list size was 4.3% higher (95% CI 2.3–6.4) and the average diagnosis rate of practices over 10 000 list size was 3.5% higher (95% CI 1.7–5.4).
Average GP experience per practice was negatively associated with diagnosis rates. When the average experience increases by a decade, the diagnosis rate in practices decreases by 2.1% (95% CI −2.9 to −1.3).
Compared with diagnosis rates of practices with GMS contracts, practices with PMS contracts had a diagnosis rate that was 1.8% higher (95% CI 0.7–2.9). Practices with other types of contract (PCTMS and APMS) had a diagnosis rate that was 2.4% higher (95% CI −0.9 to 5.7), although there were relatively small numbers of practices in these categories, and this association was not statistically significant in the multivariable model.
Diagnosis rate was higher with increasing QOF performance. The highest quintile of practices by QOF performance had a diagnosis rate that was 5.3% higher (95% CI 3.6–7.1) than the lowest quintile.
As we were concerned about the potential impact of outliers, we tested the effect of outliers on our results. We excluded practices beyond three standard deviations (n=82) and beyond two standard deviations (n=174) and neither the coefficients nor overall factors associated with diagnosis rate were substantially altered.
Discussion
We found patient demographics; age and deprivation, and GP characteristics; experience, list size and QOF performance are associated with variation in dementia diagnosis.
Our results show that practices in more deprived areas have a higher diagnosis rate, confirming findings of a previous study (Connolly et al., Reference Connolly, Gaehl, Martin, Morris and Purandare2011). This consistent finding suggests an amendment to the NHS England prevalence model calculator may be appropriate. Dementia prevalence and deprivation is a complex relationship. Several studies have found an association between dementia prevalence and higher levels of deprivation (Wilson et al., Reference Wilson, Chen, Taylor, Mccracken and Copeland1999; Versporten et al., Reference Versporten, Bossuyt, Meulenbergs, Baro and Van Oyen2005; Basta et al., Reference Basta, Matthews, Chatfield, Brayne and Mrc2008; De Deyn et al., Reference De Deyn, Goeman, Vervaet, Dourcy-Belle-Rose, Van Dam and Geerts2011). This may be explained by higher cardiovascular risk factors (Banerjee, Reference Banerjee2013) and the cognitive reserve hypothesis (Brayne et al., Reference Brayne, Ince, Keage, Mckeith, Matthews, Polvikoski and Sulkava2010; Meng and D’Arcy, Reference Meng and D’Arcy2012; Matthews et al., Reference Matthews, Arthur, Barnes, Bond, Jagger, Robinson and Brayne2013) where the protective influence of active cognitive function delays the clinical presentation of dementia. Conversely less deprived populations are more likely to live into old age and therefore be at a higher risk of developing dementia, increasing the prevalence. Further exploration of this complex relationship between deprivation and dementia diagnosis rates may assist in improving the prevalence model and in identifying population-based interventions.
Fewer patients with dementia are being diagnosed in smaller practices and in practices with larger proportions of elderly patients. These results suggest that practices with a larger proportion of older patients may not be successfully identifying cases of dementia in amongst the natural deterioration in cognitive functioning of old age. In addition, it may not confer clinical benefit to record dementia diagnosis for patients already in care homes which may explain this association. These factors do, however, provide an opportunity to target resources in these practices to optimise case finding.
A cohort effect could explain practices with older and more experienced GPs less likely to record dementia in electronic medical records. Larger list size may increase documentation of dementia due to increased clinical specialisation in larger practices. The association found with PMS contract type may indicate innovative and proactive approaches exist within these GP practices relating to both contractual and clinical processes that enhance dementia recording. The lack of association with patient access variables is consistent with findings from a study of educational interventions that found patients and their carers had minimal contact with their GP practice (Downs et al., Reference Downs, Turner, Bryans, Wilcock, Keady, Levin, O’Carroll, Howie and Iliffe2006).
This study has a number of limitations. First, despite the statistical significance of the associations identified in this study causal relationships cannot be established within this cross-sectional design. Second, we have relied heavily on the dementia prevalence model developed by NHS England to explore dementia diagnosis rates. There are a number of assumptions built into this model that may reduce its accuracy in predicting dementia in the population. The associations we identify could relate more to the prevalence model than to the diagnosing of dementia in GP practices which may well over-estimate prevalence (Matthews et al., Reference Matthews, Arthur, Barnes, Bond, Jagger, Robinson and Brayne2013). Third, although we included data from the majority of GP practices in England (92.8%) some systematic differences between the practices included and excluded do exist, such as list size and geographical variations. The potential for these and other unknown structural factors to have an impact on our results cannot be ruled out. Fourth, data coding in clinical systems for dementia is variable and in some cases quite poor (Russell et al., Reference Russell, Banerjee, Watt, Adleman, Agoe, Burnie, Carefull, Chandan, Constable, Daniels, Davies, Deshmukh, Huddart, Jabin, Jarrett, King, Koch, Kumar, Lees, Mir, Naidoo, Nyame, Sasae, Sharma, Thormod, Vedavanam, Wilton and Flaherty2013). Our study analyses the number of patients who have a recorded diagnosis of dementia on GP electronic patient records. We cannot demonstrate how reliable this coding is. There may be structural differences in coding practice that could affect these results and the way in which dementia diagnosis was recorded.
Rurality of the practice population may also influence access to the practice. However data on the rurality of GP practices are based on the location of the practice rather than the patients registered with that practice and were therefore not included.
Practice size, age profile, deprivation, QOF performance and GP contract type are all associated with dementia diagnosis. This wide variation we found in dementia diagnosis rates in English GP practices is reflected internationally. Debate about the variation in the detection of dementia in primary care across Europe (De Lepeleire et al., Reference De Lepeleire, Wind, Iliffe, Moniz-Cook, Wilcock, Gonzalez, Derksen, Gianelli and Vernooij-Dassen2008) has highlighted the need to better understand the factors associated with this variation in order to incorporate them into systematic case-finding strategies. This study adds to our understanding of this complex process in England. The identification of specific patient factors associated with variations in dementia diagnosis provide potential population level targets for local government and public health organisations (eg, Public Health England) to identify patient groups at risk of dementia. Specific practice factors could be used by commissioners (eg, Clinical Commissioning Groups) to engage with practices where the case finding is lower than expected.
Since 2011, there have been a variety of national targets and incentives to improve dementia diagnosis rates in the United Kingdom. However, these have been widespread schemes, and do not appear to have considered some of the identified factors associated with dementia diagnosis in this study. Our analysis may provide a benchmark level of diagnosis rate by which the recent schemes can be measured both in the United Kingdom and internationally.
Acknowledgements
No funding was received for this research. No conflicts of interest to declare. The authors are grateful to NHS England for giving permission to use data from their Dementia Prevalence Calculator for this study.


