I. INTRODUCTION
One of the most investigated metal organic framework (MOF) materials is the highly porous [Cu3(C9H3O6)2] n , or Cu-paddle-wheel-based Cu3(BTC)2 (BTC ≡ 1,3,5-benzenecarboxylate, abbreviated as Cu-BTC) (Chui et al., Reference Chui, Lo, Charmant, Orpen and Williams1999; Wang et al., Reference Wang, Shen, Bülow, Lau, Deng, Fitch, Lemcoff and Semanscin2002; Skoulidas, Reference Skoulidas2004; Lee et al., Reference Lee, Li and Jagiello2005; Wei and Han, Reference Wei and Han2005; Krungleviciute, Reference Krungleviciute, Lask, Heroux, Migone, Lee, Li and Skoulidas2007; Wu et al., Reference Wu, Simmons, Srinivas, Zhou and Yildirim2010). This material, which is also known as HKUST-1 (Chui et al., Reference Chui, Lo, Charmant, Orpen and Williams1999), has framework integrity, a high specific surface area and a chemically tunable structure. The robust microporous structure is reminiscent of the topology of zeolite LTA frameworks. According to Chui et al. (Reference Chui, Lo, Charmant, Orpen and Williams1999), two octahedrally coordinated Cu atoms in [Cu3(BTC)2(H2O) x ] n are connected to eight oxygen atoms of tetra-carboxylate units to form a dimeric Cu-paddle wheel. This material has a three-dimensional (3D) channel structure connecting a system of cages [largest with a diameter of approximately 10 Ǻ (Skoulidas, Reference Skoulidas2004; Lee et al., Reference Lee, Li and Jagiello2005; Krunglevicute, Reference Krungleviciute, Lask, Heroux, Migone, Lee, Li and Skoulidas2007)], accessible through small square-shaped windows (about 3.5 Ǻ in dimension).
The sorption properties of Cu-BTC for both CO2 and water have been reported by Wang et al. (Reference Wang, Shen, Bülow, Lau, Deng, Fitch, Lemcoff and Semanscin2002). The pores themselves can contain up to ten additional water molecules per formula unit. The thermal stability of Cu-BTC crystals was also reported by Wang et al. (Reference Wang, Shen, Bülow, Lau, Deng, Fitch, Lemcoff and Semanscin2002). It was found that a fully hydrated molecular sieve contains up to 40% mass water, and it is stable up to a temperature of about 573 K.
Force field calculations have been performed by Tafipolsky et al. (Reference Tafipolsky, Amirjalayer and Schmid2010). In addition to predicting the structure, lattice-dynamic-dependent properties such as the bulk modulus and the observed negative thermal expansion effect of Cu-BTC are also quantitatively predicted. During the gas adsorption process, the gas uptake is attributed to the overlapping attractive potentials from multiple copper paddle-wheel units: each Cu(II) center can potentially lose a terminal solvent ligand bound in the axial position, providing an open coordination site for gas binding.
At present, despite extensive studies of the Cu-BTC phase, detailed information on pore-size distribution (PSD) and microstructure characteristics is still incomplete. The goal for this paper is threefold: (1) to determine the PSD for both dehydrated (d-Cu-BTC) and hydrated (h-Cu-BTC) samples using the Gelb and Gubbins technique; (2) to estimate the difference in microstructure of both d-Cu-BTC and h-Cu-BTC compounds using the small-angle X-ray scattering and ultra-small-angle X-ray scattering technique (SAXS/USAXS), and small-angle neutron scattering (SANS) technique; and (3) to determine their experimental reference X-ray powder patterns, and to make them widely available as a useful reference for non-destructive phase identification and characterization through submission to the Powder Diffraction File (PDF, 2014). Reference patterns that have been prepared in our laboratories for other porous materials included MOF74 [M 2(2,5-dihydroxyterephthalte), M = (Mn, Co, Ni, Zn); Wong-Ng et al., Reference Wong-Ng, Kaduk, Wu and Suchomel2012], ZIF8 [Bis(2-methylimidazolyl)-Zinc,C8H10N4Zn; Wong-Ng et al., Reference Wong-Ng, Kaduk, Espinal, Suchomel, Allen and Wu2011], OMS2 (K0.1MnO2·0.08H2O; Espinal et al., Reference Espinal, Wong-Ng, Kaduk, Allen, Snyder, Chiu, Siderius, Li, Cockayne, Espinal and Suib2012), and NaY zeolite (Na56Al56Si138O384; Wong-Ng et al., Reference Wong-Ng, Kaduk, Huang, Espinal, Li and Burress2013).
II. EXPERIMENTAL AND COMPUTATION APPROACH
A. Reference powder X-ray diffraction (XRD) patterns
1. Sample preparation
The dark blue Cu-BTC [Cu3(C9H3O6)2] sample was obtained from Sigma-Aldrich Chemical Corporation under the commercial name of Basolite C300 (Lot STBC4614 V). This material, when left in air changes color from dark blue (turquoise) to light blue because of the hydration process. The dehydrated phase can be regenerated by heat treatment.
Two samples were prepared for the powder pattern determination. d-Cu-BTC was obtained by heat treating the as-received sample at 150 °C under vacuum for overnight (activation). h-Cu-BTC was prepared by exposing the as-received sample in air for 4 h. Sample mounting of d-Cu-BTC was performed inside a dry box with flowing Ar. The sample for synchrotron study (h-Cu-BTC) was loaded into a 0.7-mm-wide polyamide capillary tubing; both ends were sealed with epoxy.
The mass percent change of the sample while degassing was monitored using a high-pressure thermal gravimetric analyzer (Model: TGA-HP50) from TA Instruments. An amount of 51 mg of sample was used for the experiment. The sample was heated from room temperature to 150 °C under vacuum and then held at 150 °C under vacuum for approximately 4 h. As shown in Figure 1, the mass percent change was stable after 2 h of degasing.

Figure 1. (Color online) Thermal gravimetric analysis (TGA) of the Cu-BTC sample while degassing. TGA profile of as-received Cu-BTC sample while heating up to 150 °C for 4 h under vacuum. Color codes: mass percent change (red line), temperature (dotted red line), and pressure (blue line).
2. Powder XRD (laboratory and synchrotron)
a. Conventional laboratory X-ray
The d-Cu-BTC powders were mounted in atmosphere-controlled zero-background cells. The X-ray powder pattern was measured on a Bruker D2 Phaser diffractometer (Certain trade names and company products are mentioned in the text or identified in illustrations in order to specify adequately the experimental procedure and equipment used. In no case does such identification imply recommendation or endorsement by National Institute of Standards and Technology, nor does it imply that the products are necessarily the best available for the purpose) (30 kV, 10 mA, 5°–130° 2θ in 0.024° steps, 1 s step−1) equipped with a LynxEye position-sensitive detector.
b. High-resolution synchrotron diffraction
High-resolution synchrotron X-ray powder diffraction data were collected using beamline 11-BM at the Advanced Photon Source (APS), Argonne National Laboratory using a wavelength of 0.412 21 Å. Discrete detectors covered a final angular range from 0° to 45°, with data points collected every 0.001° in 2θ at a scan speed of 0.01° s−1. The instrumental optics of 11-BM incorporate two platinum-striped mirrors and a double-crystal Si (111) monochromator, where the second crystal has an adjustable sagittal bend (Wang et al., Reference Wang, Toby, Lee, Ribaud, Antao, Kurtz, Ramanathan, Von Dreele and Beno2008). The diffractometer is controlled via EPICS (Dalesio et al., Reference Dalesio, Hill, Kraimer, Lewis, Murray, Hunt, Watson, Clausen and Dalesio1994). A vertical Huber 480 goniometer positions 12 perfect Si (111) analyzers and 12 Oxford-Danfysik LaCl3 scintillators, with a spacing of 2° in 2θ (Lee et al., Reference Lee, Shu, Ramanathan, Preissner, Wang, Beno, Von Dreele, Lynn, Kurtz, Antao, Jiao and Toby2008). Capillary samples are mounted by a robotic arm and spun at ≈ 90 Hz. Data are normalized to incident flux and collected while continually scanning the diffractometer 2θ arm. A mixture of NIST standard reference materials, Si (SRM™ 640c) and Al2O3 (SRM™ 676) is used to calibrate the instrument, where the Si lattice constant determines the wavelength for each detector. Corrections are applied for detector sensitivity, 2θ offset, and small detector wavelength differences, before merging the data into a single set of intensities evenly spaced in 2θ.
c. Rietveld refinements and powder reference patterns
The Rietveld refinement technique (Rietveld, Reference Rietveld1969) with the software suite GSAS (Larson and von Dreele, Reference Larson and von Dreele2004) was used. A structural model of Cu3(C9H3O6)2(H2O)3 based on single-crystal results (Chui et al., Reference Chui, Lo, Charmant, Orpen and Williams1999) was used for the refinements. The organic ligands were modeled as rigid bodies. Only the three orientation angles and the center of the molecule (x, y, z) are refined. The peak profiles were described using the anisotropic strain tensor model of GSAS profile function #4 (GSAS). Preferred orientation was modeled using fourth-order spherical harmonics. The background was modeled using a three-term shifted Chebyshev function, and 9–14-term diffuse scattering functions were included.
The central C6H3 core of the organic ligand was modeled as a rigid body of 1/3-occupancy atoms. The Euler rotation angles are fixed by symmetry, and were not refined. The center of the molecule is constrained to lie on a threefold axis, so only one translational parameter was refined. The C1–C3 bond was subjected to a restraint of 1.47(1) Å, the C3–O1 bond was 1.26(2) Å, the Cu–O1 bond was 1.94(2) Å, and the O1–O1 non-bonded distance was 2.24(3) Å. The O1–C3–C1 angle was subject to a restraint of 117.5(3)°.
Reference patterns were obtained with a Rietveld pattern decomposition technique. In this technique, the reported peak positions were derived from the extracted integrated intensities, and positions calculated from the lattice parameters. When peaks are not resolved at the resolution function, the intensities are summed, and an intensity-weighted d-spacing is reported. They are corrected for systematic errors both in d-spacing and intensity. In other words, these patterns represent ideal specimen patterns.
B. Microstructural studies
1. Sample preparation
Powder samples were prepared in a dry box and sealed in plastic tape. The d-Cu-BTC samples were maintained in a dry environment and retained a dark blue color, whereas h-Cu-BTC were stored in air prior to measurement and were light blue in color. The d-Cu-BTC solid material was estimated to have a skeletal (X-ray) mass density of 0.89 g cm−3 (using formula Cu3C18H6O12). This gives scattering length or atomic form-factor densities of 7.416 × 10¹⁴ m−2 for X-rays and 1.683 × 10¹⁴ m−2 for neutrons. The corresponding scattering contrast factors for the solid/void interface are 54.99 × 1028 m−4 for X-rays and 2.832 × 1028 m−4 for neutrons, and the predicted SAXS/SANS intensity ratio, based on measurements of the same sample, is therefore 19.42. The h-Cu-BTC solid material was established to have a skeletal (X-ray) mass density of 1.07 g cm−3 [using formula Cu3C18H6O12 .6.96(H2O) from our X-ray study]. This gives X-ray and neutron-scattering length (atomic form-factor) densities of 9.115 × 10¹⁴ and 1.573 × 10¹⁴ m−2, respectively. The corresponding scattering contrast factors, based on the solid/void interface, are then 83.09 × 1028 m−4 (X-rays) and 2.474 × 1028 m−4 (neutrons), giving a predicted SAXS/SANS intensity ratio of 33.58 for SAXS and SANS measurements of the same sample.
2. USAXS measurements
USAXS measurements were made at ChemMatCARS sector 15-ID at the APS. The APS USAXS instrument, including some of its more recent additions such as a 2D pinhole geometry SAXS capability, are described elsewhere (Ilavsky et al., Reference Ilavsky, Jemian, Allen, Zhang, Levine and Long2009, Reference Ilavsky, Zhang, Allen, Levine, Jemian and Long2013). Using Si (220) optics, the X-ray energies used were 12 keV (λ = 1.033 Å) and 17 keV (λ = 0.729 Å) for the main USAXS Q range (Q = 0.0001 to ≈ 0.1 Å−1), but the Q range was extended down to 0.000 03 Å−1 using Si(440) optics and X-ray energies of 21 keV (λ = 0.590 Å) and 24 keV (λ = 0.517 Å). Incident X-ray beam sizes as small as 0.5 × 0.5 mm and as large as 0.8 mm vertical × 2.0 mm horizontal were used. Although powder samples were used, data were normalized to the data from runs measured with mean thicknesses, τ s, given by τ s = 0.115 mm for d-Cu-BTC, and τ s = 0.068 mm for h-Cu-BTC. USAXS data, which are intrinsically slit-smeared, were corrected for parasitic background scattering, and were absolute-calibrated using a primary method. The slit-smeared, absolute-calibrated USAXS data were merged with, and at high Q replaced by, 2D pinhole-geometry SAXS data obtained at the same time. The 2D data were slit-smeared to match the USAXS data before being normalized to and merged with the latter. The combined data were then desmeared to produce datasets of dΣ/dΩ vs. Q over a combined Q range of 0.000 03 to ≈1 Å−1, or as high as 1.2 Å−1. Data reduction and analysis were carried out using the Irena macro package written in Igor Pro (Jemian and Ilavsky, Reference Ilavsky and Jemian2009).
3. SAXS measurements
The principal purpose of the SAXS measurements was to provide a better signal-to-noise ratio at high Q, effectively extending the maximum Q of the combined the USAXS/SAXS data. In addition to providing better SAXS data at high Q, the 2D SAXS measurements also captured several low-angle XRD peaks at higher Q values. The incident X-ray beam size for SAXS was smaller than for USAXS, and was typically 0.15 mm × 0.15 mm. The X-ray energy used was the same as used for the associated USAXS scans.
Conventional pinhole geometry 2D SAXS data were obtained at the APS USAXS facility at ChemMatCARS, APS sector 15-ID, using a separately mounted Dectris 100 K Pilatus 2D position-sensitive detector. SAXS measurements were carried out either immediately before or immediately after the corresponding USAXS scans, and typical exposure times were 30 s. The Q values for the 2D SAXS data were calibrated using silver behenate. The 2D SAXS data were corrected for parasitic (empty beam) scattering and circularly averaged about the incident beam position on the 2D detector, using the Nika macro package written in Igor Pro (Ilavsky, Reference Ilavsky2012). The data were also slit-smeared to match the slit-smeared USAXS data, then normalized and merged with the absolute-calibrated USAXS data, and finally the combined ID data were desmeared using the well-established algorithm by Lake (Reference Lake1967).
4. SANS measurements
SANS measurements were carried out using the NIST NG3SANS 30 m instrument at the NIST Center for Neutron Research (NCNR). This instrument is described elsewhere (Glinka et al., Reference Glinka, Barker, Hammouda, Krueger, Moyer and Orts1998). The wavelength, λ, used was 5.0 Å with the instrument's rotating helical neutron velocity selector providing a Δλ/λ wavelength resolution of ≈13%. Several sample-to-detector configurations were used with matched instrument neutron guide collimations to produce an overall Q range from 0.004 to ≈0.2 Å−1. The main USAXS d-Cu-BTC and h-Cu-BTC samples were measured with the same sample thicknesses as given above for USAXS. Using the NCNR SANS reduction and analysis macro suite (Kline, Reference Kline2006), the SANS data were corrected for electronic and parasitic scattering background, and the absolute scattering intensity was calibrated using standard beam attenuators. The data were circularly averaged about the beam center on the instrument's 2D position sensitive detector, and data for different instrument configuration inter-normalized and merged to produce neutron-based dΣ/dΩ vs. Q over the full range specified. Apart from the applicability of neutron-scattering contrast factors in place of X-ray contrast factors, the other principal difference for the SANS measurements, as compared with the USAXS, SAXS studies, was the use of a much larger 6.35 mm diameter circular incident beam.
C. Pore-size distribution
Computational methods were used to estimate the PSD, the skeletal porosity, and the gas-accessible pore volume and surface area of Cu-BTC. The chosen technique of computing the PSD was the method of Gelb and Gubbins (Reference Gelb and Gubbins1999) in which the local pore size at any given location in the material is equal to the diameter of the largest sphere containing that point without overlapping the material framework. The value of the PSD at a particular pore diameter is then the fraction of the free volume with local pore size equal to that diameter. For both the d-Cu-BTC and h-Cu-BTC structures, we first reconstructed the Cu-BTC material framework from the XRD crystal structure data, identified the coordinates of each atom in the framework, and then drew a van der Waals exclusion sphere around each atom. van der Waals radii were 1.40 Å for Cu, 1.20 Å for H, 1.70 Å for C, and 1.52 Å for O (Bondi, Reference Bondi1964; Rowland and Taylor, Reference Rowland and Taylor1996). The PSD of the dehydrated structure was then numerically calculated via the voxel technique described by Palmer et al. (Reference Palmer, Moore, Brennan and Gubbins2011) using cubic voxels with side length 0.2 Å or smaller. For the hydrated structure, which requires the inclusion of hydrate water molecules, a slightly different technique was necessary. First, oxygen atoms were randomly placed at the lattice positions of water oxygen sites (OW1, OW2, and OW3) given in Tables I(a) and I(b) (determined from Rietveld refinements using synchrotron diffraction technique, as discussed below). The fractional occupancies shown in Table I required the inclusion of 111 (rounded from 111.36) oxygen atoms that belong to water molecules. Second, hydrogen atoms were placed around each of the water oxygen (using bond length of 0.9584 Å and bond angle of 104.45°), where the orientation of the hydrogen atoms was selected randomly. The PSD of this particular realization of the h-Cu-BTC structure was then computed using the same voxel technique used for the d-Cu-BTC structure with similarly sized voxels. Finally, the PSD analysis was repeated using 20 separate realizations of the h-Cu-BTC structure and a final average PSD was computed from the ensemble of randomly generated structures. Uncertainty in the PSD was estimated using a jackknife analysis.
Table IA. Atomic coordinates and isotropic displacement factors for Cu3(C9H3O6)2; values inside brackets are standard deviations; a = 26.279 19(3) Å, V = 18 148.31(6) Å3, Z = 16, D x = 0.89 g cm−3; U equ is the equivalent isotropic displacement factor (Fischer and Tillmanns, Reference Fischer and Tillmanns1988).
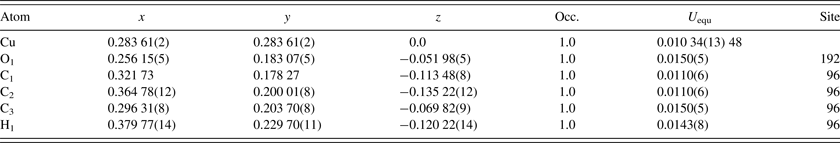
Table IB. Atomic coordinates and isotropic displacement factors for Cu3(C9H3O6)2(H2O)6.96; values inside brackets are standard deviations. Because of the disordered situation and the low X-ray scattering factor for H, hydrogen atoms of the water molecules were not located, a = 26.3103(11) Å, V = 18 213 (2) Å3, Z = 16, D x = 1.07 g cm−3; U equ is the equivalent isotropic displacement factor (Fischer and Tillmanns, Reference Fischer and Tillmanns1988).
The skeletal porosity (the volume fraction of the crystal unit cell not occupied by the van der Waals spheres surrounding each atom) was computed by Monte Carlo integration. The pore volume and surface area were characterized by the so-called accessible volume and accessible surface area metrics, which were computed as described by Frost et al. (Reference Frost, Duren and Snurr2006) and Duren et al. (Reference Duren, Millange, Férey, Walton and Snurr2007) in which the framework atoms were assigned the radii listed above and N2 with assigned diameter of 3.681 Å was used as the probe gas. Use of N2 with this diameter as the computational probe is expected to yield an accessible surface area that correlates well with the BET surface area measured by N2 adsorption (Walton and Snurr, Reference Walton and Snurr2007). Reported uncertainties are 95% confidence intervals based on standard t-tests.
III. RESULTS AND DISCUSSION
A. Structure and XRD reference patterns
Figures 2 and 3 give the results of the Rietveld refinements for the d-Cu-BTC and h-Cu-BTC samples. In Figure 2, tick marks indicate peak positions for these phases. The difference pattern is plotted on the same scale as the other patterns up to 5° in 2θ. For 2θ >5°, the scale has been magnified ten times; for 2θ >14°, the scale has been magnified 50 times. In Figure 3, for 2θ >22°, the scale has been magnified ten times, and for 2θ > 53° the scale has been multiplied by 40. The refinement results from GSAS for d-Cu-BTC is R = 0.1053, w R = 0.123, and goodness of fit GOF = 2.35 (total number of parameters of 25), with a formula of Cu3(C9H3O6)2 or C6H2CuO4, FW = 201.62, and Z = 48. For h-Cu-BTC, R = 0.0683, wRp = 0.0963, and GOF = 4.72 (total number of parameters of 31), with a chemical formula of Cu3(C9H3O6)2 • 6.96 H2O, FW = 238.67, and Z = 16.

Figure 2. (Color online) Results of the Rietveld refinement of the d-Cu-BTC phase (using synchrotron radiation). Tick marks indicate peak positions for these phases (bottom tick marks). The difference pattern is plotted on the same scale as the other patterns up to 5° in 2θ. For 2θ >5°, the scale has been magnified ten times; for 2θ >14°, the scale has been magnified 50 times.

Figure 3. (Color online) Results of Rietveld refinement of the h-Cu-BTC phase (using laboratory X-ray). Tick marks indicate peak positions for these phases (bottom tick marks). The difference pattern is plotted on the same scale as the other patterns. For 2θ >22°, the scale has been magnified ten times, and for 2θ> 53° the scale has been multiplied by 40.
Table II gives the lattice parameters of these compounds [all adopt space group Fm $\bar 3$
m (no. 225)]. The lattice parameter of the CO2 adsorbed compound Cu3(C9H3O6)2(CO2)4.41 is included in this table for comparison (Wu et al., Reference Wu, Simmons, Srinivas, Zhou and Yildirim2010). As expected the lattice parameters for the d-Cu-BTC sample [a = 26.279 19(3) Å] are smaller than that of h-Cu-BTC [26.3103(11) Å]. Tables III(a) and III(b) give the representative bond distances. The refined orientation angles and the center of the Cu-BTC molecules using the rigid body model are 134.44°, 35.534°, −60.32°, x = 0.343 05(5), y = 0.156 96(5), z = −0.156 95(5) for d-Cu-BTC, Cu3(C9H3O6)2; and 134.44°, 35.53°, −60.32°, x = 0.3439(3), y = 0.1561(3), z = −0.1561(3) for Cu3(C9H3O6)2(H2O)6.96.
$\bar 3$
m (no. 225)]. The lattice parameter of the CO2 adsorbed compound Cu3(C9H3O6)2(CO2)4.41 is included in this table for comparison (Wu et al., Reference Wu, Simmons, Srinivas, Zhou and Yildirim2010). As expected the lattice parameters for the d-Cu-BTC sample [a = 26.279 19(3) Å] are smaller than that of h-Cu-BTC [26.3103(11) Å]. Tables III(a) and III(b) give the representative bond distances. The refined orientation angles and the center of the Cu-BTC molecules using the rigid body model are 134.44°, 35.534°, −60.32°, x = 0.343 05(5), y = 0.156 96(5), z = −0.156 95(5) for d-Cu-BTC, Cu3(C9H3O6)2; and 134.44°, 35.53°, −60.32°, x = 0.3439(3), y = 0.1561(3), z = −0.1561(3) for Cu3(C9H3O6)2(H2O)6.96.
Table II. Unit-cell parameters for Cu3(C9H3O6)2 and Cu3(C9H3O6)2(H2O)6.96 [space group Fm $\bar 3$
m (no. 225), Z = 16], D
x
refers to calculated density. Values inside brackets are standard deviations.
$\bar 3$
m (no. 225), Z = 16], D
x
refers to calculated density. Values inside brackets are standard deviations.
Table IIIA. Selected bond distances for Cu3(C9H3O6)2; values inside brackets are standard deviation uncertainties. As noted in the text, all of these bonds were subject to distance restraints.
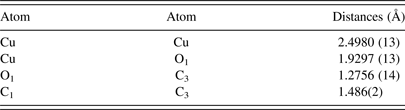
Table IIIB. Selected bond distances for Cu3(C9H3O6)2(H2O)6.96; values inside brackets are standard deviation uncertainties. As noted in the text, all of these bonds were subject to distance restraints.

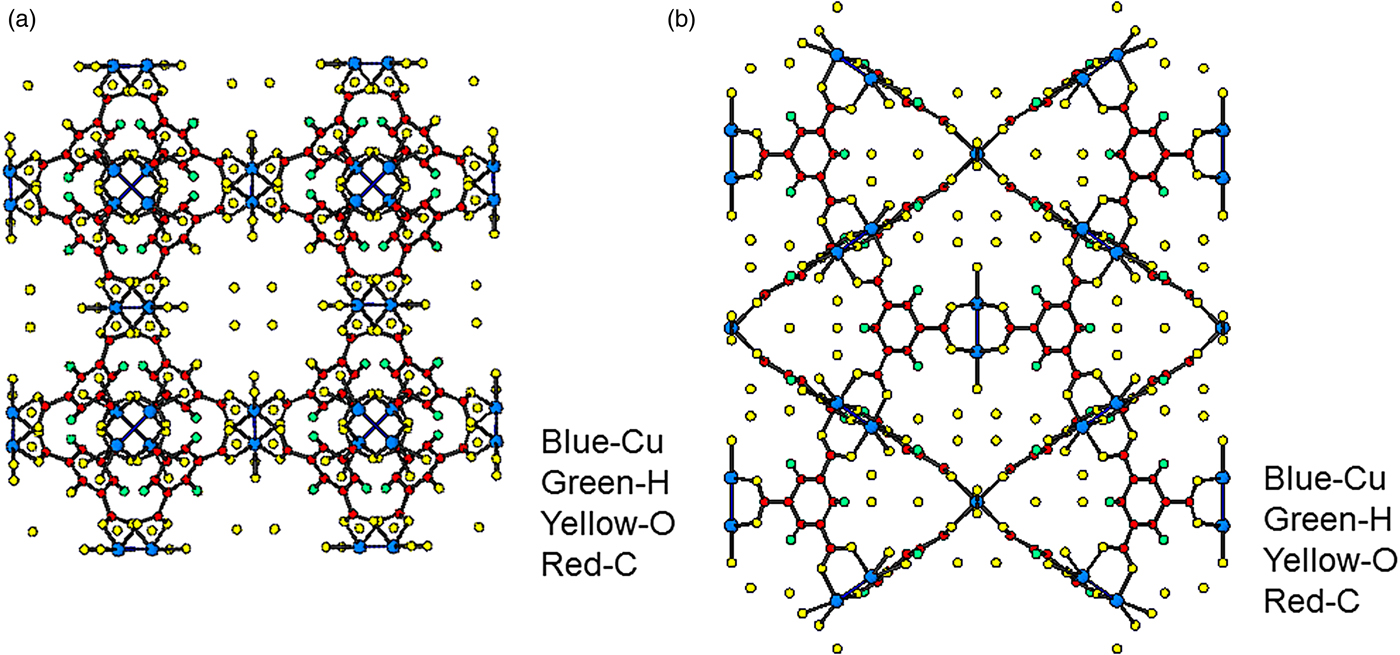
Figures 4(a), 4(b), 5(a), and 5(b) give the structure of the d-Cu-BTC and h-Cu-BTC viewing down the [100] direction and the [110] direction of the cubic cell, respectively. These diagrams reveal the 1 nm size channels with a fourfold symmetry. The nano-channels intersect to give a 3D-connected network of pores. Both Figures 4(b) and 5(b) reveal a honeycomb arrangement. The copper species have free binding sites in the nano-spaces, which facilitate the formation of adducts with electroactive molecules. In the dehydrated case, Cu has a fivefold coordination environment (four oxygen and one Cu) while in the hydrated case, Cu has a sixfold coordination in which the sixth member is a water molecule. The water molecules mainly occupy three specific sites, namely, being coordinated to Cu and becoming a terminal water ligand (OW3), which are directed from the Cu atoms to the interior of the nanopores. There are two possible positions of coordination to each Cu, one on each side of the extension of the Cu–Cu-axis, but only one side is occupied by a water molecule oxygen. Other partially occupied sites for water are near the center of the main pore.

Figure 4. (Color online) Structure of open framework metal-coordination polymer d-Cu-BTC (a) view along the a-axis, (b) view after 45° rotation along the a-axis, reviewing a honey comb-type structure.

Figure 5. (Color online) Structure of hydrated open framework metal-coordination polymer h-Cu-BTC, (a) view along the a-axis, (b) view after 45° rotation along the a-axis, reviewing a honey comb-type structure.
The Cu–O bond distances reported in Tables III(a) and III(b) are typical distances found in Cu–O containing compounds (Nimmermark et al., Reference Nimmermark, Öhrström and Reedijk2013). The bond valence calculations for the Cu sites in both compounds suggested that the valence state for Cu is essentially 2 (2.03 in d-Cu-BTC and 2.10 in h-Cu-BTC, respectively), and no significant strain is associated with these sites. The slightly longer Cu–Cu distance of 2.628 (10) Å in h-Cu-BTC as compared with 2.4980 (13) Å in d-Cu-BTC is possibly because of the additional coordination of Cu to O (water) in h-Cu-BTC, therefore weakening the Cu–Cu bond.
To confirm the stability of the Cu3(C9H3O6)2 structure, we used first-principles total energy minimization approach, based on density functional theory, to determine the ground state of the compound (Kresse and Furthmuller, Reference Kresse and Furthmuller1996). We also added van der Waals interaction in the calculation. Projector-augmented wave pseudopotentials were applied in conjunction with a plane wave expansion of the wavefunctions (Blochl, Reference Blochl1994; Kresse and Joubert, Reference Kresse and ad Joubert1999). The generalized gradient approximation was used to approximate the exchange and correlation functional, using the PBE parameterization (Perdew et al., Reference Perdew, Burke and Ernzerhof1996). Relaxations of atomic positions and lattice vectors were performed until residual forces were converged to 0.01 eV Å−1. In comparison with the structural data shown in Tables I(a) and II, the structure of Cu3(C9H3O6)2, proposed by expeirment, is energetically stable and the binding energy of Cu in the compound was found to be ~7.2 eV Cu−1.
B. Pore-size distribution, pore volume, and surface area
Figures 6(a) and 6(b) display a schematic representation of Cu-BTC (based on the crystal structure data given in Tables III(a) and III(b) for two cases: (a) d-Cu-BTC structure and (b) h-Cu-BTC structure, with the positions and orientations of water molecules assigned randomly. In both cases, van der Waals radii have been drawn about each constituent atom to indicate the approximate space taken up by the framework atoms. The schematic representations display three main pores of differing sizes present in both d-Cu-BTC and h-Cu-BTC. The h-Cu-BTC structure in Figure 6(b) shows water molecules from one particular realization of the hydrated structure. The d-Cu-BTC structure contains three main cages (or pores) of roughly spherical shape, of which the diameters are, in decreasing order, approximately 12.6, 10.6, and 5.0 Å. The largest and smallest cages are connected by an aperture with approximate diameter 3.5 Å, whereas the largest and middle-sized cages are connected by apertures of approximate size 6.6 Å. We note that the small- and middle-sized cages are not directly connected. The free volume (that not occupied by the framework atoms) for the d-Cu-BTC structure is approximately (71.85 ± 0.05) % of the total volume.

Figure 6. (Color online) Molecular structure of Cu-BTC, with van der Waals exclusion volume of all atoms (Bondi, Reference Bondi1964) shown by colored spheres. Atomic positions were obtained via the crystallographic information from this work, shown in Tables III(a) and III(b). (a) d-Cu-BTC [unit-cell dimension 26.279 19(3) Å]. (b) h-Cu-BTC [unit-cell dimension 26.3103 (11) Å] including water molecules (111 per unit cell) placed and oriented randomly. Color codes for atoms and molecules: cyan, C; white, H; red, O; brown, Cu.; blue, hydrate water molecules.
The PSD in Figure 7 was computed for d-Cu-BTU using the structure shown in Figure 6(a). The three main cages are clearly identified by the large peaks in PSD, and the PSD reveals that approximately 68.35% of the free volume is attributed to these main pores for the d-Cu-BTC structure. For the h-Cu-BTC structure, shown in Figure 6(b), three main cages are still present, but the two largest cages each have a film of water molecules at their surfaces, which alter both the free volume and the effective pore sizes. The free volume of the h-Cu-BTC structure is approximately (61.33 ± 0.03)% of the total volume. The PSD of the h-Cu-BTC structure in Figure 7 indicates that the effective pore sizes of the two largest pores are reduced to 10.2 and 7.2 Å (note that the peak of this pore size in the distribution is split). The diameter of the smallest cage, however, is unchanged at 5.0 Å, indicating that water molecules do not occupy the interior of the smallest cage. This is confirmed by examination of the atomic coordinates of water given in Tables III(a) and III(b) and by visual inspection of Figure 6(b). The presence of water molecules also reduces the portion of the free volume assigned to the main pores to approximately 39.86%, with the majority of the free volume lost to portions of the structure with local pore size smaller than 5.0 Å.
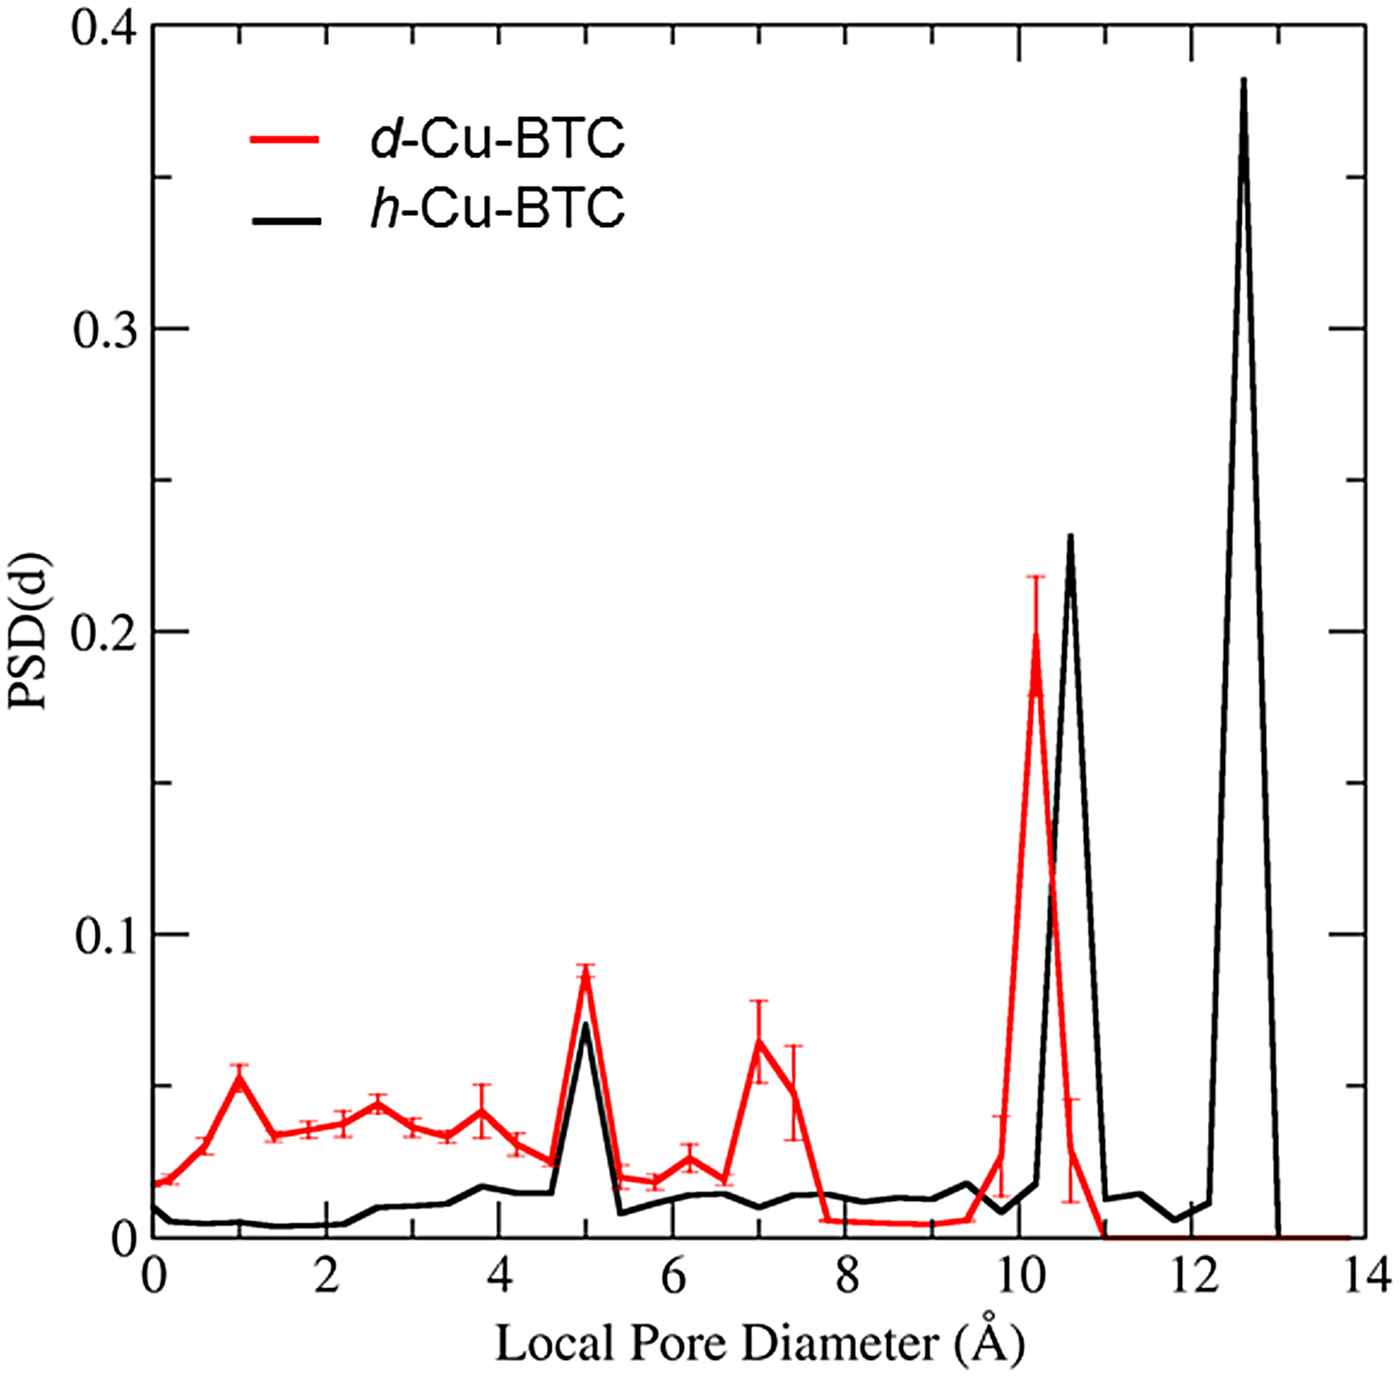
Figure 7. (Color online) PSD for the dehydrated and h-Cu-BTC as a function of local pore diameter as calculated by the method of Gelb and Gubbins (1999). The solid black line is the PSD for the d-Cu-BTC material and the solid red line is the PSD for the h-Cu-BTC material. Error bars on the PSD of h-Cu-BTC are estimates of the 95% confidence bounds computed via jackknife error analysis of 20 random realizations of hydrate water molecules.
The accessible surface area and volume of Cu-BTC was computed using N2 as the probe gas. For d-Cu-BTC, the accessible surface area was found to be (2175.9 ± 1.5) m2 g−1. In hydrated form, the accessible surface area was computed as (1291.9 ± 13.9) m2 g−1, considerably reduced from that of the dehydrated structure. With the same N2 probe, the accessible volume of d-Cu-BTC was computed as (0.2978 ± 0.0004) cm3 g−1 and that of the h-Cu-BTC structure was computed as (0.088 21 ± 0.001 22) cm3 g−1. Both metrics highlight the reduction in surface area and volume available to adsorbate gases that results from hydration of Cu-BTC.
C. Microstructures by SANS and USAXS/SAXS
Figures 8(a) and 8(b) present the combined USAXS/SAXS data for the d-Cu-BTC and h-Cu-BTC samples with fits for feature-size distributions. Although the scattering from all samples is similar at low Q [Figure 8(a)], d-Cu-BTC stored under dry conditions shows little or no scattering from fine features at high Q [Figure 8(b)]. We also note that both d-Cu-BTC and h-Cu-BTC exhibit discrete small-angle diffraction peaks in the high-Q part of the small-angle regime [Figure 8(b)]. There is a clear distinction in the scattering profiles between d-Cu-BTC and h-Cu-BTC samples over the central part of the USAXS Q range. The h-Cu-BTC data exhibit significantly more scattering intensity over this range. However, the small-angle diffraction peaks at high Q in these plots are less prominent in the h-Cu-BTC spectra than in the d-Cu-BTC spectra. The fact that the XRD peak intensity decreases as H2O is adsorbed into the structure of Cu-BTC suggests that, whereas H2O contributes to a new denser phase, the resulting sample is less crystalline than that of the d-Cu-BTC case, and a glassy phase also appears to be formed.

Figure 8. (Color online) USAXS/SAXS data for (a) d-Cu-BTC and (b) h-Cu-BTC, with fits for feature-size distributions. Vertical bars indicate computed standard deviation uncertainties at each data point.
Size distributions that assume spherical scattering features were obtained from the scattering curves using the entropy maximization algorithm, MaxEnt (Potton et al., Reference Potton, Daniell and Rainford1988). The main USAXS scattering profile is not attributable to a single-feature population of specific size but is associated with scattering from an extended size range of features, possibly comprising a fractal morphology. While present for both d-Cu-BTC and h-Cu-BTC samples, the prominence of scattering features over such an extended scale regime is clearly more pronounced in the case of h-Cu-BTC material. These points are illustrated in Figures 9(a) and 9(b). The prominence of the discrete fine features in the left-hand plot is because of the logarithmic size scale used and the fact that V(D) is a volume fraction density distribution function (in units of volume fraction per unit Å increment; Potton et al., Reference Potton, Daniell and Rainford1988). The integrated volume fraction is much less than that for the extended range of scattering features larger than ≈100 Å.

Figure 9. (Color online) MaxEnt scattering feature-size distribution for (a) d-Cu-BTC and (b) h-Cu-BTC samples.
While the integrated volume fraction over the scale range from 100 to 104 Å (1 μm) is not insignificant even in the case of d-Cu-BTC material, that for h-Cu-BTC accounts for much of the sample volume, and we can assume that the microstructural effects of H2O adsorption from the air are very significant for the whole powder morphology. We note that the increase in the volume fraction of scattering features extends to ≈5000 Å, but not to the largest features, and this corresponds to the d-Cu-BTC and h-Cu-BTC data lying almost on top of each other for Q < 0.001 Å−1.
D. USAXS/SANS intensity comparison
Figure 10 presents USAXS/SAXS and SANS data from the d-Cu-BTC and h-Cu-BTC samples. The X-ray to neutron intensity comparison is important for the Cu-BTC system. The larger than predicted USAXS/SANS intensity ratios for both the d-Cu-BTC and h-Cu-BTC cases indicate that the H2O adsorbed in the h-Cu-BTC case is completely incorporated into the solid structure. If this were not so and free H2O occupied the space between grains in h-Cu-BTC, the SANS contrast factor would increase for h-Cu-BTC, compared with d-Cu-BTC, whereas the SAXS contrast factor would significantly decrease. This would reduce the USAXS/SANS intensity ratio for h-Cu-BTC, compared with d-Cu-BTC. Clearly, this does not happen and the USAXS/SANS contrast factor ratio actually increases.

Figure 10. (Color online) Comparison of USAXS/SAXS and SANS data for the d-Cu-BTC and h-Cu-BTC samples. Vertical bars indicate computed standard deviation uncertainties at each data point.
We also note that the scattering intensity increases for both USAXS and SANS for the h-Cu-BTC case. While an increase in scattering contrast factor is predicted, the very significant increase in scattering is mostly attributable to more scattering features emerging in the h-Cu-BTC case, as discussed above. Finally, we note that both USAXS/SANS intensity ratios are somewhat larger than the predicted. This is most likely because of the much larger incident beam cross-section for SANS averaging over regions of poorer powder packing (or smaller effective sample thickness), whereas for USAXS the sample has been surveyed into a position where substantial material is present in the beam.
E. Reference X-ray powder patterns
The reference patterns for the d-Cu-BTC and h-Cu-BTC phases are given in Tables IV(a) and IV(b). In these patterns, the symbols “M” and “ + ” refer to peaks containing contributions from two and more than two reflections, respectively. The symbol* indicates that the particular peak has the strongest intensity of the entire pattern and has been designated a value of “999”. The intensity values reported are integrated intensities rather than peak heights. These patterns will be submitted for inclusion in the PDF.
Table IVA. X-ray powder pattern for dry Cu3(C9H3O6)2
Fm $\bar 3$
m (no. 225), a = 26.279 19(3) Å, V = 18 148.31(6) Å3. The symbols “M” and “ + ” refer to peaks containing contributions from two and more than two reflections, respectively. The symbol * indicates the particular peak has the strongest intensity of the entire pattern and is designated a value of “999”.
$\bar 3$
m (no. 225), a = 26.279 19(3) Å, V = 18 148.31(6) Å3. The symbols “M” and “ + ” refer to peaks containing contributions from two and more than two reflections, respectively. The symbol * indicates the particular peak has the strongest intensity of the entire pattern and is designated a value of “999”.

Table IVB. X-ray powder pattern for dry Cu3(C9H3O6)2(H2O)6.96, Fm $\bar 3$
m (no. 225), a = 26.3103(11) Å, and V = 18 213(2) Å3. The symbols “M” and “ + ” refer to peaks containing contributions from two and more than two reflections, respectively. The symbol * indicates the particular peak has the strongest intensity of the entire pattern and is designated a value of “999”.
$\bar 3$
m (no. 225), a = 26.3103(11) Å, and V = 18 213(2) Å3. The symbols “M” and “ + ” refer to peaks containing contributions from two and more than two reflections, respectively. The symbol * indicates the particular peak has the strongest intensity of the entire pattern and is designated a value of “999”.

IV. SUMMARY
The structure and reference X-ray patterns for d-Cu-BTC and h-Cu-BTC [Cu3(C9H3O6)2 and Cu3(C9H3O6)2(H2O)6.96, respectively] have been determined using both conventional laboratory X-ray technique and synchrotron X-ray techniques, respectively. Water of hydration was found partially occupying three sites in the main pore: a disordered site coordinated to Cu, and two other sites occupying the main pore. Unit-cell expansion was observed from d-Cu-BTC to h-Cu-BTC [V increases from 18 148.31(6) to V = 18 213 (2) Å3, respectively].
Using N2 as the probe gas, the accessible surface area was found to be (2175.9 ± 1.5) m2 g−1 for d-Cu-BTC and (1291.9 ± 13.9) m2 g−1 for h-Cu-BTC, considerably reduced from that of the dehydrated structure. Furthermore, the accessible volume was computed as (0.2978 ± 0.0004) cm3 g−1 for d-Cu-BTC and (0.088 21 ± 0.001 22) cm3 g−1 for h-Cu-BTC. Both metrics highlight the reduction in surface area and volume available to adsorbate gases that results from hydration of Cu-BTC.
Using a combination of USAXS, SAXS, and SANS, we have established that Cu-BTC undergoes both microstructural and structural change when exposed to moisture in the air. The H2O adsorbed is incorporated into the solid skeletal structure with an increase in density. The fact that the XRD peak intensity decreases as H2O is adsorbed into the structure of Cu-BTC suggests that, whereas H2O contributes to a new denser phase, the resulting sample is less crystalline than that of the d-Cu-BTC case.
ACKNOWLEDGEMENTS
This work utilized facilities supported in part by the National Science Foundation under Agreement No. DMR-0944772. ChemMatCARS Sector 15 is principally supported by the National Science Foundation/Department of Energy under grant number NSF/CHE-0822838. Use of the Advanced Photon Source was supported by the U. S. Department of Energy, Office of Science, Office of Basic Energy Sciences, under Contract No. DE-AC02-06CH11357. Partial financial support from ICDD through the Grants-in-Aid program is also acknowledged.