


I. INTRODUCTION
Toceranib (as its phosphate salt under the brand name Palladia) is a receptor tyrosine kinase inhibitor and is used in the treatment of canine mast cell tumors (London et al., Reference London, Malpas, Wood-Follis, Boucher, Rusk, Rosenberg, Henry, Mitchener, Klein, Hintermeister, Bergman, Couto, Mauldin and Michels2009). Toceranib functions by killing tumor cells and decreasing the blood supply to the tumor. The systematic name of the free base (CAS Registry Number 356068-94-5) is 5-[(Z)-(5-fluoro-2-oxo-1H-indol-3-ylidene)methyl]-2,4-dimethyl-N-(2-pyrrolidin-1-ylethyl)-1H-pyrrole-3-carboxamide. A two-dimensional molecular diagram is shown in Figure 1.

Figure 1. The 2D molecular structure of toceranib.
The only powder diffraction data of which we are aware was measured in the context of a study of toceranib/nanohydroxyapatite as a drug delivery platform (Sobierajska et al., Reference Sobierajska, Serwotka-Suszczak, Targonska, Szymanski, Marycz and Wiglusz2022).
This work was carried out as part of a project (Kaduk et al., Reference Kaduk, Crowder, Zhong, Fawcett and Suchomel2014) to determine the crystal structures of large-volume commercial pharmaceuticals, and include high-quality powder diffraction data for them in the Powder Diffraction File (Gates-Rector and Blanton, Reference Gates-Rector and Blanton2019).
II. EXPERIMENTAL AND STRUCTURE REFINEMENT
The toceranib sample was a commercial reagent, purchased from Sigma (Lot #139046), and was used as-received. The certificate of analysis indicated that this was the free base rather than the phosphate salt. The yellow powder was packed into a 1.5 mm diameter Kapton capillary and rotated during the measurement at ~50 Hz. The powder pattern was measured at 295 K at beamline 11-BM (Antao et al., Reference Antao, Hassan, Wang, Lee and Toby2008; Lee et al., Reference Lee, Shu, Ramanathan, Preissner, Wang, Beno, Von Dreele, Ribaud, Kurtz, Antao, Jiao and Toby2008; Wang et al., Reference Wang, Toby, Lee, Ribaud, Antao, Kurtz, Ramanathan, Von Dreele and Beno2008) of the Advanced Photon Source at Argonne National Laboratory using a wavelength of 0.458963(2) Å from 0.5 to 50° 2θ with a step size of 0.001° and a counting time of 0.1 s step−1. The high-resolution powder diffraction data were collected using twelve silicon crystal analyzers that allow for high angular resolution, high precision, and accurate peak positions. A mixture of silicon (NIST SRM 640c) and alumina (NIST SRM 676a) standards (ratio Al2O3:Si = 2:1 by weight) was used to calibrate the instrument and refine the monochromatic wavelength used in the experiment.
The pattern was difficult to index, perhaps indicating that the sample was a mixture of phases. We tried progressively permitting a greater number of unindexed lines and using several different indexing programs. Eventually JADE Pro (MDI, 2022) yielded the cell with a = 10.69345, b = 24.52105, c = 7.87506 Å, β = 107.79°, V = 1966.27 Å3, and Z = 4. The lowest-angle peak observed in the diffraction pattern (among others) was not indexed by this cell. A reduced cell search in the Cambridge Structural Database (Groom et al., Reference Groom, Bruno, Lightfoot and Ward2016) yielded 20 hits, but no structures of toceranib derivatives. The suggested space group was P21/c, which was confirmed by successful solution and refinement of the structure. Efforts to identify the unindexed lines with a possible second phase were unsuccessful.
A toceranib molecule was downloaded from PubChem (Kim et al., Reference Kim, Chen, Cheng, Gindulyte, He, He, Li, Shoemaker, Thiessen, Yu, Zaslavsky, Zhang and Bolton2019) as Conformer3D_CID_5319106.sdf. It was converted to a .mol2 file using Mercury (Macrae et al., Reference Macrae, Sovago, Cottrell, Galek, McCabe, Pidcock, Platings, Shields, Stevens, Towler and Wood2020), and to a Fenske-Hall Z-matrix file using OpenBabel (O'Boyle et al., Reference O'Boyle, Banck, James, Morley, Vandermeersch and Hutchison2011). The structure was solved by parallel tempering techniques as implemented in FOX (Favre-Nicolin and Černý, Reference Favre-Nicolin and Černý2002), with (sinθ/λ)max = 0.3 2θ max = 15.8°). The success rate represented by the FOX cost factor was low (Figure 2). The best solution (the one with the lowest cost factor) was notable because it contained hydrogen bonds and no voids were apparent. The solutions which were found most often either did not exhibit the expected hydrogen bonds and/or contained voids.
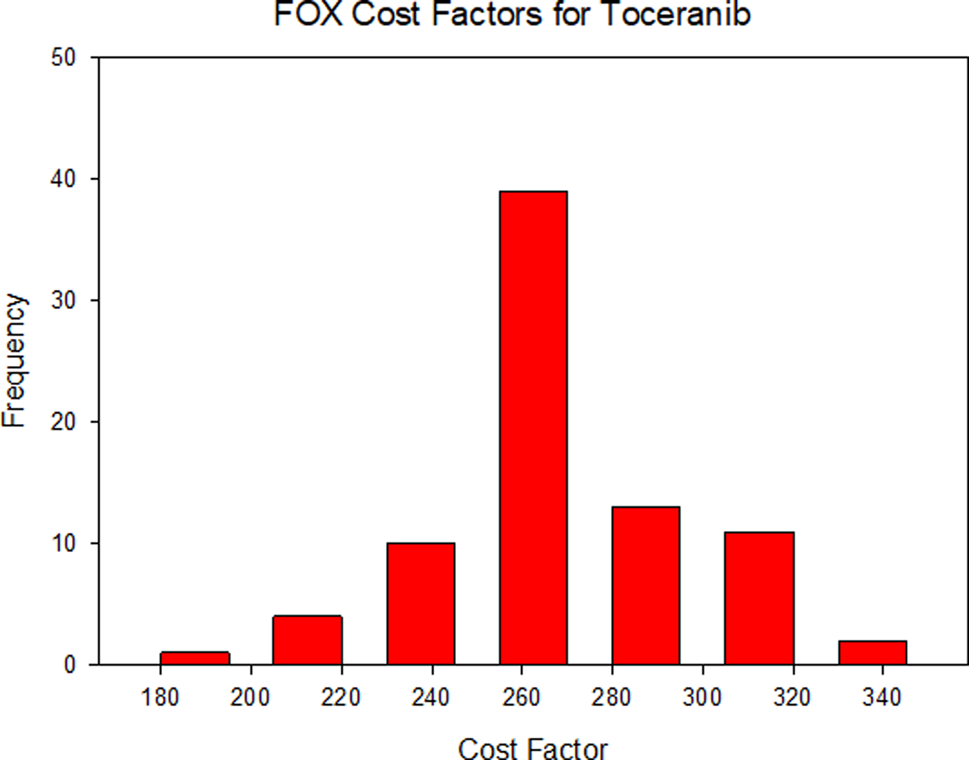
Figure 2. Cost factors (lower is better) for the 81 structure solution runs using FOX. The best solution (used for refinement) is the one with the lowest cost factor.
Rietveld refinement was carried out using GSAS-II (Toby and Von Dreele, Reference Toby and Von Dreele2013). Only the 2.0–25.0° portion of the pattern was included in the refinement (d min = 1.060 Å). The unindexed peaks were considered to be due to an impurity and ignored; no excluded regions were used. All non-H bond distances and angles (plus the plane of the fused ring system) were subjected to restraints, based on a Mercury/Mogul Geometry Check (Bruno et al., Reference Bruno, Cole, Kessler, Luo, Sam Motherwell, Purkis, Smith, Taylor, Cooper, Harris and Guy Orpen2004; Sykes et al., Reference Sykes, McCabe, Allen, Battle, Bruno and Wood2011). The Mogul average and standard deviation for each quantity were used as the restraint parameters. The restraints contributed 9.1% to the final χ 2. The hydrogen atoms were included in calculated positions, which were recalculated during the refinement using Materials Studio (Dassault, 2021). The U iso of the heavy atoms were grouped by chemical similarity. The U iso for the H atoms were fixed at 1.3× the U iso of the heavy atoms to which they are attached. A second-order spherical harmonic preferred orientation model was included in the refinement. The refined texture index was 1.019(1). The peak profiles were described using the generalized microstrain model. The background was modeled using a 6-term shifted Chebyshev polynomial, and a peak at 6.00° 2θ to model the scattering from the Kapton capillary and any amorphous component.
The final refinement (started from the result of the DFT calculation) of 113 variables using 23 037 observations and 79 restraints yielded the residuals R wp = 0.1586 and GOF = 2.49. The largest peak (0.46 Å from C21) and hole (0.96 Å from N7) in the difference Fourier map were 0.67(16) and −0.63(16) eÅ−3, respectively. The largest positive errors in the difference plot (Figure 3) are at the unindexed impurity peaks, and some negative errors occur at toceranib peaks.
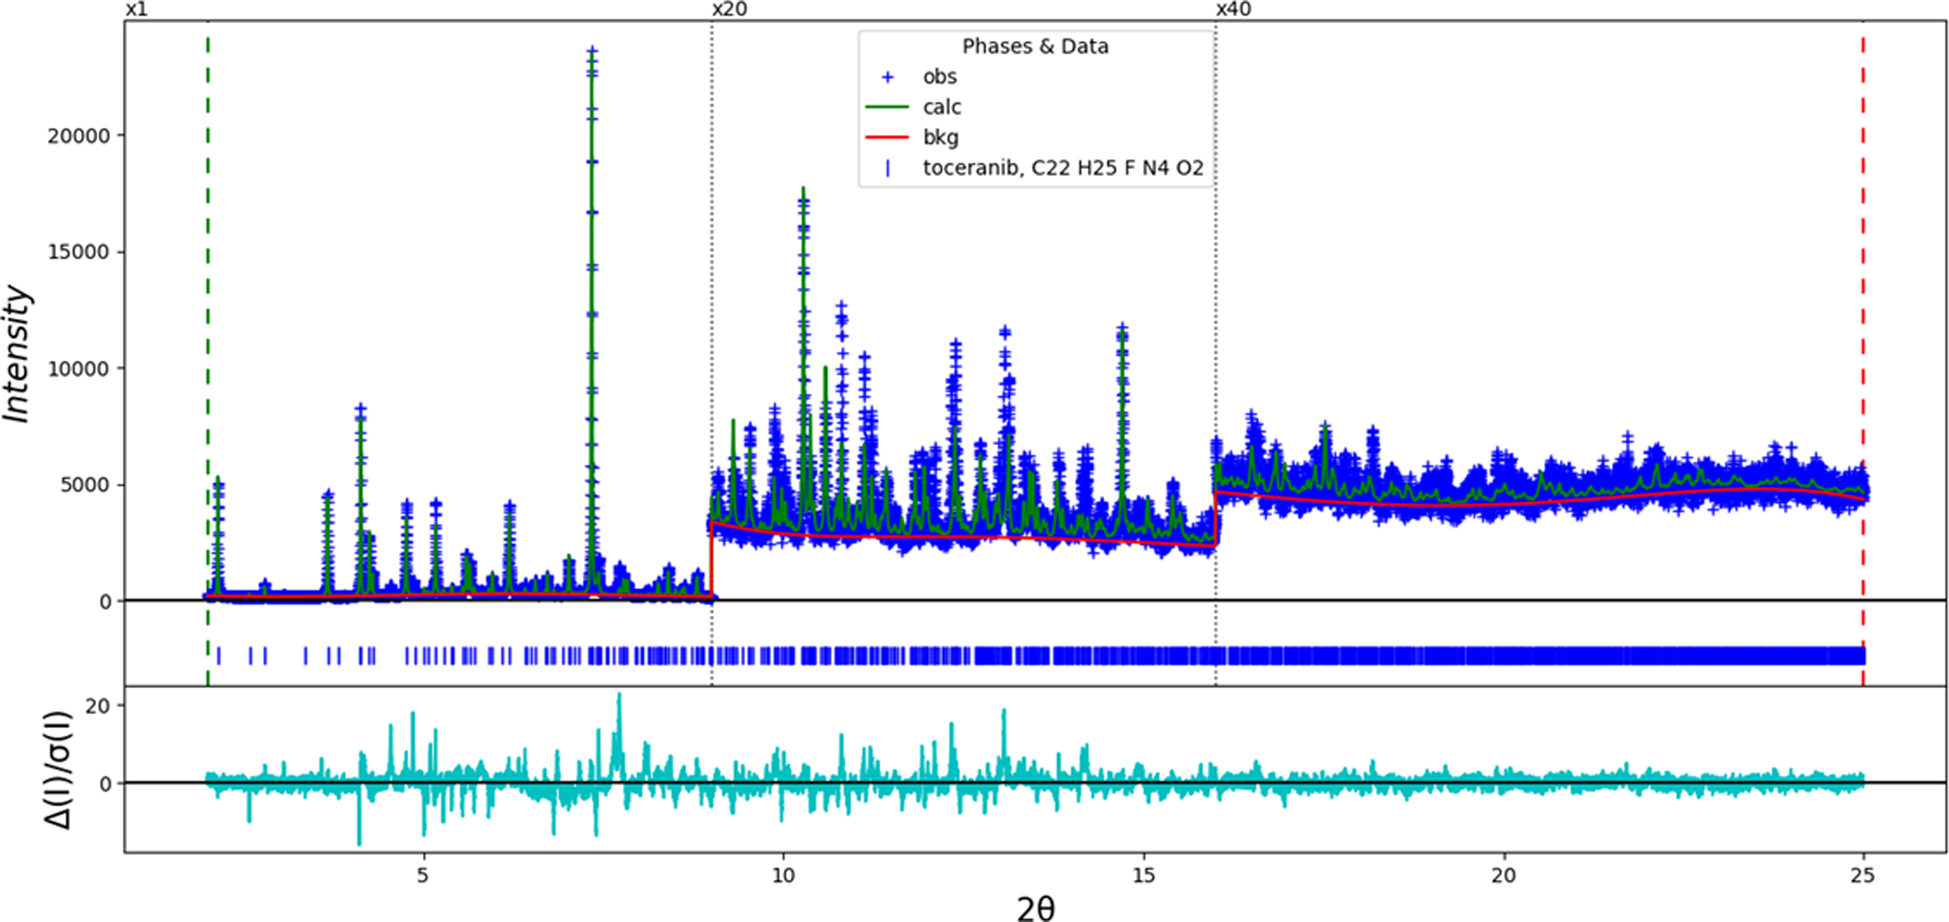
Figure 3. The Rietveld plot for the refinement of toceranib. The blue crosses represent the observed data points, and the green line is the calculated pattern. The cyan curve is the normalized error plot. The vertical scale has been multiplied by a factor of 10× for 2θ > 9.0° and by a factor of 40× for 2θ > 16.0°. The row of blue tick marks indicates the calculated reflection positions for toceranib.
The crystal structure was optimized using VASP (Kresse and Furthmüller, Reference Kresse and Furthmüller1996) (fixed experimental unit cell) through the MedeA graphical interface (Materials Design, 2016). The calculation was carried out on 16 2.4 GHz processors (each with 4 GB RAM) of a 64-processor HP Proliant DL580 Generation 7 Linux cluster at North Central College. The calculation used the GGA-PBE functional, a plane wave cutoff energy of 400.0 eV, and a k-point spacing of 0.5 Å−1 leading to a 2 × 1 × 2 mesh, and took ~101.1 h. A single-point density functional calculation (fixed experimental cell) and population analysis were carried out using CRYSTAL17 (Dovesi et al., Reference Dovesi, Erba, Orlando, Zicovich-Wilson, Civalleri, Maschio, Rérat, Casassa, Baima, Salustro and Kirtman2018). The basis sets for the H, C, N, and O atoms in the calculation were those of Gatti et al. (Reference Gatti, Saunders and Roetti1994), and that for F was that of Peintinger et al. (Reference Peintinger, Oliveira and Bredow2013). The calculations were run on a 3.5 GHz PC using 8 k-points and the B3LYP functional, and took ~8.3 h.
III. RESULTS AND DISCUSSION
The synchrotron powder pattern of this study matches the pattern measured by Sobierajska et al. (Reference Sobierajska, Serwotka-Suszczak, Targonska, Szymanski, Marycz and Wiglusz2022) well enough to conclude that they represent the same material (Figure 4). The limited range and quality of the literature pattern makes the comparison difficult, but it seems that our sample is representative. The root-mean-square (rms) Cartesian displacement between the Rietveld-refined and DFT-optimized structures of toceranib is 0.550 Å (Figure 5). This agreement is outside of the normal range for correct structures (van de Streek and Neumann, Reference van de Streek and Neumann2014). We suspect that the Rietveld refinement has distorted the structure to account for some of the intensity of the unindexed impurity peaks. This discussion concentrates on the DFT-optimized structure. The asymmetric unit (with atom numbering) is illustrated in Figure 6. The U iso of the atoms in the central portion of the molecule are larger than those on the ends. The best view of the crystal structure is down the [101] direction (Figure 7). The crystal structure consists of stacks of approximately planar molecules, with hydrogen bonds between the layers. The approximate plane of the fused ring system is (-5-46).
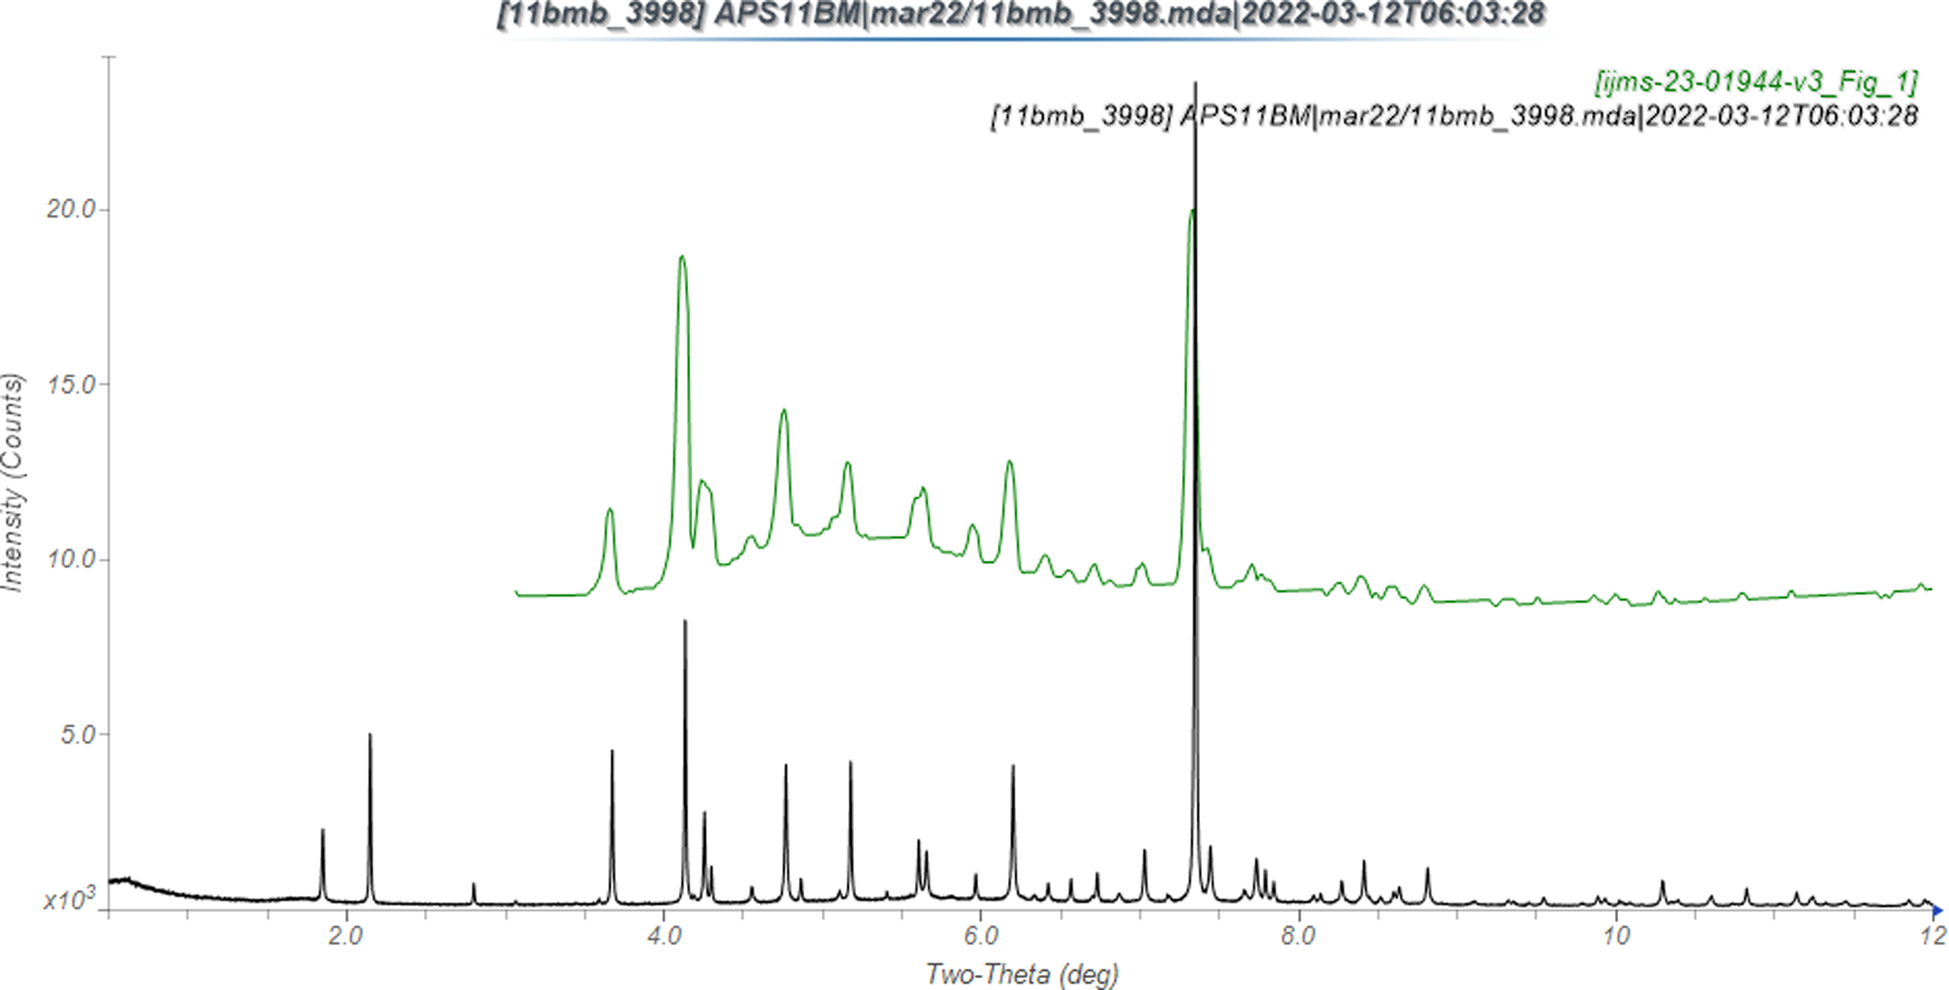
Figure 4. Comparison of the synchrotron pattern of toceranib (black) to that reported by Sobierajska et al. (Reference Sobierajska, Serwotka-Suszczak, Targonska, Szymanski, Marycz and Wiglusz2022; green). The literature pattern, measured using CuKα radiation, was digitized using UN-SCAN-IT (Silk Scientific, 2013) and was converted to the synchrotron wavelength of 0.458963 Å using JADE Pro (MDI, 2022). Image generated using JADE Pro (MDI, 2022).
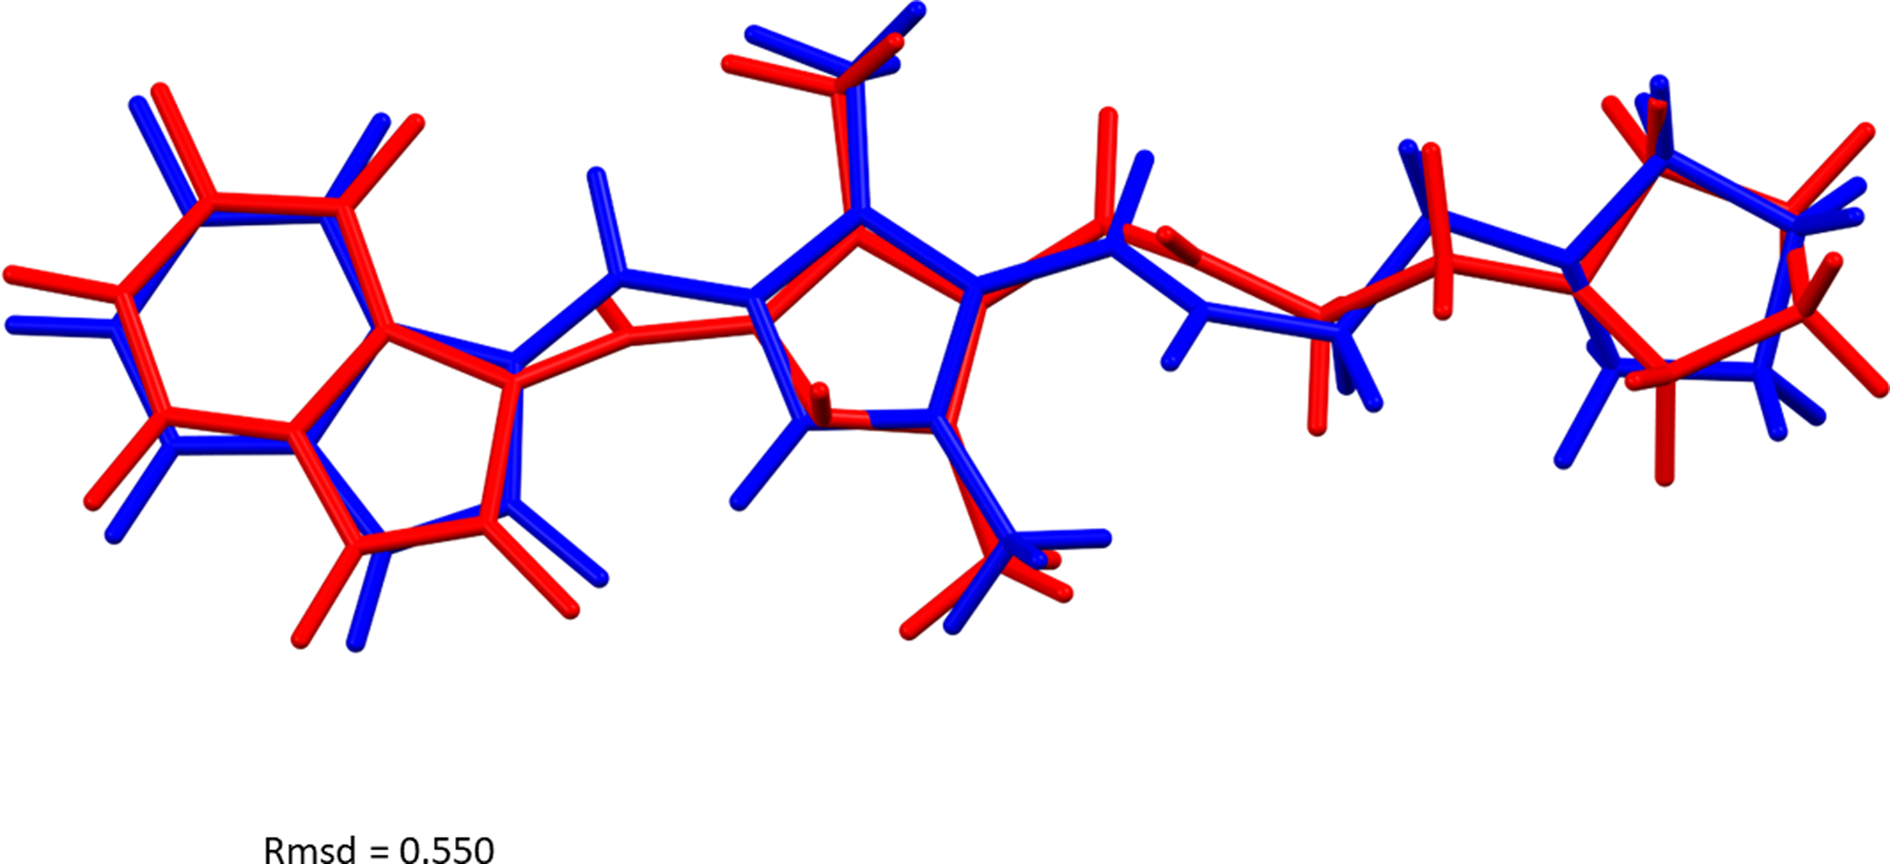
Figure 5. Comparison of the Rietveld-refined (red) and VASP-optimized (blue) structures of toceranib. The rms Cartesian displacement is 0.550 Å. Image generated using Mercury (Macrae et al., Reference Macrae, Sovago, Cottrell, Galek, McCabe, Pidcock, Platings, Shields, Stevens, Towler and Wood2020).
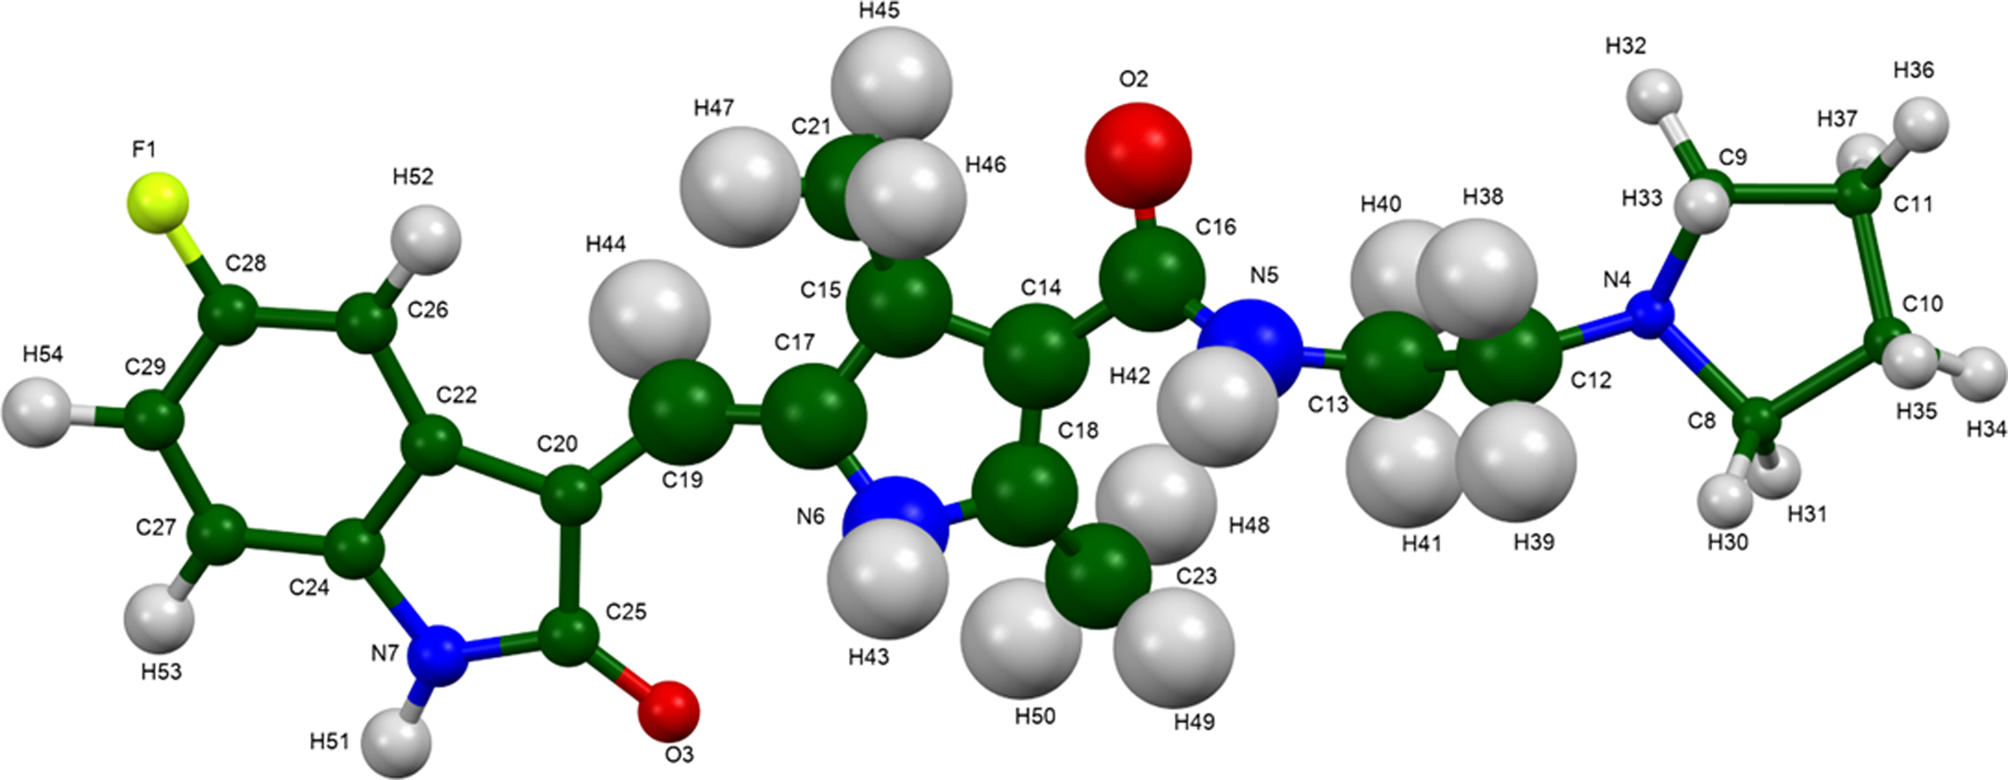
Figure 6. The asymmetric unit of toceranib, with the atom numbering. The atoms are represented by 50% probability spheroids. Image generated using Mercury (Macrae et al., Reference Macrae, Sovago, Cottrell, Galek, McCabe, Pidcock, Platings, Shields, Stevens, Towler and Wood2020).
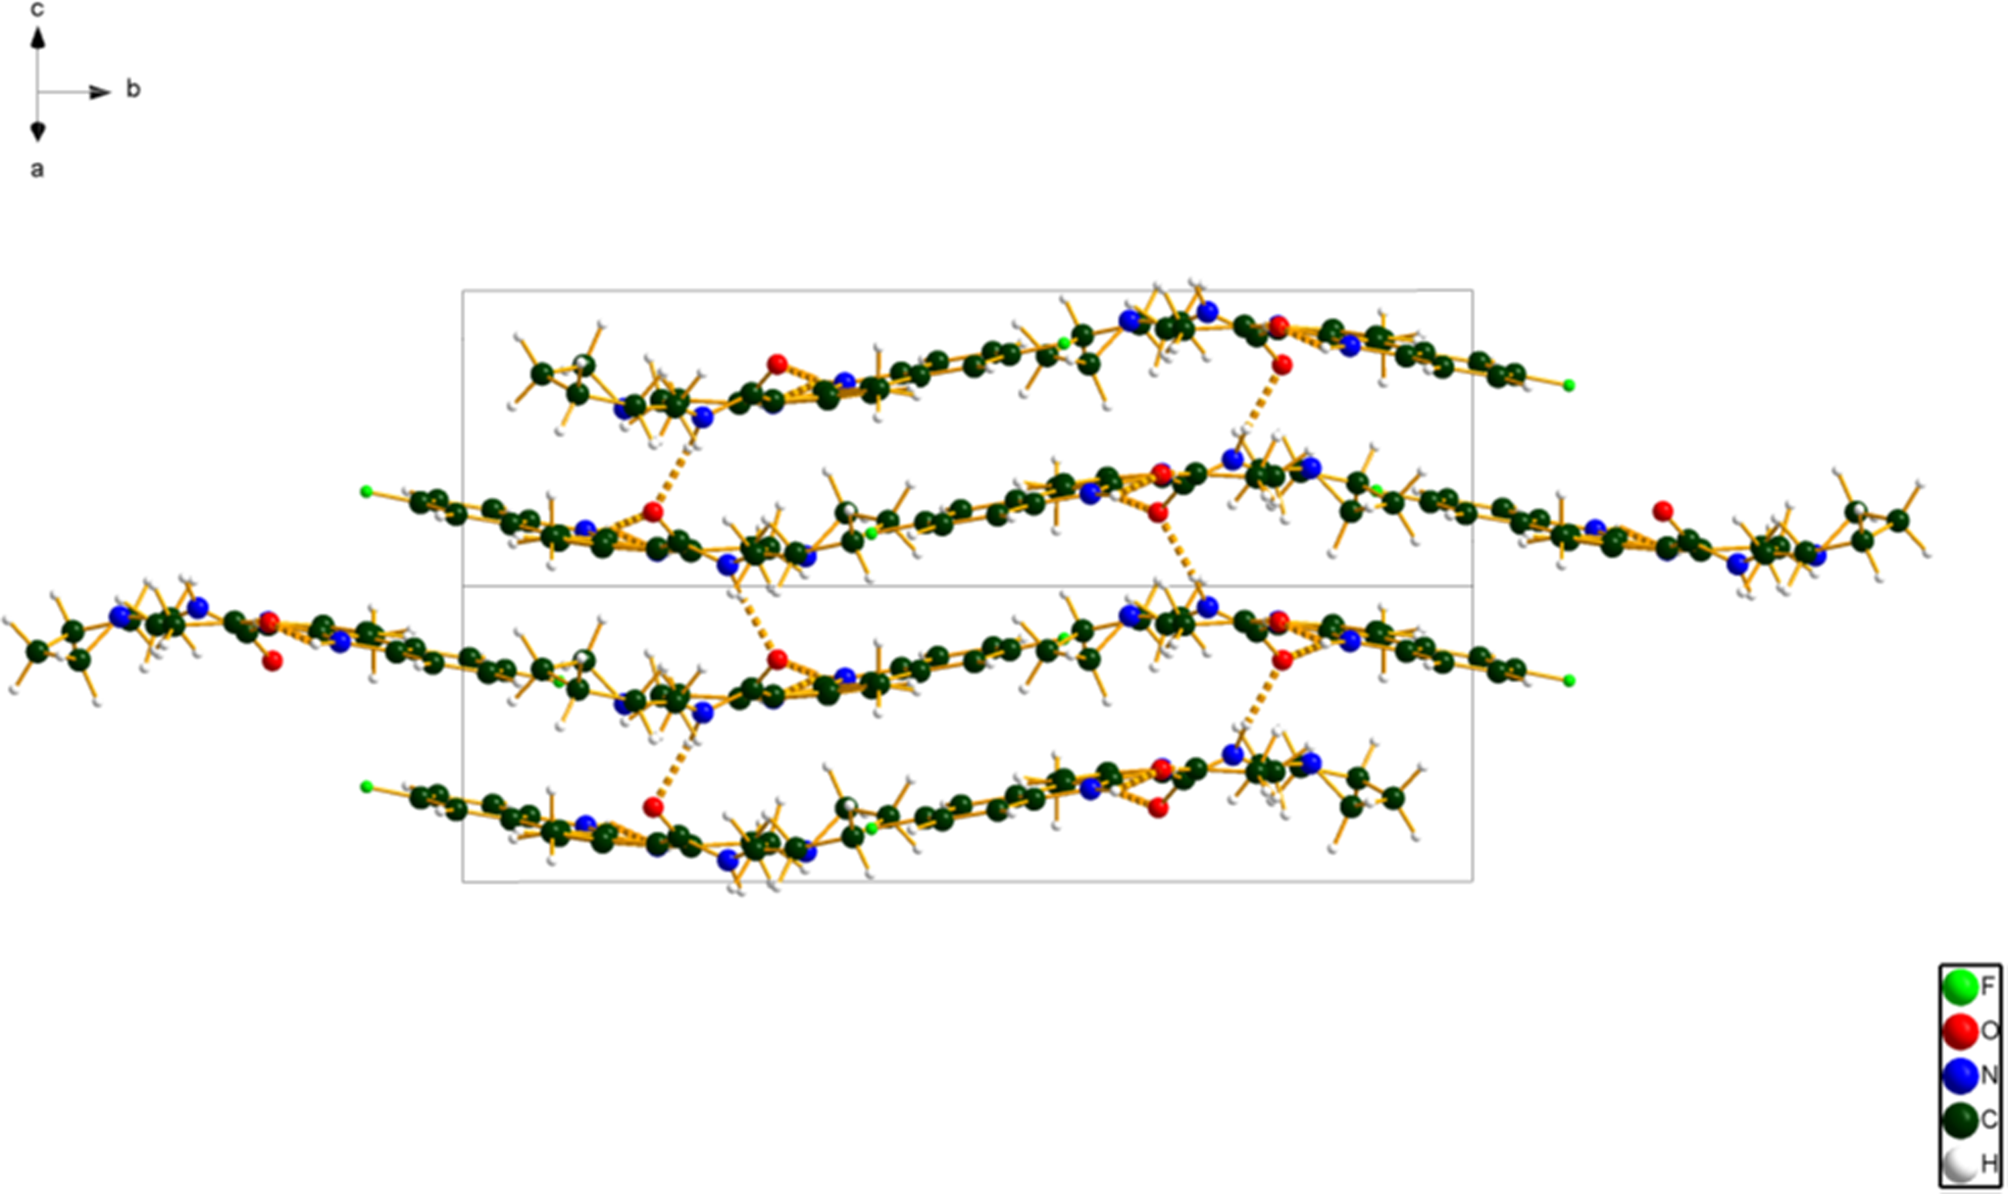
Figure 7. The crystal structure of toceranib, viewed down the [101] direction. Image generated using Diamond (Crystal Impact, Reference Putz and Brandenburg2022).
Almost all of the bond distances and bond angles fall within the normal ranges indicated by a Mercury/Mogul Geometry check (Macrae et al., Reference Macrae, Sovago, Cottrell, Galek, McCabe, Pidcock, Platings, Shields, Stevens, Towler and Wood2020). The C12–C13–N5 angle of 118.2° (average = 111.6(19)°, Z-score = 3.4) is flagged as unusual. Four torsion angles are flagged as unusual (Table I). These describe the conformation of the chain linking the pyrrolidine ring to the rest of the molecule.
TABLE I. Unusual torsion angles (Mercury/Mogul geometry analysis) in toceranib.

The quantum chemical geometry optimization of the toceranib molecule (DFT/B3LYP/6-31G*/water) using Spartan ‘18 (Wavefunction, 2020) indicated that the observed conformation is 10.2 kcal mol−1 higher in energy than the local minimum, which has a different orientation of the pyrrolidine ring. A conformational analysis (MMFF force field) indicates that the minimum-energy conformation is 1.8 kcal mol−1 lower in energy, but has conformational differences throughout the molecule. The molecule is apparently flexible, and intermolecular interactions are important in determining the solid-state conformation.
Analysis of the contributions to the total crystal energy of the structure using the Forcite module of Materials Studio (Dassault, 2021) suggests that the intramolecular deformation energy is dominated by angle distortion terms. The intermolecular energy is dominated by electrostatic attractions, which in this force field analysis include hydrogen bonds. The hydrogen bonds are better analyzed using the results of the DFT calculation.
The most prominent hydrogen bonds are N–H⋯O (Table II). The intramolecular N5–H42⋯O3 hydrogen bond is very strong. The energies of the N–H⋯O hydrogen bonds were calculated using the correlation of Wheatley and Kaduk (Reference Wheatley and Kaduk2019). The N5–H42⋯O2 and N7–H51⋯O2 hydrogen bonds link the layers. There is one C–H⋯C hydrogen bond, as well as an intramolecular 1,3 H⋯H interaction.
TABLE II. Hydrogen bonds (CRYSTAL17) in toceranib.
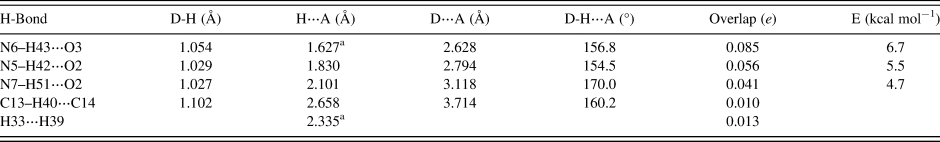
a Intramolecular.
The volume enclosed by the Hirshfeld surface of toceranib (Figure 8; Hirshfeld, Reference Hirshfeld1977; Turner et al., Reference Turner, McKinnon, Wolff, Grimwood, Spackman, Jayatilaka and Spackman2017) is 482.70 Å3, 98.26% of 1/4 the unit cell volume. The packing density is thus fairly typical. The only significant close contacts (red in Figure 8) involve the hydrogen bonds. The volume/non-hydrogen atom is typical at 16.9 Å3.
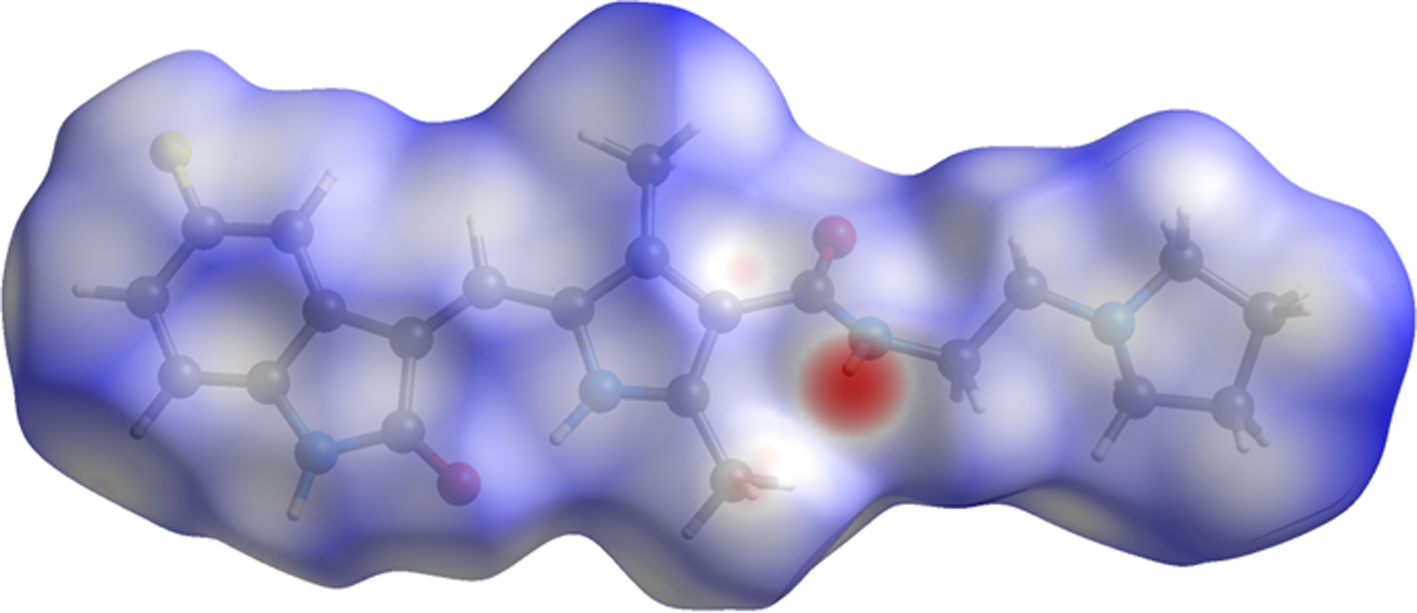
Figure 8. The Hirshfeld surface of toceranib. Intermolecular contacts longer than the sums of the van der Waals radii are colored blue, and contacts shorter than the sums of the radii are colored red. Contacts equal to the sums of radii are white. Image generated using CrystalExplorer (Turner et al., Reference Turner, McKinnon, Wolff, Grimwood, Spackman, Jayatilaka and Spackman2017).
The Bravais–Friedel–Donnay–Harker (Bravais, Reference Bravais1866; Friedel, Reference Friedel1907; Donnay and Harker, Reference Donnay and Harker1937) morphology suggests that we might expect blocky morphology for toceranib, with {010} as principal faces. A second-order spherical harmonic preferred orientation model was included in the refinement. The texture index was 1.019(1), indicating that preferred orientation was not significant for this rotated capillary specimen.
IV. DEPOSITED DATA
The powder pattern of toceranib from this synchrotron data set has been submitted to ICDD for inclusion in the Powder Diffraction File. The Crystallographic Information Framework (CIF) files containing the results of the Rietveld refinement (including the raw data) and the DFT geometry optimization were deposited with the ICDD. The data can be requested at pdj@icdd.com.
ACKNOWLEDGEMENTS
The use of the Advanced Photon Source at Argonne National Laboratory was supported by the U.S. Department of Energy, Office of Science, Office of Basic Energy Sciences, under Contract No. DE-AC02-06CH11357. This work was partially supported by the International Centre for Diffraction Data. We thank Lynn Ribaud and Saul Lapidus for their assistance in the data collection.
CONFLICT OF INTEREST
The authors have no conflict of interest to declare.


 Open access