


Introduction
Nycteribiidae, belonging to the Dipteran superfamily Hippoboscoidea, is a specialized parasitic insect on the body surface of bats (Szentivanyi et al., Reference Szentivanyi, Estók and Földvári2016). More than 270 species of Nycteribiidae are known to exist (Dick and Graciolli, Reference Dick and Graciolli2018). Together with the family Streblidae, they are called bat flies which feed on the blood of bats. As a member of the superfamily Hippoboscoidea, the Nycteribiidae also had a unique life history process that involves reproducing via viviparous puparity. Eggs are fertilized internally and all larval stages develop within the female, nourished by intrauterine “milk” glands. The larvae moult twice within the female and gravid females deposit a single terminal (third instar) larva on the roost substrate. Once deposited, the larva (called a prepupa) immediately forms a puparium. After a pupal stage of 3–4 weeks, an adult emerges and must find and colonize a host (Dick and Patterson, Reference Dick and Patterson2006). In recent years, bats and their surface parasites have received a great deal of attention as bat pathogens, such as 2019 novel coronavirus (Fan et al., Reference Fan, Zhao, Shi and Zhou2019), have become widespread worldwide. Numerous studies have found zoonotic pathogens in bat flies, e.g. Bartonella (Low et al., Reference Low, Tan, Tohiran, Lim, AbuBakar and Nasir2022), narnaviruses, reoviruses (Xu et al., Reference Xu, Feng, Chen, Shi, Fu, Yang, Liu, Gao and Liang2022). Therefore, it is hypothesized that bat flies are potential vectors for pathogen transmission. The monitoring of Nycteribiidae relies heavily on basic research on its biology, genetics, genomics, etc.
The mitochondrial genome is the only extra-nuclear genetic information carrier in animals, and it has the characteristics of lack of extensive recombination, conserved gene content, matrilineal inheritance, small molecular weight (approximately 14–21 kb), high mutation rate and a fast evolutionary rate (Yang et al., Reference Yang, Yang and Dong2022). Therefore, mitochondrial DNA is often considered a useful molecular marker for species identification, phylogeography, analysis of population structure and dynamics and molecular evolution. Currently, only 4 species of Nycteribiidae in the Genebank database have undergone complete mitochondrial genome sequencing, which is grossly inconsistent with the rich species diversity of Nycteribiidae. Therefore, in order to understand the phylogenetic relationships of the superfamily Hippoboscoidea and further study the population genetics of Nycteribiidae, we sequenced the complete mitochondrial genome of Penicillidia jenynsii and analysed its characteristics and evolutionary relationships among the superfamily Hippoboscoidea.
Materials and methods
Sample collection and identification of morphological characteristics
Bat flies were collected from the body surface of captured Miniopterus fuliginosus (Chiroptera: Miniopterus) in July 2022 in Binchuan (100.58'E, 25.83'N), Yunnan Province, China, placed in sample tubes containing 95% ethanol and stored in a −20°C refrigerator until sample processing. In the laboratory, the collected bat flies were placed directly under the SZ2-ILST dissection microscope (Olympus, Tokyo, Japan) for species identification. One sample was mounted onto glass slides with Hoyer's solution. After dehydration, drying and transparency, the mounted specimen was photographed under a Leica DM 3000 LED microscope (Lecia, Weztlar, Germany) for pictures of the morphological features of the sample.
DNA extraction, library preparation and mitogenome sequencing
The total DNA was extracted from the insects' whole body tissue using the Tissue DNA Kit (Omega Georgia, Connecticut, USA) according to the manufacturer's instructions. The DNA content was quantified using a NanoDrop One Microvolume UV-Vis Spectrophotometer (Thermo Scientific, Massachusetts, USA). A measure of 0.2 μg DNA was used as the input material for DNA library preparation. The sequencing library was prepared using the NEBNext UltraTM DNA Library Prep Kit (New England Biolabs, New York, USA) for Illumina according to the manufacturer's recommendations, and index codes were added. DNA fragments were then end-polished, A-tailed and ligated with the full-length adapter for Illumina sequencing, followed by further polymerase chain reaction (PCR) amplification. After PCR, the products were purified using the AMPure XP system (Beverly, Los Angeles, USA). The quality of the libraries was then assessed using the Agilent 5400 system (Agilent, Palo Alto, USA) and quantified by quantitative PCR (1.5 nm). The qualified libraries were pooled and sequenced on Illumina platforms with the PE150 strategy at Novogene Bioinformatics Technology Co., Ltd. (Beijing, China) according to the effective library concentration and the required amount of data.
Assembly, annotation and sequence analysis
This project used MitoZ 2.3 (https://doi.org/10.1101/489955) to assemble the mitochondrial genome. The 13 protein-coding genes (PCGs) and 2 ribosomal RNA genes (rRNA) of mitochondrial genome were annotated by MITOS (Donath et al., Reference Donath, Jühling, Al-Arab, Bernhart, Reinhardt, Stadler, Middendorf and Bernt2019), and manually compared with the known Nycteribiidae mitochondrial sequences. The 22 transfer RNA genes (tRNA) of the genome were annotated by tRNAscan-SE (Chan et al., Reference Chan, Lin, Mak and Lowe2021) and second structures of tRNAs were predicted by MITOS. Finally, the circular mitochondrial genome map was drawn using GENOMEVX (Conant and Wolfe, Reference Conant and Wolfe2008). Codon W 1.4.2 (https://sourceforge.net/projects/codonw/) was used to calculate the composition of the base and the relative synonymous codon usage (RSCU). To calculate GC- and AT- skews, the following formulas were used: AT-skew = (A – T)/(A + T) and GC-skew = (G – C)/(G + C) (Perna and Kocher, Reference Perna and Kocher1995). MEGA 11 was used to estimate the genetic distances using the Kimura-2 parameter (K2P) (Tamura et al., Reference Tamura, Stecher and Kumar2021). The non-synonymous (Ka) to synonymous rate (Ks) ratio test of 13 PCGs was conducted in DnaSP 6 (Rozas et al., Reference Rozas, Ferrer-Mata, Sánchez-DelBarrio, Guirao-Rico, Librado, Ramos-Onsins and Sánchez-Gracia2017).
Phylogenetic analysis
The phylogenetic relationships of P. jenynsii with other species of the superfamily Hippoboscoidea, which could be found in the NCBI (Table 1), were constructed on the basis of 13 PCGs, selecting Carcinoscorpius rotundicauda and Limulus polyphemus as outgroups. Since tRNA genes are highly conserved, they were not considered when constructing the phylogenetic tree (Gray et al., Reference Gray, Sankoff and Cedergren1984). Thirteen PCGs from P. jenynsii and other species available in GenBank were aligned using MAFFT 7, using default parameters (Katoh and Standley, Reference Katoh and Standley2013). Gblocks 0.91b software was used to remove the intergenic gaps and ambiguous sites (Castresana, Reference Castresana2000). The best-fit model was selected using PartitionFinder 2 (Lanfear et al., Reference Lanfear, Frandsen, Wright, Senfeld and Calcott2017). The PhyloSuite 1.2.2 was used to perform phylogenetic analyses using maximum likelihood (ML) and Bayesian inference (BI) methods (Zhang et al., Reference Zhang, Gao, Jakovlić, Zou, Zhang, Li and Wang2020). For the ML analysis, an ML phylogenetic tree was constructed using IQ-TREE 2.1.2 with 1000 ultra-fast bootstrapping under the GTR + F + I + G4 model (Minh et al., Reference Minh, Schmidt, Chernomor, Schrempf, Woodhams, Von and Lanfear2020). The construction of Bayesian phylogenetic trees was performed using the MRBayes 3.2 software based on the best-fit partitioning scheme and corresponding models in Table S1 (Ronquist et al., Reference Ronquist, Teslenko, Van Der Mark, Ayres, Darling, Höhna, Larget, Liu, Suchard and Huelsenbeck2012), in which the initial 25% of the sampled data were discarded as aged data. When the mean standard deviation of the split frequencies was below 0.01, we considered that smoothness was achieved and stopped the run. The phylogenetic tree was edited and visualized in the software FigTree.v1.4.4 (http://tree.bio.ed.ac.uk/software/figtree/).
Table 1. Mitochondrial genome information used in this study

Results
Morphological features of P. jenynsii
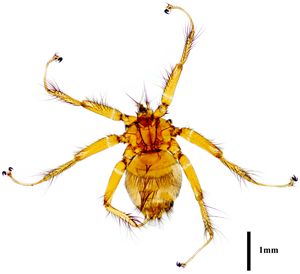
The female abdomen was the main point of identification for P. jenynsii (Fig. 1). Tergite 1 was rounded, with 2 groups of 2–4 moderately long setae in the middle of the posterior margin. Tergite 2 had a marginal row of long setae in the middle and shorter setae laterally, as well as a group of short setae on the surface that may or may not have been present. Tergite 3 was broad and bare on the surface, with a marginal row of long and short setae. The anal segment was conical, with short hairs on the dorsal surface near the base. The connexivum between the tergal plates was bare (Rothschild and Theodor, Reference Rothschild and Theodor1967).

Figure 1. Dorsal side of female Penicillidia jenynsii.
Mitochondrial genome structure and base composition
The complete mitochondrial genome of P. jenynsii is a circular, double-stranded structure of 16 516 bp in length, consisting of 13 PCGs, 22 tRNAs, 2 rRNAs and the control region (Table 2). The A, T, G and C base compositions were 40.26%, 41.88%, 6.64% and 11.21%%, respectively. The AT content was 82.15%, with a strong AT preference. The AT-skew was −0.02, and the GC-skew was −0.26. In the complete mitochondrial genome, 23 genes are located in the majority strand (J-strand), including 9 PCGs and 14 tRNAs. The other genes are located on the minority strand (N-strand), including 4 PCGs, 8 tRNAs and 2 rRNAs (Fig. 2). The accession number for GeneBank is OQ127278.

Figure 2. The circular mitochondrial genome map of Penicillidia jenynsii.
Table 2. Mitochondrial genome organization of Penicillidia jenynsii

Description of PCGs
There are 13 PCGs (Fig. 2). Except for 2 PCGs that start with TCG (cox1) and TTG (nad5), the other 11 PCGs start with standard ATN codons (4 ATT and 7 ATG). Except for 4 PCGs (cox1, cox2, nad4 and nad5) that ended with incomplete stop codons T, the remaining 11 PCGs (7 TAA and 2 TAG) have complete stop codons.
PCGs' codon usage and RSCU were calculated (Fig. 3). The results show that UUA, AUU, UUU and AUA were the most frequently used codons among the P. jenynsii's mitochondrial PCGs, and GCG, CCG and AGG were less frequently used codons.

Figure 3. Relative synonymous codon usage (RSCU) of Penicillidia jenynsii.
The Ka, Ks and Ka/Ks were computed for each PCG, and details are shown in Fig. 4. The values of Ka/Ks ranged from 0.07 to 2.52. The evolution rate of 13 PCGs was sequentially nad1 > nad2 > nad4L > nd6 > nad4 > nad5 > nad3 > atp8 > atp6 > cox3 > cox2 > cytb > cox1. Among them, nad1 was positively selected (Ka/Ks > 1), while other genes were purified (Ka/Ks < 1).

Figure 4. Ka, Ks and Ka/Ks of 13 PCGs of Penicillidia jenynsii.
tRNA, rRNA genes and control region
The length of the 22 tRNAs ranges from 54 to 71 bp. All tRNAs fold into a typical cloverleaf structure except trnF that lacked the TΨC arms and trnS1 that lacked the dihydrouracil (DHU) arm (Fig. S1). The 16S rRNA was 1273 bp in length with 83.82% AT content, which was located between trnL1 and trnV. The 12S rRNA was 789 bp in length with 81.10% AT content, which was located between trnV and the control region. The control region was located between trnV and trnI, with a sequence length of 1717 bp. Furthermore, the AT content was 90.62%.
Phylogenetic analysis of P. jenynsii
Genetic distance
The analysis of corrected genetic distances was performed to investigate the phylogenetic relationships of the superfamily Hippoboscoidea (Table 3). The range of genetic distance is from 0.114 to 0.298. The average genetic distance is 0.270. Among the genetic distances of P. jenynsii and others, the genetic distance between P. jenynsii and Phthiridium szechuanum is the smallest (0.138).
Table 3. Estimation of pairwise genetic distances (%) among the species of the superfamily Hippoboscoidea

Phylogenetic analysis
The topologies of the phylogenetic tree completed by the 2 methods were identical, with high support for each node (Figs 5 and 6). The results demonstrate the superfamily Hippoboscoidea is divided into 2 branches: one is Nycteribiida and Streblidae, and the other is Glossinidae and Hippoboscidae. The family Nycteribiidae is a monophyletic and sister group with the family Streblidae. This is consistent with the morphological classification. Penicillidia jenynsii has the closest affinity to P. szechuanum and Nycteribia parvula.

Figure 5. Phylogenetic relationships of the superfamily Hippoboscoidea using ML analyses based on 13 PCGs of mitogenomes.

Figure 6. Phylogenetic relationships of the superfamily Hippoboscoidea using BI analyses based on 13 PCGs of mitogenomes.
Discussion
In this study, we sequenced the complete mitochondrial genome of P. jenynsii for the first time and conducted a comprehensive phylogenetic analysis based on 13 PCGs of P. jenynsii and the other 11 species. The sequence of the mitochondrial genome of P. jenynsii is the same as that known in the superfamily Hippoboscoidea and is identical to the sequence of Drosophila melanogaster which is the classical structure of Diptera (Lewis et al., Reference Lewis, Farr and Kaguni1995). Mitochondrial genome rearrangements as evolutionary events are relatively rare; therefore, this is an important tool for assessing phylogenetic relationships between species. Eight of the 13 PCGs have the classical ATN as the start codon, while cox1 has TCG as the start codon, which is common in species of the superfamily Hippoboscoidea (Tang et al., Reference Tang, Li, Cheng, Duan and Liu2018; Porter et al., Reference Porter, Lutz, Steck and Chong2022). Nine of the 13 PCGs end with complete stop codons, while 4 genes (cox1, cox2, nad4, nad5) utilize incomplete stop codon T, which could be completed as TAA via posttranscriptional polyadenylation (Ojala et al., Reference Ojala, Montoya and Attardi1981). The tRNA can form a cloverleaf secondary structure except for the absence of the DHU arm of trnS1 and the absence of the TΨC arms of trnF. The absence of the DHU arm of trnS1 is a common phenomenon in Metazoa, and tRNA genes with incomplete secondary structures can maintain their normal functions through post-transcriptional modifications (Negrisolo et al., Reference Negrisolo, Babbucci and Patarnello2011). The positions of these 2 rRNAs are more conserved as in the other Dipteran mitochondrial genomes. The control region, also known as the AT-enriched region, has an AT content of 90.62% in P. jenynsii and is thought to control the replication and transcription of the mitochondrial genome (Boore, Reference Boore1767). The length variation among insect mitochondrial genomes depends mainly on the variation in the A + T-rich region, which ranges from 70 to 13 kb in length (Zhang and Hewitt, Reference Zhang and Hewitt1997).
The base composition of the mitochondrial genome shows a severe bias, with 82.15% AT content, similar to other species in the superfamily Hippoboscoidea and it has been suggested that the species with higher AT content in mitochondrial genes are considered to be more evolutionarily advantageous (Vrijenhoek, Reference Vrijenhoek1994). The results of AT-skew and GC-skew could reflect the preference for A and G bases in the mitochondrial genome (Lindahl, Reference Lindahl1993). The main causes of base skewness are asymmetric mutation of bases during replication and transcription, as well as selection pressure.
Ka/Ks values of PCGs can reflect the selective pressure on the gene and, to some extent, the conservativeness of the gene; Ka/Ks < 1 is considered purifying selection; Ka/Ks > 1 is considered positive selection. The smaller the value of Ka/Ks, the greater the selective pressure on the gene, and the more conservative the gene; the larger the value of Ka/Ks, the faster the evolutionary rate of the gene, and the less conservative the gene (Nekrutenko et al., Reference Nekrutenko, Makova and Li2002). In the mitochondrial genome, the Ka/Ks values of all PCGs except nad1 are less than 1. It is evident that most of the PCGs are conserved, among which the Ka/Ks values of cox1 and cytb are significantly smaller than those of other genes, indicating that they are under strong selection pressure and the genes are more conserved. On the contrary, the Ka/Ks values of nad1 and nad2 were relatively larger, and these genes were under weaker selection pressure and were relatively less conservative. Other studies have also shown that the cox1 and cytb genes are the most conserved in the mitochondrial genome, which are now widely used for molecular markers and phylogenetic studies (Park et al., Reference Park, Suh, Oh and Hebert2010; Tobe et al., Reference Tobe, Kitchener and Linacre2010).
Two methods of completing the phylogenetic trees of the superfamily Hippoboscoidea revealed that the families Nycteribiidae, Hippoboscidae, Glossinidae and Streblidae are monophyletic, and the species within these families clustered together with high confidence. The families Hippoboscidae, Nycteribiidae, Streblidae and Glossinidae have been combined into 1 superfamily because of their unique reproductive mode, adenotrophic viviparity (Petersen et al., Reference Petersen, Meier, Kutty and Wiegmann2007). Except for family Glossinidae which is free-living, the other 3 families are all true ectoparasites, spending all or most of their adult lives within the fur or feathers of their mammalian and bird hosts, and thus undergo parasitic adaptations (McAlpine, Reference McAlpine1989). This, together with the relatively small amount of molecular data on Hippoboscoidea species, has led to disagreement in the classification of Hippoboscoidea. Initially, only 3 families of species, Hippoboscidae, Nycteribiidae and Streblidae, were considered to belong to the superfamily Hippoboscoidea, and some experts would classify Nycteribiidae and Streblidae into Hippoboscidae (Petersen et al., Reference Petersen, Meier, Kutty and Wiegmann2007). In this study, all PCGs of the mitochondrial genes were analysed phylogenetically to provide definitive evidence for the classification of the superfamily Hippoboscoidea.
Supplementary material
The supplementary material for this article can be found at https://doi.org/10.1017/S003118202300032X.
Data availability
The genome sequence data that support the findings of this study are openly available in GenBank of NCBI at https://www.ncbi.nlm.nih.gov/, reference number OQ127278. The associated SRA number is SRR23882031.
Author's contribution
The research was designed by J. Yang, X. Huang, Y. Wang, H. Yang, X. Zhang and X. Zheng. J. Yang performed the research. Material preparation and data collection were performed by J. Yang, X. Huang, X. Zhang and Y. Wang. J. Yang, H. Yang and X. Huang analysed the data. The first draft of the manuscript was written by J. Yang. X. Huang critically revised the content of the paper. All authors have read and approved the final version of the manuscript to be published; and all authors agree to be accountable for all aspects of the work.
Financial support
This work was supported by the National Natural Science Foundation of China (No. 32001096 to Xiaobin Huang) and the Science and Technology Planning Project of the Yunnan Provincial Department of Science and Technology (No. 202001AT070025 to Xiaobin Huang).
Competing interests
None.
Ethical standards
No specific permits were required for the insects collected for this study. The bats were captured according to the standards and procedures set by the Animal Ethics Committee of Dali University (name: Dali University Ethics Committee; approval ID: MECDU-202104-27).


 Open access