


Introduction
The international trade in wildlife and wildlife products is worth billions of dollars and involves hundreds of millions of plants and animals from tens of thousands of species (Harfoot et al., Reference Harfoot, Glaser, Tittensor, Britten, McLardy, Malsch and Burgess2018). This trade includes timber, live plants, animals as pets, skins, and animal parts used for medicine, food and trophies (Wyler & Sheikh, Reference Wyler and Sheikh2008; Harfoot et al., Reference Harfoot, Glaser, Tittensor, Britten, McLardy, Malsch and Burgess2018). Wildlife trade, when unsustainable, poses one of the biggest global conservation challenges (Joppa et al., Reference Joppa, O'Connor, Visconti, Smith, Geldmann and Hoffmann2016), but also has the potential to play a pivotal role in conservation through the sustainable use and management of populations and through the generation of conservation incentives (Broad et al., Reference Broad, Mulliken, Roe and Sara2003).
CITES is an international, multilateral agreement among 183 parties (182 member states and the European Union) that aims to ensure that the international trade in c. 35,000 species of wild animals and plants is legal, sustainable, traceable and does not jeopardize the survival of these populations in the wild (CITES, 2016c). These aims are achieved through a set of rules that regulate and monitor trade, including through a licensing system and requirements to assess that trade is not detrimental to populations before it is permitted; i.e. through national-level non-detriment findings (Hemley, Reference Hemley1994; CITES, 2016a,b). In the USA, for species listed under the Endangered Species Act, enhancement findings, in addition to non-detriment findings, must also be made to demonstrate that in addition to trade not being harmful it enhances the survival of the species in the wild in the country of export. CITES is one of the most important multilateral environmental agreements for reducing biodiversity loss and has played a pivotal role in regulating the international trade of threatened species.
Here we analyse the imports of CITES-listed species and products into the USA during 1979–2014. We aim to illustrate patterns in trade, both spatially and temporally, into the USA, and identify exporting country-level characteristics associated with the magnitude of trade. One of the challenges facing analyses of legal and illegal trade in CITES-listed species is the variation in reporting rates and enforcement over time; this is minimized here because we only analyse import and seizure data from one country, the USA, which has consistently submitted CITES annual reports over time. The USA also has the Law Enforcement Management Information System (LEMIS) database for recording trade in CITES-listed and non-listed species, and for recording imports (i.e. seizures) that do not comply with CITES, other USA domestic regulations, or regulations in other countries (through the Lacey Act). Extracts from the LEMIS database are then compiled into the CITES annual report for the USA. This makes it an ideal country for an analysis of wildlife trade, and in particular because it is one of the main global importers of wildlife and wildlife products, both legally and illegally (Petrossian et al., Reference Petrossian, Pires and van Uhm2016; UNODC, 2016).
We consider both legal trade and seizures, to analyse and provide insight into how they may interact (although we note that seizures do not equate to illegal trade, as much of the illicit trade is undetected, and seizures can happen for various reasons). Our goal is to inform both current international discussions on legal and illegal wildlife trade, and to provide both an evidence base and a baseline for further analysis and material relevant to decision-making at CITES and at national levels. The latter could include, for example, informing the ongoing work of the inter-agency task force that ensures the USA meets the obligations under its Eliminate, Neutralize, Disrupt Wildlife Trafficking Act of 2016. In late 2017 this task force announced an evidence-based list of focus countries (U.S. Department of State, 2018) with which it will work collaboratively to combat wildlife trafficking; this list is expected to be revised and updated over time.
Methods
Trade data
Data were extracted from the CITES Trade Database, managed by the United Nations Environment Programme–World Conservation Monitoring Centre on behalf of the CITES Secretariat, which compiles all international wildlife trade data submitted by national CITES authorities in their annual reports to the Convention (see details in UNEP-WCMC, 2013). This database contains data on reported legal trade and seizures into the USA of CITES-listed species over a period of 36 years. There are limitations to these data. Firstly, species not listed under CITES are not included, which, among others, excludes numerous species of reptiles destined for the USA pet trade (Robinson et al., Reference Robinson, Griffiths, St. John and Roberts2015), and many species of plants traded for purposes such as ornamental gardens (Hinsley et al., Reference Hinsley, De Boer, Fay, Gale, Gardiner and Gunasekara2017). Secondly, as the objective of CITES is to regulate international wildlife trade, trade within national borders of CITES-listed species is unregulated unless relevant national legislation is in place (for example, since July 2016, there has been a near total ban on the domestic commercial trade in African elephant ivory across states within the USA; UNODC, 2016).
In our analysis we used all available USA trade records of legal and seized imports recorded in the CITES Trade Database before 4 July 2016 and spanning 1979–2014. Trade data were extracted in the form of ‘comparative tabulation’, which aggregates shipments by year containing the same species and where all other parameters match, as explained in the CITES Trade Database manual (UNEP-WCMC, 2013) and in Robinson & Sinovas (Reference Robinson and Sinovas2018). Our analysis uses only data reported by the USA (i.e. importer-reported quantities), and includes re-exports (i.e. cases where wildlife products are imported into the USA from a country that differs from the species' country of origin). Although comparing importer-reported to exporter-reported data can provide insights should discrepancies be present, given the numerous reasons and interpretations for such disparities (Robinson & Sinovas, Reference Robinson and Sinovas2018), here we focus only on the importer-reported data.
For each record we extracted information on (1) year of the trade or seizure event, (2) taxonomy (i.e. class, order, family, genus and species), (3) exporting country, (4) country of origin (reporting origin was inconsistent, and thus not considered in our analysis), (5) quantity of product, (6) unit (e.g. t, number), (7) type of product (e.g. live, processed leather, hunting trophy), and (8) product source (e.g. wild-caught, bred in captivity, illegally sourced/seized). The CITES Trade Database contains a range of different units (i.e. numbers, weights, volumes and lengths) as is appropriate for the specific record, with data converted in various ways before further analysis (Supplementary Table 1). We used only records measured in either weight or numbers in our analysis, as measures of volume and length were very sparse for all species groups in the dataset, except plants. As a result, the majority of timber products are excluded from the analysis. This reduced the number of products from 94 to 82 (Supplementary Table 2).
We analysed data across all 82 types of products and focus on four product types with both high relevance to conservation and the greatest quantity of data: (1) live animals and plants, (2) processed leather products (i.e. not unprocessed skins or pelts), (3) meat (for consumption), and (4) trophies (Supplementary Tables 2 & 3). Species were grouped into 21 taxonomic units (Supplementary Table 2). The analysis included individual exporting countries as well as UN Environment Programme regions (Brooks et al., Reference Brooks, Akçakaya, Burgess, Butchart, Hilton-Taylor and Hoffmann2016). IUCN Red List status was appended to records using the package rredlist (Chamberlain, Reference Chamberlain2018) in R (R Core Team, 2017) and the 2018-2 version of the Red List (IUCN, Reference Chamberlain2018).
Trends of import into the USA over time
We used linear regression analysis to examine trends in imports of the number of wildlife products and parts over time. The start and end years in our time-series, 1979 and 2014, were excluded because these, almost consistently, lacked values for seizure data. Trends analyses are presented by exporting country and UN Environment Programme region.
Correlates of import into the USA
We modelled the scale of imports across countries into the USA using a generalized linear model (GLM) accounting for a suite of explanatory variables related to the exporting country: (1) species richness, (2) level of endemism (number of endemic species), (3) country size (in km2), and (4) the number of IUCN threatened species (i.e. Critically Endangered, Endangered and Vulnerable) in the country (Table 1). Data on species richness and endemism, as well as country size, were sourced from the World Atlas of Biodiversity (Groombridge & Jenkins, Reference Groombridge and Jenkins2002), which presents standardized national information. However, this provided data on only mammals, birds and plants. The most up-to-date data on the number of threatened species per country were extracted from the IUCN Red List (IUCN, 2013) and, unlike the Word Atlas of Biodiversity, the Red List provided data for all taxonomic groups listed in the CITES Trade Database. Model selection was based on Akaike information criterion corrected for small sample size (AICc). All linear regression and GLM statistical analysis was done in JMP 12.0 (SAS, Harlow, UK).
Table 1 Potential explanatory variables of legal trade and seizures, the associated hypothesis and source of variable.

Results
Main countries exporting wildlife to the USA
In total, almost 1 billion (891,626,795) legally imported and c. 6 million (6,020,934) seized wildlife products and parts were reported by the USA during 1979–2014. Almost half of the legally traded items were artificially-propagated plants (432,054,568). The seizures had a higher proportion of species in the Red List threatened categories (Critically Endangered, Endangered, and Vulnerable) than the legal trade, although the differences were generally small (Table 2). However, seizures also had a higher proportion of Least Concern species, and a lower proportion of species that were not on the Red List and hence may include taxa that are threatened but as-yet unassessed. Three legally traded species (Guam flying fox Pteropus tokudae, thylacine Thylacinus cynocephalus and Round Island burrowing boa Bolyeria multocarinata), and two seized species (large Palau flying fox Pteropus pilosus and thylacine T. cynocephalus) are categorized as Extinct. Taiwan (n = 141,499,940), Thailand (n = 109,269,627), and China (n = 77,688,971) were the largest exporters of legal goods in all categories (Fig. 1a, Supplementary Table 4), and the countries from which the most seized wildlife products/parts originated were China (n = 1,532,175), Indonesia (n = 935,399) and Taiwan (n = 279,011) (Fig. 1b, Supplementary Table 5).
Table 2 The number of species reported in legal trade and in seizures, by Red List category.
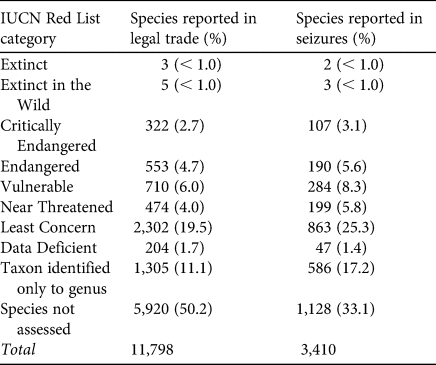

Fig. 1 Log total number of wildlife commodities from a country, which were (a) legally exported to or (b) seized in the USA during 1980–2013. Countries in grey are those from where no legal exports or seizures have been reported. The USA has a colour because of re-imports.
We assessed exports to the USA from UN Environment Programme regions of our four focal types of products (live, processed leather products, meat and trophies). North America (i.e. Canada but not Mexico in the UN Environment Programme region definition) exported the largest number of legal trophies and trophy parts to the USA (n = 195,549 individuals, an annual mean of 5,587), the majority of which were bears (American black bear Ursus americanus and brown bear Ursus arctos), followed by 72,109 legal trophies exported from Asia and the Pacific (Fig. 2d). These were mainly teeth from hippopotamuses Hippopotamus amphibius and ivory tusks from African elephants Loxodonta africana, presumably sourced from Africa and then re-exported to the USA from the Hong Kong Special Administrative Region of China (hereafter Hong Kong). Sub-Saharan Africa exported the largest number of trophies seized upon entry into the USA (n = 1,690) including birds, felids elephants, primates, rhinoceroses, and species in the ‘other mammals’ category. Sixty per cent of legal trophies traded (Supplementary Table 3) with CITES source codes were considered wild-sourced and 37.5% were reported as captive or ranched (Table 3).

Fig. 2 Legal trade and seizures from each UN Environment Programme-region for (a) live animals and plants, (b) processed leather products, (c) meat and (d) trophies. Meat is measured in t, whereas live organisms and leather are measured in the unit ‘number’ and trophies in counted individuals.
Table 3 Numbers of captive-raised or ranched and wild-sourced goods for legal imports of CITES-listed species into the USA (exporter-reported live individuals, leather goods, trophies, and t of meat). CITES source codes R, D, A, C and F were considered captive-raised or ranched; W was considered wild. There were no records with code X. Records with source code I (confiscated or seized) were excluded. Percentages are calculated only for products with source codes.

Most of the legally imported leather products were exported or re-exported from Europe (n = 46,590,955), and Latin America and the Caribbean (n = 191,338) exported the majority of the processed leather products seized at entry (Fig. 2b). Of the legal leather products, 60.5% of trade by volume with a CITES source code was reported as wild-sourced, and 19.3% as captive or ranched, with c. 20% being pre-Convention or having ‘unknown’ as a source code (Table 3).
Latin America and the Caribbean exported the most meat to the USA both legally (n = 28,091.630 t) and seized (n = 390.473 t; Fig. 2c). This meat came mainly from the queen conch Strombus gigas. Almost all of the meat trade volume (89.9%) was wild-sourced, with only 4.4% from captive or ranched organisms (Table 3).
Overall, plants were more common than animals in the trade of live specimens, both legal and seized. Asia and the Pacific exported the majority of legally traded plants (n = 273,854,354) and animals (n = 18,602,706) and also seized plants (n = 230,599) and animals (n = 53,660) to the USA (Fig. 2a). The majority of live plants from the region were orchids (Orchidaceae spp. and Orchidaceae hybrids), cycads (Cycadaceae) and euphorbias (Euphorbia) legally exported from Taiwan and Thailand, as well as ramin wood (Gonystylus) seized upon entry into the USA from Indonesia and China. Live animals from Asia and the Pacific included black corals (Antipatharia spp.) and acropora corals (Acropora spp.) seized upon entry from Taiwan; stony corals (Scleractinia spp.) legally exported from Indonesia; and bird species, including seized Eurasian teal Anas crecca (removed from CITES in 2007) from Hong Kong, and legally exported species of parrots, such as the white cockatoo Cacatua alba and the Tanimbar corella Cacatua goffiniana from Indonesia. Latin America and the Caribbean also exported large numbers of live birds, including parrot species, such as legally imported and seized parakeets (e.g. Nanday parakeet Aratinga nenday and the white-winged parakeet Brotogeris versicolurus) from Argentina and Peru. The USA enacted the Wild Bird Conservation Act in 1992, which effectively limited the import of wild (as opposed to captive-bred) birds unless they were from exempt species or families, had specifically approved sustainable management plans, or were for specified purposes such as scientific research. The majority of legal trade of live individuals with a source code was reported as captive-produced, artificially propagated or ranched (88.2%), with the majority of this being artificially-propagated plants; only 7.8% were listed as wild-sourced (Table 3).
Trade over time
Total trade summed across all 21 taxonomic groups across all 82 products increased from 1980 to 2013 (Table 4). In terms of taxonomic groups, there was a statistically significant increase over time in legal trade of arachnids, corals, insects, leeches, sea cucumbers, bears, crocodilians, other mammals, sea turtles and tortoises, and plants (Table 4). In contrast, there was a statistically significant decrease over time in legal trade of clams/snails, amphibians, elephants, lizards, rhinos and snakes (Table 4). For seizures, we observed significant increases in clams and snails, bears, cetaceans, crocodilians, fish and other mammals, and significant linear decreases in seized quantities of felids and elephants (Table 4). Only in the clams/snails group did legal trade decline and seizures increase. Trade in the body parts of elephants (African and Asian Elephas maximus) decreased for both legal trade and seizures over this time period (Table 4).
Table 4 Model outputs from regression models of the relationship between trade (legal and seizures) and year for the taxonomic groups included in the study between 1980–2013.

1Whether the model is linear or quadratic. Slope describes the parameter estimates of the linear term, and slope2 describes the parameter estimate of the quadratic term (where this was included in the model).
Explanatory factors of trade
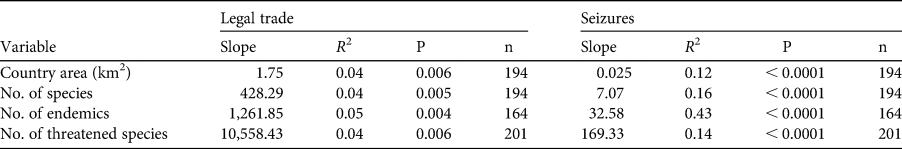
Our analyses detected significant correlations between legal trade volume and size of the exporting country, species diversity, number of endemic species and number of IUCN threatened species (Table 5). Additional significant positive correlations were observed between seizures and the same four independent variables, particularly seizures and the number of endemic species in a country (r 2 = 0.43, P < 0.0001). When we used a GLM containing all explanatory factors, to determine the most parsimonious model, we found that a model that included only area of the exporting country provided the best fit. In reality, many additional factors contribute to trade patterns, such as the inclusion of additional species in the CITES Appendices over time (Robinson & Sinovas, Reference Robinson and Sinovas2018), additional countries becoming party to CITES, trade restrictions and CITES processes (e.g. listing changes including split-listings, Review of Significant Trade, taxonomic changes), as well as national-level decisions (e.g. reservations, limitations placed on inter-state trade in the USA).
Table 5 Results of linear regression of legal trade and seizures against country area, overall number of species of mammals, birds and plants, number of endemic mammals, birds and plants, and number of threatened species (i.e. assessed by IUCN).
Discussion
Our analysis shows that the largest overall exporters of both legal and illegal wildlife products and parts into the USA are countries in Asia, but there are geographical variations depending on product type. Asia's dominance as the main continent of export to the USA is unsurprising; the South-east Asia region in particular has been identified as a wildlife trade hotspot (i.e. a region where wildlife trade poses a disproportionately large threat to biodiversity; Nijman, Reference Nijman2010; Rosen & Smith Reference Rosen and Smith2010; Petrossian et al., Reference Petrossian, Pires and van Uhm2016). For meat, Latin America and the Caribbean was the largest exporting region, also exporting large volumes of live animals. The meat imported into the USA consisted mainly of queen conch, legally exported from Honduras, and seized upon entry from Jamaica and Bahamas, as well as meat from the large freshwater fish Arapaima Arapaima gigas, legally exported from Peru. This region also exported large quantities of live animals, the majority of which were species of parrots. The large quantities of imports from this region may relate to its close proximity to the USA, as well as the extent of US tourism to these countries, as suggested elsewhere (Petrossian et al., Reference Petrossian, Pires and van Uhm2016; Reino et al., Reference Reino, Figueira, Beja, Araújo, Capinha and Strubbe2017).
In terms of IUCN Red List status (Table 2), the fact that a higher proportion of seizures are categorized on the Red List as globally threatened may indicate the high incentives to trade these species illicitly, tighter trade controls through CITES Appendix I listing or trade suspensions/domestic legislation, the difficulty in obtaining appropriate permits, or some combination of these. However, the differences in the proportion of threatened and non-threatened species seized are not large and therefore we refrain from drawing substantive conclusions. We also caution that because of the timespan we considered, it is possible that for some taxa the CITES-listed trade may have occurred before the species was categorized on the Red List and any concomitant trade restrictions imposed. Information on whether goods are wild-sourced or captive/ranched also helps to shed light on differences in trade between different product types (Table 4). Meat was disproportionately wild-sourced relative to other products, potentially a result of the challenges associated with captive-breeding compared to wild sourcing. Live individuals were disproportionately reported as captive-raised, artificially-propagated or ranched, and dominated by artificially-propagated plants, probably a result of the ease of artificial propagation.
Our results show that the number of animal and plant products reported as being legally imported into the USA outnumber the amount seized by a factor of 148, but that with more than 6 million items registered as seizures during 1979–2014, the illegal trade into the USA (which is probably more substantial than the number of goods intercepted and seized) is considerable and poses a significant risk to biodiversity conservation. In contrast to broader global trends (Underwood et al., Reference Underwood, Burn and Milliken2013; Milliken, Reference Milliken2014; Funston et al., Reference Funston, Henschel, Hunter, Lindsey, Nowak, Vallianos and Wood2016), our study suggests that there has been a decrease in seizures of products from felids, elephants and rhinoceroses into the USA (but felids, mostly of the genus Lynx, are still the second most frequently seized taxon after ursids in recent USA–Canada trade). Three factors may contribute to these observed patterns: (1) improvements in enforcement and anti-poaching efforts in exporting countries (Stoner & Pervushina, Reference Stoner and Pervushina2012; Milliken, Reference Milliken2014), (2) improvements in enforcement in the USA, (3) wild population declines, making these taxa/species less available, and (4) countries in Asia surpassing the USA as demand countries (i.e. high demand and export directly from range states to Asian countries rather than to the USA). However, poaching activities have also escalated, using more sophisticated equipment and approaches, including increased use of online markets on the dark web (Stoner & Pervushina, Reference Stoner and Pervushina2012). Thus, it is likely that increased demand from the largest importer of ivory and rhinoceros horn (i.e. East and South-east Asia) has displaced trade of rare animal products and in part explains reduced imports into the USA (Underwood et al., Reference Underwood, Burn and Milliken2013; Milliken, Reference Milliken2014).
For most commodities, countries accounting for the largest share of the legal trade also exported the largest number of illegal products, suggesting an overall positive relationship and interaction between legal and illegal trade flows. However, for leather products, for which Latin America and the Caribbean were responsible for most of the seized exports, Europe and Asia-Pacific accounted for most of the legal exports. Although Europe dominated the legal trade of processed leather products for the fashion industry, these do not originate from Europe but are imported to fashion houses in Italy and, to a lesser extent, France and other European countries, from other parts of the world, and then re-exported to the USA. Seized trophies came predominantly from African countries and the majority of these were vervet monkeys Chlorocebus pygerythrus and bonteboks Damaliscus pygargus from South Africa and African elephants from the Democratic Republic of the Congo. However, seized pigeons and doves (Columbidae spp.) from Mexico and saiga antelope Saiga tatarica imported from Hong Kong (likely re-exports) are also found in the trophy category. In contrast, legally imported trophies were sourced predominantly from hunts of grizzly and American black bears in Canada (Garshelis et al., Reference Garshelis, Scheick, Doan-Crider, Beecham and Obbard2016; McLellan et al., Reference Mclellan, Proctor, Huber and Michel2017; Petrossian et al., Reference Petrossian, Pires and van Uhm2016), although there is animal smuggling in this region (von Scheel, Reference Von Scheel2018).
Although African countries were the biggest exporters of trophies seized at the USA border, the volumes of seized trophies were dwarfed by the number of legal trophies exported from Africa to the USA. Legal trophy hunting in many African countries is big business, with South Africa alone generating an estimated USD 137 million from international hunting in 2014 (Sinovas et al., Reference Sinovas, Price, King, Davis, Hinsley and Pavitt2016). However, although legal regulated trophy hunting has the potential to contribute to sustainable livelihoods of local communities, this is a complex and controversial topic. The import of high-value leather products from Europe illustrated another complication of the role of biological resource use in improving local livelihoods. When the value-adding production stage takes place beyond the native range of a species, this reduces in-country benefits, including for conservation of wild animals in their range states, and may promote the farming of these species (e.g. crocodiles and rhinoceroses in southern Africa, Robinson et al., Reference Robinson, Griffiths, St. John and Roberts2015, and vicuña ranches in South America, Lichtenstein, Reference Lichtenstein2009).
Our analysis of factors that may explain trade volumes found that although multiple factors were significant, in the most parsimonious model the area of a country was the most important predictor of trade volume. However, the variance explained by these factors was very low for the legal trade, and relatively low for seizures (Table 5). Thus, these results suggest there is a weak link between large countries having larger volumes of wildlife trade into the USA, perhaps generally reflecting larger volumes of overall trade, and that large biodiverse countries with many endemics may provide more source material that is ultimately seized. It may also reflect priorities in the USA on combatting illegal trade.
Overall, we found an increase in legal wildlife trade as well as seizures into the USA over time, and there are a number of possible reasons for this trend. Firstly, the ongoing addition of species to the CITES Appendices and increase in CITES parties may explain some of this increase, with more species and trading partners being recorded in trade. Secondly, the increase is associated with globalized markets and economic and human population growth (Nijman, Reference Nijman2010). Thirdly, international travel and transport of goods is becoming easier and more commonplace, also facilitating trade in wildlife and influencing what people desire and demand (Wyler & Sheikh, Reference Wyler and Sheikh2008). Fourthly, increasing access to online information and e-markets is a contributing factor to the increasing demand and market expansion for, at least, pets and ornamental plants, and is potentially a greater factor in the illegal than in the legal trade (RBG Kew, 2016).
Conservation implications and applications
There are a number of ways in which our analysis can be applied to wildlife trade policy. Firstly, it is clear that the USA remains a major importer and consumer of both legally and illegally traded wildlife products. As a result, the USA has an important role to play in ensuring that legal and sustainable trade can continue to provide conservation incentives and support local livelihoods in species range countries, while also stepping up efforts against illegal trade to minimize the profitability of wildlife trafficking. Secondly, addressing illegal trade can be informed by an understanding of legal trade routes and the geography of wildlife trade; in addition, actions need to be tailored to region- and country-specific needs. Thirdly, as with legal trade, illegal trade often consists of wildlife re-exported from intermediary countries, highlighting the importance of understanding key entrepôts that could benefit from enforcement or capacity support, in addition to countries of origin. Lastly, as the USA refines its list of focal countries as part of its Eliminate, Neutralize, Disrupt Wildlife Trafficking Act, these types of in-depth analyses that examine both legal trade and seizures and their potential interactions can help inform anti-trafficking activities and priorities. The lag in reporting data to the CITES Trade Database means that a number of years will pass before it is clear if decisions taken at recent CITES Conferences of Parties, or changes in rules and regulations in the USA, have been effective in reducing legal trade in overexploited species or curbing illegal trade flows along established international wildlife trade routes.
Acknowledgements
We thank all the countries that have submitted their trade records to the CITES Secretariat for inclusion in the CITES Trade Database. MTBO thanks all the people in the Centre for Macroecology, Evolution and Climate in Denmark and UNEP-WCMC in Cambridge who assisted with data gathering, organization and analysis during her Master's thesis. This work was supported by the Danish National Research Foundation (DNRF96), VILLUM FONDEN (VKR023371), the GCRF Trade Hub, and the Marie Sklodowska-Curie Actions (H2020-MSCA-IF-2015-706784).
Author contributions
Study design: MTBO, NDB; methods and statistical analysis: MTBO, JG, MH, NJS; data analysis and writing: MTBO, DPT, KN, NDB; dataset guidance: BP; theoretical feedback on the use of the database and structure of data: JG, DPT, BP, PS, KN.
Conflicts of interest
None.
Ethical standards
This research abided by the Oryx guidelines on ethical standards.


 Open access