


Introduction
Across the tropics of Latin America, Africa and Asia, information on wild felids tends to be based on indirect signs because dense vegetation typically precludes direct observations and because these species tend to be rare as a result of their trophic status (Carter et al., Reference Carter, Jasny, Gurung and Liu2015; Rayan & Linkie, Reference Rayan and Linkie2015; Jędrzejewski et al., Reference Jędrzejewski, Puerto, Goldberg, Hebblewhite, Abarca and Gamarra2017). Remote detection devices, primarily camera traps, facilitate surveying felids that are otherwise difficult to detect, enabling researchers to investigate felid ecology and population status, and gain a better understanding of the threats to these species (Linkie et al., Reference Linkie, Chapron, Martyr, Holden and Leader-Williams2006; Kawanishi et al., Reference Kawanishi, Sunquist, Eizirik, Lynam, Ngoprasert and Wan Shahruddin2010; Henschel et al., Reference Henschel, Hunter, Coad, Abernethy and Mühlenberg2011; Rich et al., Reference Rich, Kelly, Sollmann, Noss, Maffei and Arispe2014). There are 10 felid species in South-east Asia, occurring in open savannahs, deciduous forests and humid evergreen forests along the equator (Sunquist & Sunquist, Reference Sunquist and Sunquist2002). Little is known about most of these species, particularly the smaller-bodied ones. However, recent camera-trap surveys have provided new information on the relative abundance, occupancy and/or habitat preference of the Sunda clouded leopard Neofelis diardi, Asiatic golden cat Catopuma temminckii, Bornean bay cat Catopuma badia, marbled cat Pardofelis marmorata, leopard cat Prionailurus bengalensis and flat-headed cat Prionailurus planiceps (Haidir et al., Reference Haidir, Matthew, Yoan and Macdonald2013; Wearn et al., Reference Wearn, Rowcliffe, Carbone, Bernard and Ewers2013; McCarthy et al., Reference McCarthy, Wibisono, McCarthy, Fuller and Andayani2015; Hearn et al., Reference Hearn, Ross, Macdonald, Samejima, Heydon and Bernard2016a; Rustam et al., Reference Rustam, Hearn, Ross, Alfred, Samejima and Heydon2016).
To date, wildlife research in Sumatra has mainly focused on the Indonesian Ministry of Environment and Forestry's priority species, the Sumatran tiger Panthera tigris sumatrae, Sumatran elephant Elephas maximus sumatranus, Sumatran rhinoceros Dicerorhinus sumatrensis, Sumatran orangutan Pongo abelii and, most recently, the newly discovered Tapanuli orangutan Pongo tapanuliensis (Hedges et al., Reference Hedges, Tyson, Sitompul, Kinnaird, Gunaryadi and Aslan2005; Wibisono & Pusparini, Reference Wibisono and Pusparini2010; Pusparini et al., Reference Pusparini, Sievert, Fuller, Randhir and Andayani2015; Sunarto et al., Reference Sunarto, Kelly, Parakkasi and Hutajulu2015; Nowak et al., Reference Nowak, Rianti, Wich, Meijaard and Fredriksson2017). This attention is justified because these flagship species or subspecies are endemic, categorized as Critically Endangered on the IUCN Red List, and able to attract international attention and conservation funds that provide wider benefits to the wildlife, rainforest habitats and protected areas within their range. However, the Sunda clouded leopard can also play a role as a wildlife conservation ambassador, as shown elsewhere in Asia, through its ability to generate political support for both the species itself and the protected areas it inhabits (Macdonald et al., Reference Macdonald, Hinks, Weiss, Dickman, Burnham and Sandom2017).
Here we investigate demographic parameters of Sunda clouded leopards in four rainforest areas in one of South-east Asia's largest protected areas, Kerinci Seblat National Park in west-central Sumatra. The study areas are characterized by different forest types, elevation gradients and human disturbance levels. Our study builds on earlier work that was based on bycatch data from a tiger survey in four study areas in the Park, with estimated Sunda clouded leopard densities of 0.4–1.3 individuals/100 km2 (Sollmann et al., Reference Sollmann, Linkie, Haidir and Macdonald2014). We conducted surveys that specifically focused on small to medium-sized felids and applied analyses that explore additional research questions. For example, we examined how detection probability, movement distribution and density of Sunda clouded leopards vary amongst different forest types along an altitudinal gradient.
Study area
Kerinci Seblat National Park is a UNESCO World Heritage Site on the island of Sumatra. The 16,194 km2 Kerinci Seblat forest landscape stretches along c. 370 km of the Bukit Barisan mountain range and covers the provinces of Jambi, Bengkulu, South Sumatra and West Sumatra. The altitude is 150–3,805 m, with lowland forest < 300 m (20.2% of the landscape), hill forest at 300–800 m (26.6%), submontane forest at 800–1,200 m (30.9%), midmontane forest at 1,200–1,900 m (17.2%) and upper montane and sub-alpine forest > 1,900 m (5.1%). Our four study areas were Ipuh (lowland forest), Bungo and Sipurak (hill forest), and Renah Kayu Embun (submontane and midmontane forest; Fig. 1, Table 1, Supplementary Table 1).

Fig. 1 Study areas in Kerinci Seblat National Park (KSNP), west-central Sumatra.
Table 1 Summary of camera-trap sampling effort and Sunda clouded leopard Neofelis diardi detections in the four study areas in Sumatra, from an earlier study (Sollmann et al., Reference Sollmann, Linkie, Haidir and Macdonald2014; I) and this study (II).

1 Earlier study (Sollmann et al., Reference Sollmann, Linkie, Haidir and Macdonald2014) consisted of two trapping phases.
2 Does not include photos of unidentified/unsexed individuals.
Methods
Data collection
We conducted camera-trap surveys during June 2014–December 2016 in Kerinci Seblat National Park and adjacent forest areas. We designed the surveys to target the Sunda clouded leopard, golden cat, marbled cat and leopard cat, by placing cameras on ridge trails and animal paths, with the majority (60%) of camera traps placed where the forest canopy was disrupted and the semi-arboreal felids could be expected to descend. All camera stations in Bungo, Sipurak and Ipuh, and 70% of stations in Renah Kayu Embun, consisted of camera traps set up in pairs, to capture both flanks of passing animals. The camera traps within each study area covered 80 grid cells of 1 km2. Prior to setting the cameras, we conducted reconnaissance surveys to determine the locations in a grid cell that were most likely to record clouded leopards and other small and medium-sized felids. We set up cameras within 100 m of the planned deployment points at a height of 30–40 cm off the ground. The paired traps were positioned at a distance of 2–3 m from the target trail, with a spacing of 0.7–1.3 km between camera stations (Supplementary Table 1). We used heat-motion sensor camera traps Cuddeback Ambush IR (Cuddeback, De Pere, USA) and Panthera IV (Panthera, New York, USA), without any bait or lure to attract felids. We set camera traps to operate continuously for 3 months and visited stations every 2 weeks for maintenance and data retrieval. We compiled all clouded leopard photographs, and at least three experienced project members then manually identified individual animals based on their unique pelage pattern. We used these data to develop daily detection matrices.
Clouded leopard density
Heterogeneity in the probability of detecting clouded leopards can be influenced by a variety of factors, including sex and camera trap site-specific covariates, although with limited data it is not possible to derive sex-based density estimates (Efford & Fewster, Reference Efford and Fewster2013). We estimated population abundance using a spatially explicit capture–recapture method, which assumes that each individual animal has a unique activity centre and that its probability of detection decreases with increasing distance from this centre. We constructed daily detection matrices, which included the spatial attributes of each individual, for each camera station. We analysed camera-trap data and developed detection matrices using the package camtrapR in R 3.4.1 (Niedballa et al., Reference Niedballa, Sollmann, Courtiol and Wilting2016).
We used a Bayesian spatially explicit capture–recapture approach with the R package SPACECAP 1.1.0 (Gopalaswamy et al., Reference Gopalaswamy, Royle, Hines, Singh, Jathanna, Kumar and Karanth2012) because it is more suitable for population estimations based on a small sample size (Wearn et al., Reference Wearn, Rowcliffe, Carbone, Bernard and Ewers2013; Hearn et al., Reference Hearn, Ross, Bernard, Bakar, Hunter and Macdonald2016b). We treated the study areas as independent sites because they are separated by at least 80 km, and a previous study recorded daily movements of clouded leopards of 2.3–2.4 km, with home ranges of 23–45 km2 (Grassman et al., Reference Grassman, Tewes, Silvy and Kitti2005). In addition, altitude and forest types vary between the study areas, and some are separated by settlements, towns and major roads that could act as barriers to clouded leopard movement (Grassman et al., Reference Grassman, Tewes, Silvy and Kitti2005; Linkie et al., Reference Linkie, Chapron, Martyr, Holden and Leader-Williams2006). Using QGIS 2.10.1 (QGIS, 2016), we created a state space or habitat mask that describes the potential home range centre of an individual based on their spatial movements and habitat suitability. A habitat mask limits the ranges of individual clouded leopard movement estimations to suitable (forested) areas (Gopalaswamy et al., Reference Gopalaswamy, Royle, Hines, Singh, Jathanna, Kumar and Karanth2012; Fig. 2).
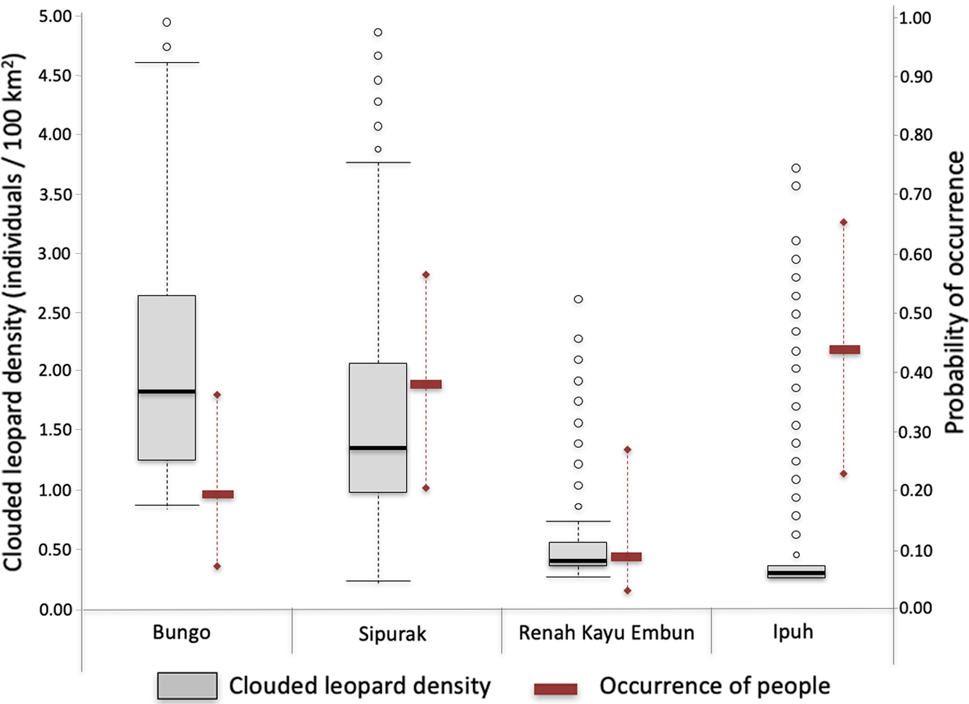
Fig. 2 Estimated Sunda clouded leopard Neofelis diardi density values derived from SPACECAP (box plots; black line in the box is the median, box is 50% distribution of the data, the whiskers represent minimum and maximum values, the circles represent outlier values) and associated occurrence of people (solid rectangles represent the median, whiskers represent minimum and maximum values) illegally entering each of the four study areas.
We used a habitat mask with a 15 km buffer, based on movement patterns of clouded leopard studies from Malaysia and Bhutan that used a 12–30 and 25 km buffer, respectively (Hearn et al., Reference Hearn, Ross, Bernard, Bakar, Goossens, Hunter and Macdonald2017; Penjor et al., Reference Penjor, Macdonald, Wangchuk, Tandin and Tan2018). We applied the buffer around the minimum convex polygon containing all camera traps in a study area. Using a forest cover layer obtained from the Ministry of Environment and Forestry (KLHK, 2016), we then categorized the buffer area as habitat (forested area) or non-habitat (other areas), with a resolution of 0.5 × 0.5 km. Data augmentation was based on 10 times the number of identified individual animals. For the analysis, we ran 50,000 iterations with a burn-in of 20,000 and thinning of 10. We performed a Geweke test to investigate models convergence in the Markov chain Monte Carlo that should have values close to zero, as an indication that the data calculation has converged. The model also estimated the Bayesian P-value to assess model fit, whereby a value of 0.5 indicates a perfect fit, and values should not be close to 0.0 or 1.0 (Gopalaswamy et al., Reference Gopalaswamy, Royle, Hines, Singh, Jathanna, Kumar and Karanth2012).
We used the density values derived from SPACECAP to test for differences between the study areas, whereby non-overlapping upper and lower highest probability density estimates indicate a significant difference in density. However, overlapping highest probability densities could still be significantly different, so we performed a Tukey's honest significant difference test, with P < 0.05 as the significance level (i.e. Pr(>|z|); Tukey, Reference Tukey1949).
Anthropogenic pressure
To understand the anthropogenic pressures in the study areas, we analysed camera-trap photographs of people. Where possible, we categorized them as fishers (groups of < 5 people with machetes and small backpacks, which are typically used to carry fishing nets), collectors of non-timber forest products (groups of 3–5 people without heavy equipment such as rifles or machetes), bird poachers (groups > 5 people carrying baskets/cages made from rattan, tree branches or sticks with glue on one end, and small blades < 40 cm length), armed tiger/ungulate poachers (groups < 5 people carrying hunting rifles and/or spears, accompanied by hunting dogs, or who were detected during dusk or at night carrying small rucksacks and torches) and forest patrol/monitoring team members (the latter being the only people who are permitted to enter the Park).
To investigate the spatial occurrence of people entering the Park illegally, we used an occupancy modelling framework approach. We aggregated human detections in each camera-trap station into 14-day detection/non-detection intervals, from which we constructed single species single season occupancy models that tested for associations between the presence of people and four landscape variables: study area, elevation, distance to forest and distance to river (MacKenzie et al., Reference MacKenzie, Nichols, Lachman, Droege, Royle and Langtimm2002). We performed a Tukey's honest significant difference test to determine whether the occurrence of people was significantly different between study areas (Tukey, Reference Tukey1949).
Results
Clouded leopard detections and abundance
The 293 camera-trap stations generated a combined sampling effort of 28,404 trap nights and captured 163 independent clouded leopard photographs, of which 114 were identified to an individual. There were 18 adult individuals (12 males, 4 females and 2 of unknown sex), with 76 captures and 38 recaptures (Table 1). The most frequently captured individual was a male that was recorded in 16 camera-trap stations in Renah Kayu Embun. Females were captured in fewer stations, with the highest capture count being of one female in five stations in Ipuh. We recorded no cubs (Table 1).
Clouded leopard density estimates varied amongst study areas, with Bungo having the highest density at 2.38 individuals/100 km2 (highest probability density 1.11–4.26) and Ipuh the lowest at 0.75 (0.73–0.88; Table 2). Comparing the movement parameters (σ ± SE) between study areas showed that individual animals in Sipurak moved just over half (56.6%) as much those in Renah Kayu Embun, and those in Ipuh ranged more widely than in the other study areas. The Tukey honest significant difference test showed significant differences between all paired density estimates (Pr(>|z|) < 0.001). The Geweke tests for the Markov chain Monte Carlo differed amongst study areas. In Ipuh, despite having a large number of iterations, the model exceeded the tolerated Markov chain Monte Carlo range value, meaning the population parameters from this study area need to be interpreted with caution. Nonetheless, the Bayesian P-value, which assesses model fit for each study area, was close to 0.5, except for Sipurak (0.7), indicating that all models across all study areas were adequate (Gopalaswamy et al., Reference Gopalaswamy, Royle, Hines, Singh, Jathanna, Kumar and Karanth2012; Supplementary Table 3).
Table 2 Spatially explicit capture–recapture analyses run using maximum likelihood SECR and SPACECAP for the four study areas, with density measured as number of adult individuals/100 km2 in this study and an earlier study (Sollmann et al., Reference Sollmann, Linkie, Haidir and Macdonald2014).

1 D, density (number of animals/100 km2); N, number of individuals in the sampling area; σ, range parameter for an individual animal's activity centre (i.e. the average distance of an individual animal's activity centre to the lowest probability of detection of an individual at a certain distance from a camera trap); ƛ0, expected encounter rate for any given individual whose home range centre is exactly at the camera-trap location; ѱ, predicted ratio of the number of animals actually present in the study areas compared with the maximum numbers set in the augmented data.
2 HPD, highest probability density.
Anthropogenic pressure
Camera traps recorded four independent photographs of national park rangers and field survey teams, and 137 of other people. The latter were bird poachers (68.8%), tiger and ungulate poachers (12.5%), collectors of non-timber forest products (12.5%) and fishers (1.4%; Supplementary Table 4). The highest number of camera stations recording human presence was in Ipuh (70 records, from 22 stations), followed by Bungo (35, 10), Sipurak (27, 17) and Renah Kayu Embun (5, 3). People carrying hunting rifles were photographed in Sipurak (n = 4) and Ipuh (n = 2).
Several covariates (study area, distance to forest edge and elevation) predicted human presence in the forest and were included in the top ranking models. We predicted higher occurrence of people in forests that were easier to access, i.e. those at lower elevations and closer to the forest edge, and those in the Ipuh and Sipurak study areas. The highest probability of occupancy (ѱ) of trespassers was in Ipuh with 0.43 (highest probability density 0.23–0.66), followed by Sipurak with 0.37 (0.20–0.57), Bungo with 0.19 (0.09–035) and Renah Kayu Embun with 0.09 (0.03.0.27; Table 3). The Tukey's honest significant difference test found significant differences in human disturbance between Ipuh and Bungo (P < 0.001), Ipuh and Sipurak (P = 0.014), and Ipuh and Renah Kayu Embun (P < 0.001), but not between Bungo and Sipurak (P = 0.405).
Table 3 Single season occupancy models for trespassers across the four study areas, showing occupancy (ѱ ± SE), 95% confidence intervals (CI), detection probability (P), number of parameters (K), Akaike information criterion corrected for small sample size (AICc), difference in AICc between the model and the best-performing model (ΔAICc), likelihood of a model to be selected as the best model, and model weight.

1 Model description: e.g. ѱ(river), P(.) indicates occupancy with associated covariates distance to river and detection probability constant. Covariates are: site, study area; forest, Euclidean distance to forest edge; elevation, altitude above sea level; river, Euclidean distance to river (including medium and major rivers, i.e. order 1–3 according to BAKOSURTANAL, Indonesia's Coordinating Agency for Land Mapping).
Discussion
Here we present Sunda clouded leopard density estimates for the main habitat types in the Kerinci Seblat landscape, which advances the work conducted during 2004–2009 (Sollmann et al., Reference Sollmann, Linkie, Haidir and Macdonald2014) and adds to the knowledge on this species. Our findings draw attention to the importance of Kerinci Seblat National Park and its surrounding forests, which provide critical habitat for this threatened carnivore. The protection of the forest outside the National Park falls under a different management authority and will therefore require engaging other government stakeholders (Wibisono et al., Reference Wibisono, Wahyudi, Wilianto, Pinondang, Primajati, Liswanto and Linkie2018).
Our density estimates of the Sunda clouded leopard were higher than those of the mainland clouded leopard Neofelis nebulosa in Bhutan (0.40 adult individuals/100 km2; Penjor et al., Reference Penjor, Macdonald, Wangchuk, Tandin and Tan2018), but similar to two estimates from Peninsular Malaysia (1.98–6.04 and 0.97–3.48; Mohamad et al., Reference Mohamad, Rayan, Christopher, Hamirul, Mohamed, Lau and Siwan2015), and estimates from Sabah (1.39–3.10/100 km2; Hearn et al., Reference Hearn, Ross, Bernard, Bakar, Goossens, Hunter and Macdonald2017) and central Kalimantan (0.72–4.41/100 km2; Cheyne et al., Reference Cheyne, Danika, Limin and Macdonald2013). Comparing our density estimates with the corresponding study areas surveyed by Sollmann et al. (Reference Sollmann, Linkie, Haidir and Macdonald2014), we found similarly high density estimates in Bungo and low density estimates in Ipuh. The results for Sipurak were difficult to compare because of the low number of captures: Sollmann et al. (Reference Sollmann, Linkie, Haidir and Macdonald2014) recorded two individual males and we recorded two males and one female.
There were notable differences between our study design and that used by Sollmann et al. (Reference Sollmann, Linkie, Haidir and Macdonald2014), which determined Sunda clouded leopard densities using bycatch data from tiger surveys. Sollmann et al. (Reference Sollmann, Linkie, Haidir and Macdonald2014) recorded a greater number of individual clouded leopards (n = 22) from a lower sampling effort (9,370 trap nights) over a larger area (1,243 km2), but had fewer independent photographs (n = 47). We opted for a higher trapping intensity over a smaller area (28,404 trap nights, 251 km2) to increase the number of clouded leopard records overall (n = 114), and captures of females in particular. We also had a shorter trapping period to ensure a demographically closed population. Nevertheless, both study designs had a low number of captured individuals (Table 1) and were subject to the male-biased sex ratio typical for camera-trap studies of solitary carnivores (Tobler & Powell, Reference Tobler and Powell2013; Wearn et al., Reference Wearn, Rowcliffe, Carbone, Bernard and Ewers2013). Considering these factors, we decided not to use the same parameters as Sollmann et al. (Reference Sollmann, Linkie, Haidir and Macdonald2014), who categorized study areas into two primary forest and secondary forest. Instead, we performed analyses for each study area individually.
Many felids including tigers, jaguars, leopards and clouded leopards are solitary, with a social system characterized by a dominant male protecting a territory that encompasses the home ranges of 2–3 females (Sunquist & Sunquist, Reference Sunquist and Sunquist2002; Macdonald & Loveridge, Reference Macdonald and Loveridge2014). Within these territories and ranges, boundaries are demarcated through visual signs (e.g. scrapes), scent marks (especially urine) and vocalizations. Males tend to move across greater distances than females, probably resulting in higher detection rates and biased results when sex is not included as a covariate in density models. Male-biased sex ratios are thus common in camera-trap studies of these species (Mohamad et al., Reference Mohamad, Rayan, Christopher, Hamirul, Mohamed, Lau and Siwan2015; Anile & Devillard, Reference Anile and Devillard2018).
Interpreting camera-trap data thus requires caution, and we limit comparisons of our results to those of other studies with the same inherent sex bias. Future research should explore approaches that better detect females, which would also facilitate extrapolations to estimate population size at a landscape scale (Tobler & Powell, Reference Tobler and Powell2013), and should also consider the positioning of camera traps. Although we deployed many camera stations inside presumed female home ranges, setting cameras on ridge trails may have introduced a sex bias. Female clouded leopards in a Malaysian Borneo study area tended to avoid these types of trails, possibly to reduce infanticide by unknown adult males (Wearn et al., Reference Wearn, Rowcliffe, Carbone, Bernard and Ewers2013). Setting cameras off trail would be logistically challenging in the rugged terrain of Kerinci Seblat National Park, but should be considered in future sampling designs. Future studies aiming to detect more females could also help determine whether males are at greater risk of falling victim to snare traps set along ridge trails.
Studies have shown that the size of the trapping area affects sample size and parameter estimates, with a small trapping area potentially leading to underestimated Sunda clouded leopard movements and consequently overestimating density (Mohamad et al., Reference Mohamad, Rayan, Christopher, Hamirul, Mohamed, Lau and Siwan2015; Hearn et al., Reference Hearn, Ross, Bernard, Bakar, Goossens, Hunter and Macdonald2017). The movement parameter values derived from Sipurak, Renah Kayu Embun and Bungo were consistent with those found in other studies. However, the value derived from the Ipuh data set was large and probably a consequence of individual clouded leopards being recorded by the outermost camera traps, which potentially could have been avoided by designing a larger trapping area (Fig. 3).
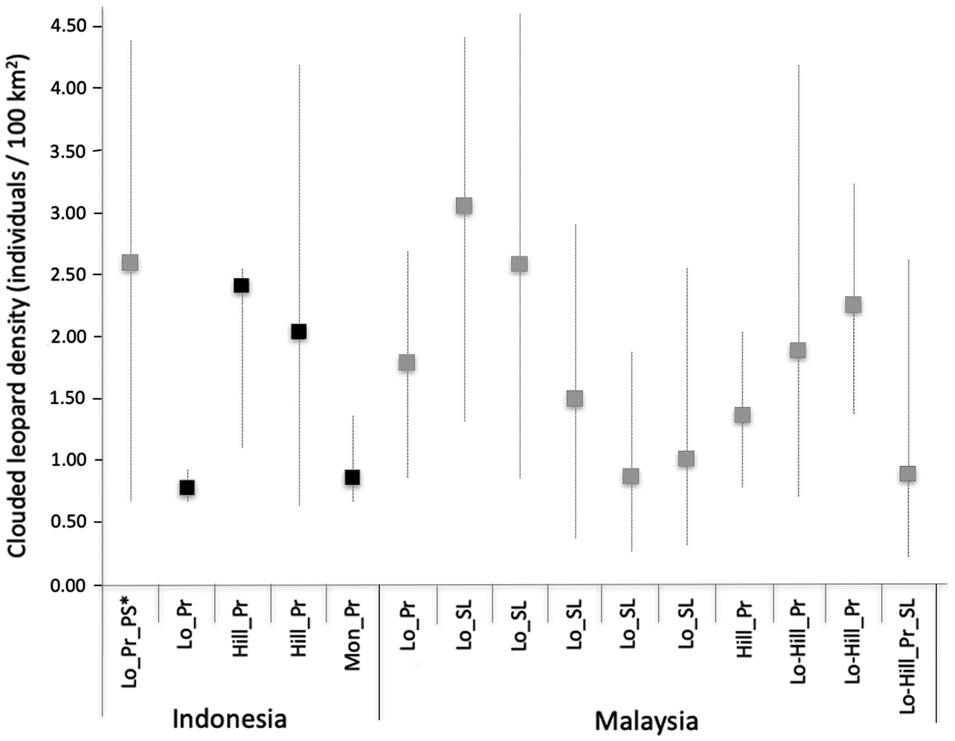
Fig. 3 Sunda clouded leopard densities across the Sunda region in Sumatra and Borneo, with results from the four study areas of this study in black, from other studies in grey. Whiskers represent density estimation ranges with minimum and maximum values. Abbreviations on the x-axis: Hill, hill forest; Lo, lowland forest; Lo-Hill, lowland to hill forest; Mon, montane and submontane forest; Pr, primary forest; PS, peat swamp; SL, selectively logged.
Poaching of felids does occur in Kerinci Seblat National Park, but discussions with the Kerinci Seblat Tiger Protection and Conservation Units, which operate across all four study areas, indicated that clouded leopards are not a target species for poachers. These Units confiscated only one clouded leopard skin and one stuffed clouded leopard during 2001–2015, indicating that clouded leopard products are not in high demand in Kerinci Seblat (KS-TPCU, 2016). Nonetheless, the species is traded internationally and there may be an increase in the range-wide illegal trade of both live individuals and their body parts over the past decades, particularly during 1975–2013 (D'Cruze & Macdonald, Reference D'Cruze and Macdonald2015).
Our study cannot conclusively prove the direct impact of human disturbance on clouded leopard subpopulations because of the influence of other explanatory factors such as prey availability and topography of the landscape. However, the clouded leopard density pattern is similar to that found for tigers in the same study area 10 years prior to our study (Linkie et al., Reference Linkie, Haidir, Nugroho and Dinata2008). Compared to Bungo and Sipurak, Ipuh is more easily accessible, has a higher occurrence of people, has experienced higher forest conversion rates at its border and has lower levels of protection (Risdianto et al., Reference Risdianto, Martyr, Nugraha, Harihar, Wibisono and Haidir2016). This suggests an impact of anthropogenic disturbance. The lowland forests of Ipuh, which should be rich in prey and therefore present ideal habitat for both tigers and clouded leopards, had lower values for both densities than the hill–submontane forests of Bungo and Sipurak (Linkie et al., Reference Linkie, Haidir, Nugroho and Dinata2008).
Based on our findings, we recommend an island-wide assessment of clouded leopard densities and populations that utilizes the large volumes of bycatch data available from tiger population surveys, as was recently done for Peninsular Malaysia (Tan et al., Reference Tan, Rocha, Clements, Brenes-Mora, Hedges and Kawanishi2017). A range-wide assessment could initiate a national dialogue on clouded leopard population status and conservation needs across Sumatran landscapes and Indonesian Borneo. It would also enable the clouded leopard to be considered by the Indonesian Ministry of Environment and Forestry for Priority Species status, thereby affording this Vulnerable felid greater conservation attention and targeted management actions.
Acknowledgements
We thank Bambang Dahono Aji (Director of Biodiversity Conservation, Indonesia Ministry of Environment and Forestry) for supporting our work in Sumatra; Arief Toengkagie (then Head of Kerinci Seblat National Park) and his staff for granting us permission to conduct this research and use the park facilities; World Animal Protection, Robertson Foundation, Rufford Foundation and Holly Reed (PDZA Conservation Fund) for funding; Panthera for providing camera-trap units; Debbie Martyr (Fauna & Flora International) and the field team (Sabirudin, Kariyanto, Yosse Hendra, Ridwan and Redhi) for collecting and processing the field data; Muhammad Lubis, Mike Meredith, Wulan Pusparini, Arjun Gopalasswamy, Soumen Dey and Jedediah Brodie for feedback on the manuscript.
Author contributions
Study design, data collection and analysis, writing: IAH; conception and direction of the wider project of which this study is a part, supervision, writing: DWM; assistance with study design, data analysis, writing: ML.
Conflict of interest
None.
Ethical standards
This study abided by the Oryx guidelines on ethical standards and did not involve human subjects and/or any animal experiments or collection of specimens.


 Open access