


Introduction
Many urbanised peat-rich coastal-deltaic plains are subsiding due to compression and oxidation of surficial Holocene peat layers (Camporese et al., Reference Camporese, Gambolati, Putti, Teatini and Martini2006; Gambolati et al., Reference Gambolati, Putti, Teatini and Gasparetto Stori2006; Serva & Brunamonte, Reference Serva and Brunamonte2007; Drexler et al., Reference Drexler, De Fontain and Deverel2009; Deverel et al., Reference Deverel, Ingrum and Leighton2016). This results in relative sea-level rise, increasing flood risk, salt water intrusion and damage to infrastructures (e.g. Higgins, Reference Higgins2016; Zoccarato et al., Reference Zoccarato, Minderhoud and Teatini2018). This form of subsidence is often human-induced, and is a consequence of phreatic groundwater level lowering and increased surface loading.
The heavily urbanised coastal-deltaic plain of the Netherlands is a prime example of an area affected by subsidence associated with near-surface peat occurrences. Here, peat compression and oxidation, as well as past peat mining, caused c.50% of the surface area of the Holocene coastal-deltaic plain to be presently situated below mean sea level (MSL) (Fig. 1) (TNO-GSN, 2016). Large-scale subsidence commenced around AD 1000, when vast wetlands in the western part of the coastal-deltaic plain were reclaimed for agriculture (Van Dam, Reference Van Dam2001). As a consequence of the resulting subsidence, frequent river flooding and sea ingressions affected this area for centuries, causing further land loss (Pierik et al., Reference Pierik, Cohen, Vos, Van der Spek and Stouthamer2017). To date, subsidence by peat compression and oxidation still continues, as phreatic groundwater levels are progressively lowered to prevent agricultural lands and urbanised areas from inundating (Van den Born et al., Reference Van den Born, Kragt, Henkens, Rijken, Van Bemmel and Van der Sluis2016). Despite the severe volumetric loss, over 15km3 of Holocene peat remains embedded in the subsurface (TNO-GSN, 2016). Consequently, the subsidence potential of the coastal-deltaic plain of the Netherlands remains high (Hoogland et al., Reference Hoogland, Van den Akker and Brus2012; Van den Born et al., Reference Van den Born, Kragt, Henkens, Rijken, Van Bemmel and Van der Sluis2016).
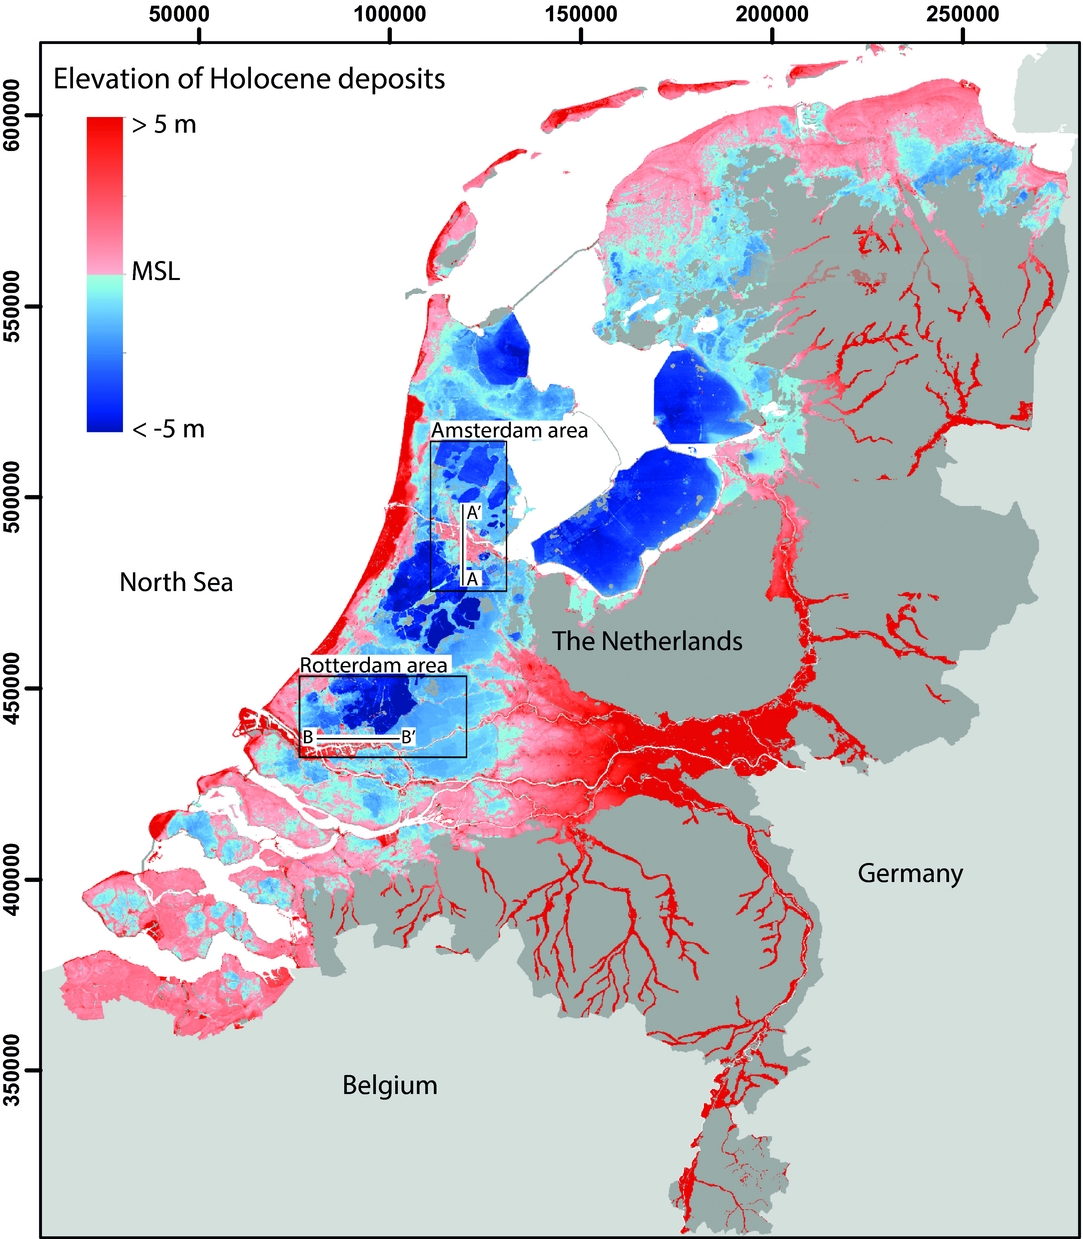
Fig. 1. Surface elevation of the area with Holocene coastal-deltaic surface deposits in the Netherlands. Approximately 50% of this area is situated below MSL, primarily caused by peat compression, oxidation and past peat mining. The x- and y-axes show coordinates of the national Dutch coordinate system (Rijksdriehoek) in km.
Due to differences in the geological build-up of the Holocene sequence, past peat mining activities, and drainage history, the volume of the remaining peat is not equally distributed throughout the subsurface. As a result, local to regional variations exist in the subsidence potential of the coastal-deltaic plain during future phreatic groundwater level lowering (Nieuwenhuis & Schokking, Reference Nieuwenhuis and Schokking1997; Van der Meulen et al., Reference Van der Meulen, Van der Spek, De Lange, Gruijters, Van Gessel, Nguyen, Maljers, Schokker, Mulder and Van der Krogt2007; Van Hardeveld et al., Reference Van Hardeveld, Driessen, Schot and Wassen2017; Koster et al., Reference Koster, Stafleu, Cohen, Stouthamer, Busschers and Middelkoop2018a). Identification of areas most vulnerable to subsidence is essential for scientists, stakeholders and policymakers to design strategies to mitigate and adapt to subsidence, and eventually to sustain the viability of the coastal-deltaic plain of the Netherlands. This requires assessment of the spatial differences in the subsidence potential of the remaining peat beds in response to near-future phreatic groundwater level lowering.
To investigate spatial variations in subsidence potential, detailed subsurface models that describe lateral and vertical extensions of peat beds with their physical properties are a prerequisite (e.g. Fokker et al., Reference Fokker, Gunnink, De Lange, Leeuwenburgh and Van der Veer2015). The Geological Survey of the Netherlands (TNO-GSN) is developing GeoTOP, a high-resolution (100×100×0.5m) 3D geological subsurface voxel-model that presently covers most of the Holocene coastal-deltaic plain of the Netherlands (Stafleu et al., Reference Stafleu, Maljers, Gunnink, Menkovic and Busschers2011; Van der Meulen et al., Reference Van der Meulen, Doornebal, Gunnink, Stafleu, Schokker, Vernes, Van Geer, Van Gessel, Van Heteren, Van Leeuwen, Bakker, Bogaard, Busschers, Griffioen, Gruijters, Kiden, Schroot, Simmelink, Van Berkel, Van der Krogt, Westerhoff and Van Daalen2013). In GeoTOP, the lateral and vertical distribution of Holocene peat is incorporated. Furthermore, workflows have been developed to populate the voxels that are assigned as Holocene peat with void ratio, a property that influences the compression potential of a peat bed.
In this study, we aim to quantitatively evaluate spatial variations in the subsidence potential of the heavily urbanised peat-rich coastal deltaic plain of the Netherlands. The subsidence potential is quantified as the thickness reduction of GeoTOP voxels assigned as Holocene peat for four scenarios of phreatic groundwater level lowering. We focused on two study areas situated in the western part of the coastal-deltaic plain. They comprise the major cities of Amsterdam, Rotterdam and their surrounding agricultural land (Fig. 1). By focusing on both urban and agricultural areas, insights were obtained into the effects of these dominant land-use types on subsidence potential.
Geological setting and study area
In the coastal-deltaic plain of the Netherlands, regional-scale peat formation began as a result of the drowning of this area due to relative sea-level rise (Fig. 2) (Van de Plassche, Reference Van de Plassche1982). The peat formed during this early stage occurs at the base of the Holocene coastal sequence, and in this stratigraphical position it is referred to as basal peat. Basal peat began to form c.9500 cal year BP in the lowest areas at c.25m below mean sea level (MSL), and by c.6000 cal year BP it had proceeded into the inland coastal plain at c.−3m MSL, decimetres to a few metres above contemporary sea level.
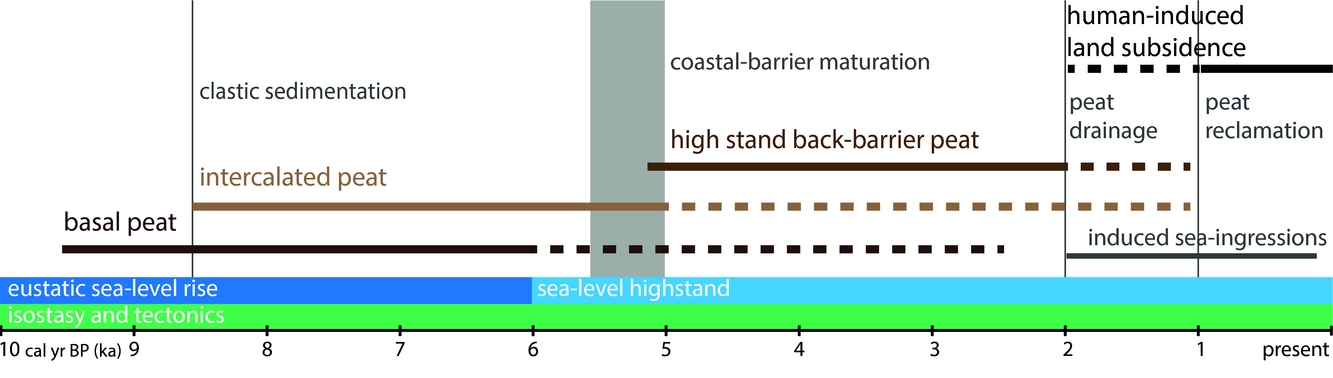
Fig. 2. Schematic overview of Holocene processes in the coastal-deltaic plain of the Netherlands: peat formation, sea-level rise, beach-barrier maturation, human-induced land subsidence, and associated sea ingressions. The striped lines indicate a decrease in the contribution of the processes. Natural build-up of the area lasted for c.9000 years, and human-induced degradation for c.1000 years, indicating the relatively short period in which humans affected the coastal-deltaic plain.
Between 8500 and 6000 cal year BP a marine transgression succeeded basal peat formation (Fig. 2) (Hijma et al., Reference Hijma, Cohen, Hoffmann, Van der Spek and Stouthamer2009). Clastic tidal depositional environments covered the drowning peat swamps in the west of the coastal plain. In the inland part of the coastal-deltaic plain, peat formation in swamps and fens continued. Due to repeated avulsion of river and tidal channels, sediment supply to the floodbasins shifted over time, resulting in sequences of intercalated peat and overbank clastic layers. In the distal and northern parts of the coastal plain, tidal-clay intercalated peat formed until about 5500 cal year BP (Hijma et al., Reference Hijma, Cohen, Hoffmann, Van der Spek and Stouthamer2009).
Eustatic sea-level rise decreased around 6000 cal year BP and a coastal-barrier complex matured. This limited the amounts of clastic sediment that reached the lower coastal plain. As tectonic and glacio-isostatic subsidence remained significant components of relative sea- and groundwater level rise at rates of decimetres per thousand years, this kept providing accommodation space and stimulated widespread peat formation in the back-barrier area for millennia (Vos, Reference Vos2015). There, extensive and thick peat beds began to develop.
Amsterdam and Rotterdam
The cities of Amsterdam and Rotterdam were founded in the back-barrier wetlands around AD 1250. Amsterdam was founded at the location where the Amstel peat brook debouched into a tidal system, and Rotterdam at the confluence of the Rotte peat brook and the meandering Meuse river (Vos, Reference Vos2015). The toponyms of both cities reflect the damming of the peat brooks to prevent the reclaimed and subsided hinterlands from flooding (Pons & Van Oosten, Reference Pons and Van Oosten1974). This testifies to the centuries-long struggle of these areas with inundations, as a consequence of the subsidence of the former back-barrier wetlands.
The pre-Holocene substrate in the Rotterdam area occurs at a greater depth than in Amsterdam, as it comprises a palaeovalley formed by Pleistocene braided rivers (Fig. 3). Consequently, the accumulated thickness of Holocene sediments and peat in the Rotterdam area (15–20m) exceeds that of Amsterdam (c.12–18m). The Holocene sequence in both areas commences with basal peat, overlain by tidal basin deposits, and a back-barrier peat layer. The Holocene subsurface of Rotterdam deviates from Amsterdam by the presence of Rhine and Meuse fluvial deposits interfingering with the tidal basin deposits. Clay overlying the back-barrier peat resulting from the subsidence-induced inundations derives in the Amsterdam area primarily from sea ingressions and the Amstel brook, and in the Rotterdam area from sea ingressions and river floods.
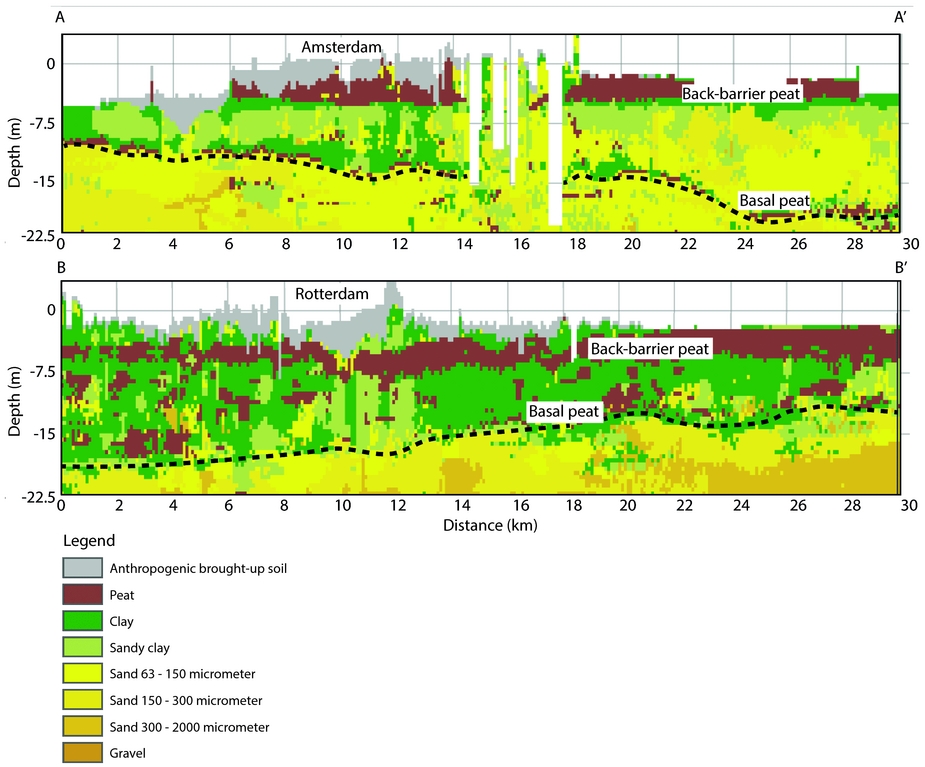
Fig. 3. Lithological cross-sections of the Holocene subsurface of (A) Amsterdam, (B) Rotterdam, and their surrounding agricultural lands, extracted from GeoTOP (TNO-GSN, 2016). For locations see Figure 1. The black dotted lines indicate the boundary between the Pleistocene substrate and the Holocene coastal-deltaic deposits. Basal peat directly overlies Pleistocene deposits, and back-barrier peat is situated near the present surface.
To enable expansion of the urban areas of both cities, anthropogenic soil was brought up on the existing land surface to increase the bearing capacity of the underlying peat (Kluiving et al., Reference Kluiving, De Ridder, Van Dasselaar, Roozen and Prins2016; Koster, Reference Koster2016) (Fig. 4). The burden of this material caused substantial compression of underlying peat at that time.
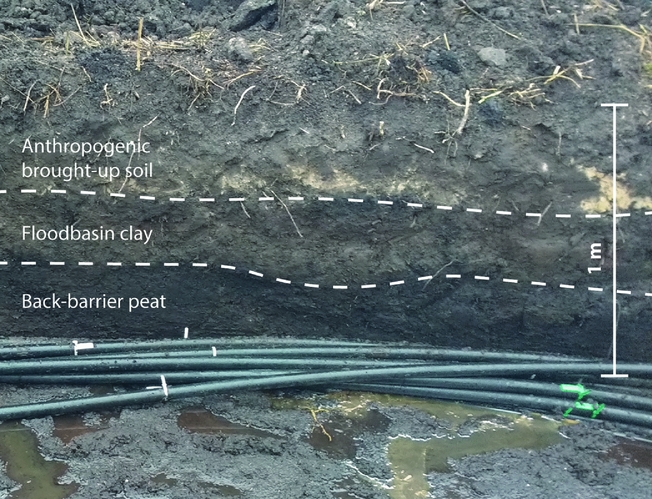
Fig. 4. An exposure of the shallow subsurface of Amsterdam near the Amstel brook: back-barrier peat is overlain by floodbasin clay from the Amstel peat-brook. The floodbasin clay was deposited after the back-barrier peat subsided by phreatic groundwater level lowering. Anthropogenic soil was subsequently brought up to increase the bearing capacity of the area. The present-day phreatic groundwater level equals the bottom of the excavation pit (photo: Kay Koster).
Methods
The amount of subsidence by peat compression and oxidation was determined by quantifying the thickness reduction of voxels in GeoTOP that are classified as Holocene peat (Fig. 5). The thickness reduction was determined as the amount of compression and oxidation for four scenarios (Table 1). The upper limit of 0.5m was selected as it represents a maximum value of recent (post-World War II) periodic groundwater level lowering recorded in polder systems in the Netherlands (Schothorst, Reference Schothorst1977; TNO-GSN, 2016), whereas a period of 30 years is regarded as the maximum time necessary to complete primary compression (CUR, 1992). Thus, the selected scenarios represent a plausible maximum, and three intermediate subsidence potentials for near-future phreatic groundwater level lowering.
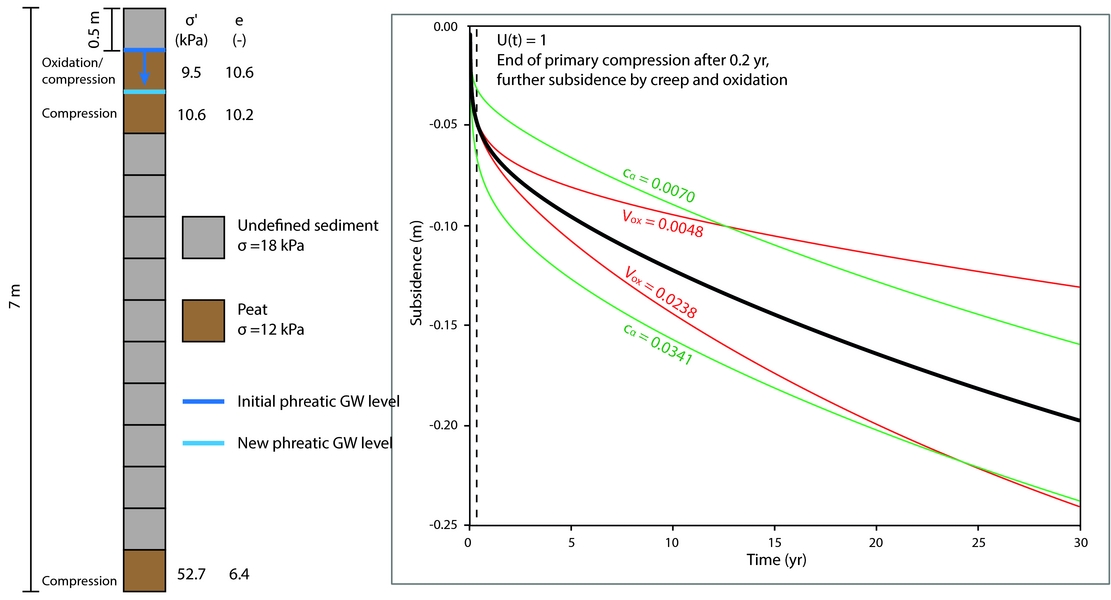
Fig. 5. Schematic representation of the maximum subsidence of a hypothetical vertical voxel-stack after phreatic groundwater level lowering (scenario 1; phreatic groundwater level lowering of 0.5m during 30 years). The peat-voxels are attributed with vertical effective stress, determining vertical variation in void ratio and compression behaviour. The top peat-voxel is situated above the lowered phreatic groundwater level and is therefore subjected to oxidation. The black line in the right-hand panel shows: (1) subsidence over time, and (2) the outcome of the analysis with minimum and maximum values of Vox (red lines) and Cα (green lines).
Table 1. Overview of the four phreatic groundwater level lowering scenarios.

This study focused on 3D subsections of GeoTOP comprising the Holocene subsoil of the cities of Amsterdam, Rotterdam and their surrounding agricultural areas. A python-scripted workflow was established to (1) select each voxel assigned as Holocene peat within the subsections, (2) populate them with voxel-specific vertical effective stress and void ratio, which are parameters necessary to calculate compression, (3) implement elevations of present and lowered phreatic groundwater levels within the selected subsections, (4) calculate the thickness reduction of each selected voxel after the phreatic groundwater lowering, by using widely applied compression and oxidation functions, and (5) sum the total thickness reduction in the voxel stack per x, y coordinate to produce 2D subsidence maps.
Peat compression
Peat compression was calculated using the internationally widely applied ‘Bjerrum function’ for soft soil compression (CUR, 1992). The function (eqn 1) calculates a compression ε com from variables that describe primary and secondary compression (CUR, 1992). Primary compression is the thickness reduction of peat due to increasing vertical effective stress (σ’ v), whereas secondary compression comprises time-dependent creep.
The rate at which pore water expulses from peat during vertical effective stress increase determines the duration of primary compression. This duration is indicated by the degree of consolidation (U (t)) (eqn 2). The degree of consolidation is determined by the vertical permeability (k v) of peat, which is derived from its void ratio (e) (cf. Mesri & Ajlouni, Reference Mesri and Ajlouni2007). For Holocene peat embedded in the subsurface of the Netherlands, vertical permeability was empirically derived from a void ratio – permeability dataset previously acquired from a database of TNO-GSN (Koster, Reference Koster2017) (eqn 5).
Primary and secondary compression occur simultaneously, but, after primary compression has ended, only creep processes of secondary compression will cause further land subsidence (Zhang et al., Reference Zhang, Huang, Yilin, Liu and Haibo2018). The rate of creep is determined by the coefficient of secondary compression (Cα). In this study, a standard coefficient of secondary compression value was used for Holocene peat in the Netherlands (Blok, Reference Blok2014), as no empirical relations between peat field conditions and creep intensities have been established yet (CUR, 1992).
 $$\begin{eqnarray}
{\varepsilon _{{\rm{com}}}} = \frac{{\Delta {h_{\rm{p}}}}}{{{h_{\rm{p}}}}} &=& \left[ \frac{{{C_c}}}{{\left( {1\ + \ {e_0}} \right)}}\ \; \cdot \;\ {U_{\left( t \right)}}\; \cdot \;{\rm{log}}\left( {\frac{{\sigma {'_{\rm{v}}} + \ \Delta \sigma {'_{\rm{v}}}}}{{\sigma {'_{\rm{v}}}}}} \right)\right.\nonumber\\
&& \left.+\; {C_\alpha }\;\log \;\left( {\frac{{{t_0} + \ \Delta t}}{{{t_0}}}\ } \right) \right]
\end{eqnarray}$$
$$\begin{eqnarray}
{\varepsilon _{{\rm{com}}}} = \frac{{\Delta {h_{\rm{p}}}}}{{{h_{\rm{p}}}}} &=& \left[ \frac{{{C_c}}}{{\left( {1\ + \ {e_0}} \right)}}\ \; \cdot \;\ {U_{\left( t \right)}}\; \cdot \;{\rm{log}}\left( {\frac{{\sigma {'_{\rm{v}}} + \ \Delta \sigma {'_{\rm{v}}}}}{{\sigma {'_{\rm{v}}}}}} \right)\right.\nonumber\\
&& \left.+\; {C_\alpha }\;\log \;\left( {\frac{{{t_0} + \ \Delta t}}{{{t_0}}}\ } \right) \right]
\end{eqnarray}$$
 $$\begin{equation}
{U_{\left( t \right)}} = \ \sqrt[6]{{\frac{{{T^3}}}{{\left( {{T^3}\ + \ 0.5} \right)}}}}\vspace*{-5pt}
\end{equation}$$
$$\begin{equation}
{U_{\left( t \right)}} = \ \sqrt[6]{{\frac{{{T^3}}}{{\left( {{T^3}\ + \ 0.5} \right)}}}}\vspace*{-5pt}
\end{equation}$$
 $$\begin{equation}
T = \ \frac{{{c_v}\ \cdot \ \Delta t}}{{{{\left( {\beta \ \cdot \ {h_{\rm{p}}}} \right)}^2}}}\vspace*{-5pt}
\end{equation}$$
$$\begin{equation}
T = \ \frac{{{c_v}\ \cdot \ \Delta t}}{{{{\left( {\beta \ \cdot \ {h_{\rm{p}}}} \right)}^2}}}\vspace*{-5pt}
\end{equation}$$
 $$\begin{equation}
{c_{v\ }} = \ \frac{{{k_{\rm{v}}}}}{{{m_{\rm{v}}}\ \cdot \ {\gamma _w}}}
\end{equation}$$
$$\begin{equation}
{c_{v\ }} = \ \frac{{{k_{\rm{v}}}}}{{{m_{\rm{v}}}\ \cdot \ {\gamma _w}}}
\end{equation}$$
 $$\begin{equation}
{k_{{\rm{v}}\ }} = \ 1 \cdot {10^{ - 11}}\ \cdot \ {e_0}^{2.98}
\end{equation}$$
$$\begin{equation}
{k_{{\rm{v}}\ }} = \ 1 \cdot {10^{ - 11}}\ \cdot \ {e_0}^{2.98}
\end{equation}$$
 $$\begin{equation}
{m_{{\rm{v}}\ }} = \ \frac{{\Delta e}}{{(1\ + \ {e_0})\ \cdot \ \Delta \sigma {'_{\rm{v}}}}}
\end{equation}$$
$$\begin{equation}
{m_{{\rm{v}}\ }} = \ \frac{{\Delta e}}{{(1\ + \ {e_0})\ \cdot \ \Delta \sigma {'_{\rm{v}}}}}
\end{equation}$$
ε com = compression (–)
h p = peat thickness (m)
Δh p = decrease in peat thickness (m)
Cc = compression index; 5.8 (–) (Koster et al., Reference Koster, De Lange, Harting, De Heer and Middelkoop2018b)
U (t ) = degree of consolidation (–)
Δσʹ v = increase in vertical effective stress (kPa)
Cα = coefficient of secondary compression; 0.0153 (–)
t 0 = reference time (s)
Δt = increase in time (s)
T = time factor (–)
cv = coefficient of consolidation (m2s−1)
k v = vertical permeability (ms−1) (Koster, Reference Koster2017)
β = drainage constant; 1 (–)
m v = coefficient of volume compressibility (kPa−1)
γ w = unit weight of water; 9.81kNm−3
Prime input variable for this function is vertical effective stress and increases herein. Changes in vertical effective stress change the void ratio of peat, which is the ratio between volumes of the non-solid and solid components. A reduction in void ratio of subsurface peat layers is reflected at the surface as subsidence. For peat embedded in the Holocene sequence of the Netherlands, an empirical relation between vertical effective stress and void ratio was used, based on a vertical effective stress – void ratio dataset acquired from a database of TNO-GSN (eqn 7; Koster et al., Reference Koster, De Lange, Harting, De Heer and Middelkoop2018b).
 $$\begin{equation}
e & =& 25.1\ \sigma {'_{\rm{v}}}^{ - 0.413}\\
\end{equation}$$
$$\begin{equation}
e & =& 25.1\ \sigma {'_{\rm{v}}}^{ - 0.413}\\
\end{equation}$$
 $$\begin{equation}
\sigma {'_{\rm{v}}} & =& \ {\sigma _{\rm{v}}} - \ \mu \\
\end{equation}$$
$$\begin{equation}
\sigma {'_{\rm{v}}} & =& \ {\sigma _{\rm{v}}} - \ \mu \\
\end{equation}$$
 $$\begin{equation}
\mu & =& \left( {{h_{{\rm{ph\ gw}}}} - \ {h_{{\rm{voxel}}}}} \right) \cdot {\gamma _{\rm{w}}}
\end{equation}$$
$$\begin{equation}
\mu & =& \left( {{h_{{\rm{ph\ gw}}}} - \ {h_{{\rm{voxel}}}}} \right) \cdot {\gamma _{\rm{w}}}
\end{equation}$$
e = void ratio (–)
σʹ v = vertical effective stress (kPa)
σ v = total stress (kPa)
μ = hydrostatic pressure (kPa)
h ph gw = z-coordinate of phreatic groundwater level (m)
h voxel = z-coordinate of the centre of a peat voxel (m)
Eqns 7–9 were used to populate the GeoTOP voxels containing peat with estimated current void ratio, depending on effective stress experienced by the overburden. The void ratio of the selected voxels was calculated using eqn 7. Vertical effective stress was quantified following Terzhagi's principles of soil mechanics as the difference between total vertical stress (σ v) and hydrostatic pressure (μ) (eqn 8). The total vertical stress per selected voxel was determined by summing lithology-specific total stress values of the overlying voxels. These total stress values comprised previously determined values typical for Holocene deposits per m sediment thickness in the Netherlands: peat, 11kPa; clay, 14kPa; sandy clay, 16kPa; sand, 20kPa; and brought-up soil, 18kPa (cf. Kruiver et al., Reference Kruiver, Van Dedem, Romin, De Lange, Korff, Stafleu, Gunnink, Rodriguez-Marek, Bommer, Van Elk and Doornhof2017). The hydrostatic pressure was determined per voxel by subtracting the z-coordinate of the centre of the voxel from that of the phreatic groundwater level (eqn 9). The phreatic groundwater levels were obtained from an online portal for hydrological data of the Netherlands (NHI, 2016).
Changes in total vertical stress and vertical effective stress after phreatic groundwater level lowering depend on the phreatic storage of surficial deposits (e.g. Zanello et al., Reference Zanello, Teatini, Putti and Gambolati2011). Within a peat layer, the phreatic storage coefficient is very variable in both lateral and vertical directions, as it depends on the degree of decomposition and void ratio. It can range between 0.8 and 0.5 for freshly formed peat, to values between >0 and 0.1 for buried peat layers (Bot, Reference Bot2016). Here, we used a widely applied averaged phreatic storage coefficient for near-surface peat layers in the Netherlands of 0.1, to determine the changes in total vertical stress and vertical effective stress after phreatic groundwater level lowering (eqns 11 and 12) (Bot, Reference Bot2016).
 $$\begin{equation}
{\rm{\Delta }}{\sigma _{\rm{v}}} & =& \ {\rm{\Delta }}{h_{{\rm{ph\ gw}}}}\ \cdot \ \;S\;\ \cdot \;\ {\gamma _{\rm{w}}}\\
\end{equation}$$
$$\begin{equation}
{\rm{\Delta }}{\sigma _{\rm{v}}} & =& \ {\rm{\Delta }}{h_{{\rm{ph\ gw}}}}\ \cdot \ \;S\;\ \cdot \;\ {\gamma _{\rm{w}}}\\
\end{equation}$$
 $$\begin{equation}
{\rm{\Delta }}\sigma {'_{\rm{v}}} & =& \left( { - S + 1} \right)\ {\rm{\Delta }}{h_{{\rm{ph\ gw}}}}\ \cdot \ {\gamma _{\rm{w}}}
\end{equation}$$
$$\begin{equation}
{\rm{\Delta }}\sigma {'_{\rm{v}}} & =& \left( { - S + 1} \right)\ {\rm{\Delta }}{h_{{\rm{ph\ gw}}}}\ \cdot \ {\gamma _{\rm{w}}}
\end{equation}$$
Δσ v = changes in total vertical stress
S = phreatic storage coefficient; 0.1 (–)
with S = φ − φw, where φ is the saturated porous medium porosity and φw is the moisture content (in % of the total porous medium volume) above the phreatic surface.
Peat oxidation
The thickness reduction of the peat voxels by oxidation was only calculated for those parts of the voxels that were situated above the lowered phreatic groundwater level. A generally tested and applied function was used to quantify peat thickness reduction due to oxidation ε ox over time (eqn 12) (Van der Meulen et al., Reference Van der Meulen, Van der Spek, De Lange, Gruijters, Van Gessel, Nguyen, Maljers, Schokker, Mulder and Van der Krogt2007; Van Hardeveld et al., Reference Van Hardeveld, Driessen, Schot and Wassen2017). The rate of oxidation (V ox) is a value relative to the thickness of the layer above the groundwater level, and was set at 0.015mm−1a−1, which is a typical value for Holocene peat in the Netherlands (cf. Van der Meulen et al., Reference Van der Meulen, Van der Spek, De Lange, Gruijters, Van Gessel, Nguyen, Maljers, Schokker, Mulder and Van der Krogt2007).
 $$\begin{equation}
{\varepsilon _{{\rm{ox}}}} = \ \frac{{{\rm{\Delta }}{h_{{\rm{p\ dry}}}}}}{{{h_{{\rm{p\ dry}}}}}} = \left[ {1 - \ {\rm{ex}}{{\rm{p}}^{\left( { - {V_{{\rm{ox}}}}\ \cdot \ \Delta t} \right)}}} \right]
\end{equation}$$
$$\begin{equation}
{\varepsilon _{{\rm{ox}}}} = \ \frac{{{\rm{\Delta }}{h_{{\rm{p\ dry}}}}}}{{{h_{{\rm{p\ dry}}}}}} = \left[ {1 - \ {\rm{ex}}{{\rm{p}}^{\left( { - {V_{{\rm{ox}}}}\ \cdot \ \Delta t} \right)}}} \right]
\end{equation}$$
ε ox = relative height reduction due to oxidation (–)
h p dry = peat organic matter thickness above phreatic water level (m)
Δh p dry = decrease in peat organic matter thickness above phreatic water level (m)
V ox = rate of oxidation; 0.015 (mm−1a−1)
Subsidence was calculated for time steps of 0.01 year, during which the thickness reduction of each selected peat voxel was calculated (Fig. 5). For oxidation, the thickness reduction during each time step was used to adapt h p dry in eqn 11 to calculate oxidation in the next time step. Thickness reduction due to compression was determined for an instantaneous lowering of the phreatic groundwater level. Per time step, the decrease in the peat thickness situated above the new phreatic groundwater level by compression of deeper-situated selected voxels was determined, and subtracted from the amount of organic matter subjected to oxidation in the consecutive time step.
Results
Future subsidence estimates
Figures 6 and 7 show the spatial patterns in subsurface lithology, peat thickness and subsidence resulting from peat compression and oxidation for the four scenarios in the Amsterdam and Rotterdam areas. Compression, oxidation and cumulative subsidence are given separately. The modelling results are summarised in Table 2. The general trend reveals that agricultural areas are more prone to subsidence by phreatic groundwater level lowering than urban areas.
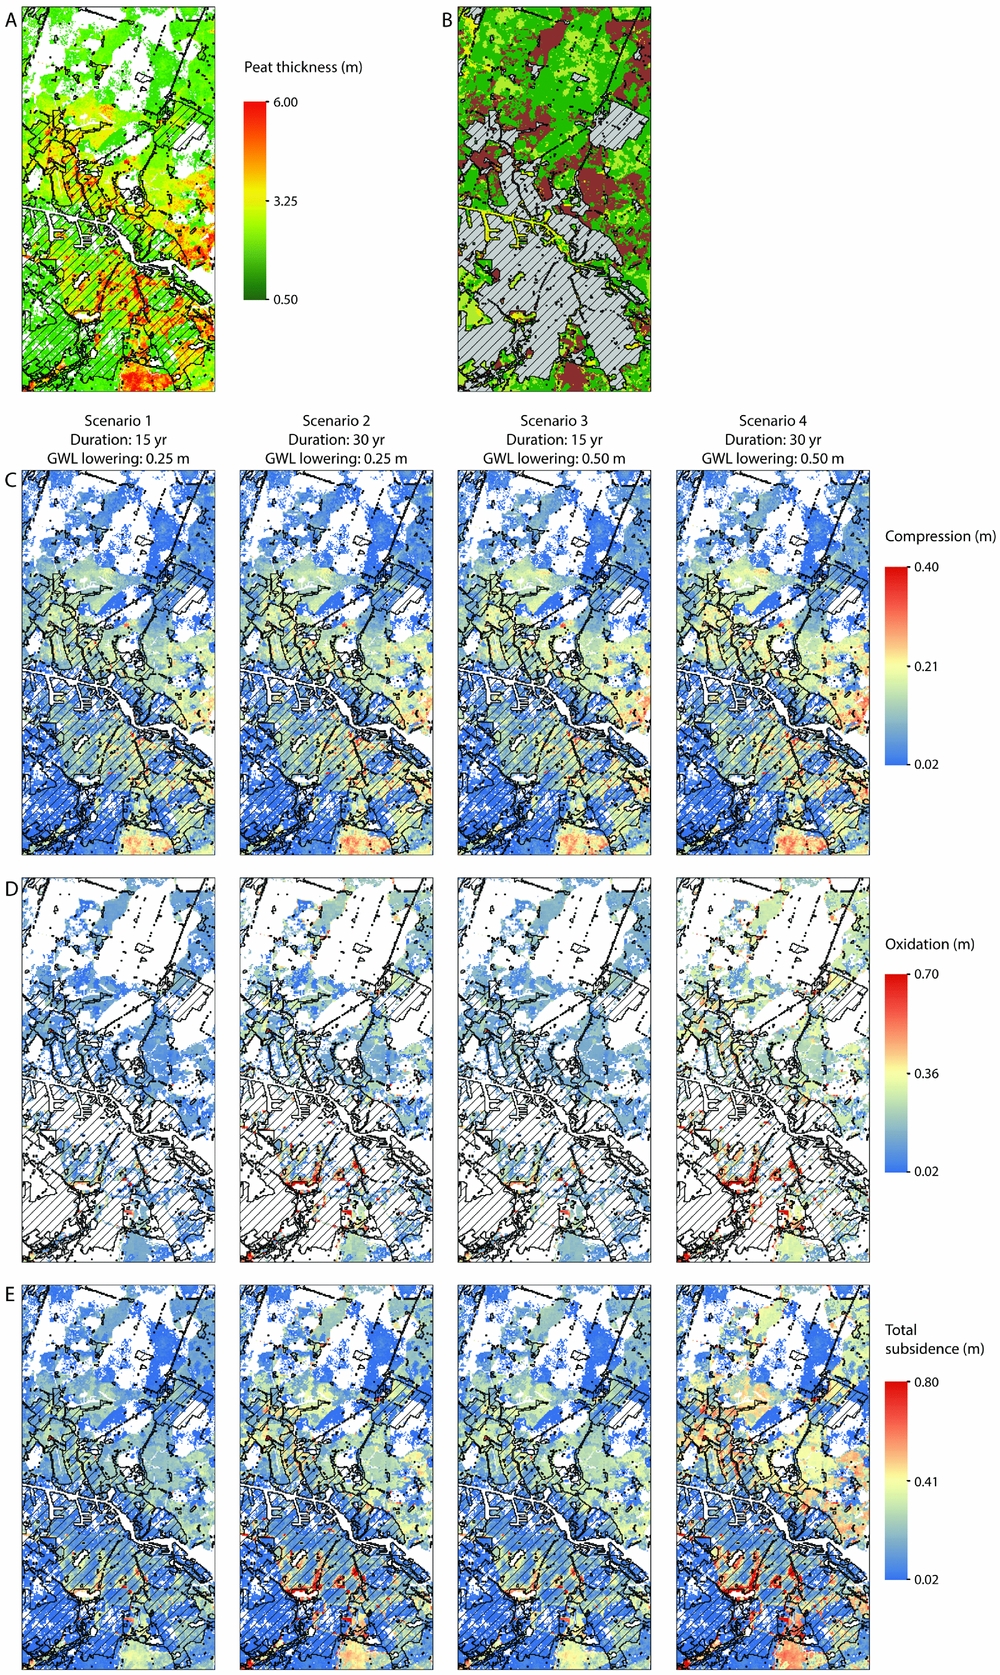
Fig. 6. Subsurface lithology and subsidence by peat compression and oxidation for four different scenarios of phreatic groundwater level lowering (GWL lowering) and duration of subsidence in the Amsterdam area. The scenarios are: (1) 0.25m GWL lowering during 15 years, (2) 0.25m GWL lowering during 30 years, (3) 0.50m GWL lowering during 15 years, and (4) 0.50m GWL lowering during 30 years. The hatched areas indicate urban zones. For location within the Netherlands, see Figure 1.
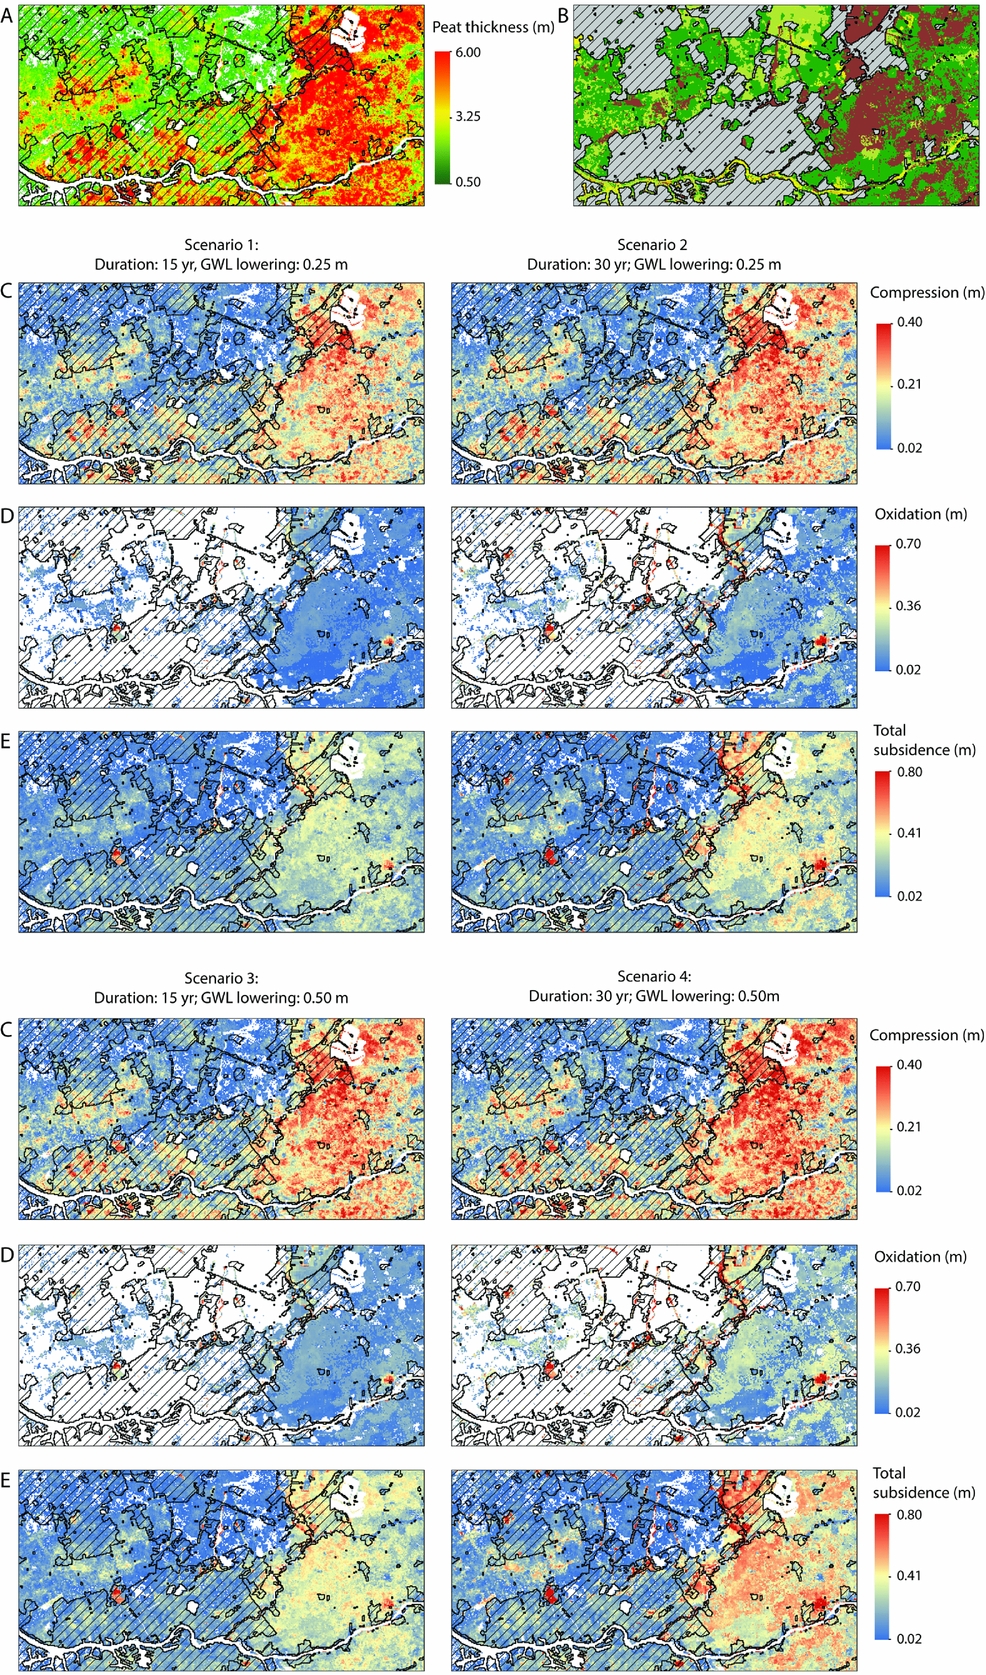
Fig. 7. Subsurface lithology and subsidence for the four different subsidence scenarios in the Rotterdam area. The hatched areas indicate urban zones. For location within the Netherlands, see Figure 1.
Table 2. Summarised results of the four phreatic groundwater-level lowering scenarios.

Amsterdam
The Amsterdam area comprises thick (3–6m) and thin (>1m) peat beds (Fig. 6A). The areas with thickest peat reflect relatively well-preserved surficial back-barrier peat layers, whereas thin peat beds occur in former mining areas. Below the urbanised zone of Amsterdam and in the agricultural area north of the city, the back-barrier peat is the thickest and most abundant. In the agricultural areas, north and south of Amsterdam, the back-barrier peat is directly situated at the surface (Fig. 6B).
Subsidence by compression in the four scenarios is most severe in the agricultural areas directly north-northeast and southeast of Amsterdam, with subsidence ranging between 0.2 and 0.4m (Fig. 6C). The peat layers in these areas have relatively high void ratios due to their near-surface position, and hence high compressibility. The difference in subsidence by compression for the four scenarios is only a few centimetres (Table 2), despite differences in vertical effective stress increases and duration of creep. In the former peat reclamation areas, subsidence by compression is limited to less than 0.05m. These low values are due to the absence of compressible near-surface back-barrier peat, and subsidence is here primarily caused by compression of tidal basin- and basal peat layers at several metres depth in the subsurface. Because of their deeper position, these peat layers have a lower void ratio and are therefore less compressible than the surficial peat. In spite of the large thickness of the peat beds underlying Amsterdam, subsidence by compression is less than 0.3m, except for an area in the eastern part of the city. In the eastern part compression is up to 0.4m, similar to the agricultural areas, because in that area overburden is relatively thin (0.5–1m).
The results of subsidence by oxidation show that this process is limited to areas where peat is situated near the surface (Fig. 6B and D). These areas primarily comprise agricultural lands and patches in the south and east of Amsterdam. The mean subsidence by oxidation deviates more than 0.1m between the scenarios (Table 2). This indicates that oxidation contributes more to subsidence than creep (both are time-dependent).
The total subsidence for this area reveals that the agricultural regions north and southeast of Amsterdam have the highest subsidence potential when phreatic groundwater levels are lowered, with subsidence amounts between 0.5 and 0.8m (Fig. 6E). Nevertheless, the highest subsidence potential occurs in a narrow local peat rim in the southern part of Amsterdam, which primarily subsides due to oxidation. The difference between subsidence in the urban and agricultural areas is caused by the presence of several metres of anthropogenic brought-up soil overlying the back-barrier peat in Amsterdam. This has already reduced the void ratio and hence compressibility of the peat underlying the city in the past centuries. Furthermore, the brought-up soil pushed the peat below phreatic groundwater levels, minimising oxidisation.
Rotterdam
In the Rotterdam area, the total thickness of Holocene peat ranges between 1 and 6m (Fig. 7A). In the agricultural area east of Rotterdam, peat is the thickest, with values up to 6m. Here, peat is back-barrier peat, and is largely directly situated at the surface. In the agricultural area north of Rotterdam, this back-barrier peat is covered by flood deposits (Fig. 7B). The summarised results in Table 2 show that in Rotterdam subsidence by compression is higher, and subsidence by oxidation is lower, than in the Amsterdam area.
The agricultural area east of Rotterdam is most affected by compression. There, subsidence ranges between 0.2 and 0.4m (Fig. 7C). Compression also affects peat underlying Rotterdam. However, because of anthropogenic overburden the void ratio of peat is relatively low, and therefore compression is moderate (<0.1 to 0.4m). The compression of the peat underlying Gouda is more severe, with values between 0.3 and 0.4m.
Because of the surficial position of peat east of Rotterdam, it is most affected by oxidation. Similar to Amsterdam, the peat underlying the urbanised area of Rotterdam is less subjected to oxidation. Oxidation only occurs along the eastern and northern boundaries of the city (Fig. 7D). This is also due to the protection of peat by anthropogenic brought-up soil. This protection does not account for the smaller city of Gouda. There, approximately half of the surface area of the city is subjected to oxidation.
The total subsidence (Fig. 7E) shows large differences between the agricultural area east of Rotterdam, the city of Rotterdam, and the agricultural area north of the city. In the area east of Rotterdam, including the city of Gouda, total subsidence is between 0.4 and 0.8m. In the agricultural area north of Rotterdam, subsidence is low, with values <0.4m. In Rotterdam, total subsidence ranges between 0.1 and 0.4m.
Model sensitivity analysis
The rate of oxidation (V ox) of 0.015 (mm−1a−1), and the coefficient of secondary compression (Cα) of 0.0153 (–) used here, derive from previously published values of Holocene peat in the Netherlands (Van der Meulen et al., Reference Van der Meulen, Van der Spek, De Lange, Gruijters, Van Gessel, Nguyen, Maljers, Schokker, Mulder and Van der Krogt2007; De Lange et al., Reference De Lange, Gunnink, Houthuessen and Muntjewerff2012; Blok, Reference Blok2014). They are two time-dependent parameters that determine subsidence when primary compression is finished, and therefore their importance increases with time. To assess the influence of the selected parameters on the output of this study, V ox and Cα were substituted for minimum and maximum values encountered in published research on Holocene peat in the Netherlands. For V ox, values provided by Schothorst (Reference Schothorst1977) were used (0.0048 and 0.0238mm−1a−1), and for Cα a minimum value of 0.007 (–) is provided by Fokker et al. (Reference Fokker, Gunnink, De Lange, Leeuwenburgh and Van der Veer2015) and a maximum value of 0.0341 (–) by Visschedijk (Reference Visschedijk2010). Again the hypothetical vertical voxel-stack of Figure 5 was used. The phreatic groundwater level lowering and duration of scenario 4 was used to determine the subsidence (0.5m phreatic groundwater level lowering during 30 years), as this scenario provides the highest subsidence values caused by oxidation and creep (longest duration, largest vertical interval of peat exposed to the atmosphere).
The black line in Figure 5 indicates subsidence for the hypothetical voxel-stack with parameter values used in this study. Total subsidence after 30 years is 20cm. The red lines represent differences in V ox, and green lines Cα. The graph shows that deviations in subsidence by differential selection of V ox commence directly after the period of primary consolidation. After that period, the V ox lines show a divergent trend. This confirms that with increasing time, the influence of the selected V ox parameter values increases. However, after a certain period, the minimum and maximum lines will show a convergent behaviour as peat completely oxidises and its thickness approaches zero. This will, however, occur beyond 30 years. Subsidence by a minimum oxidation rate after 30 years is c.13cm, and for maximum oxidation c.23cm, or −35% and +15% relative to the subsidence scenario used in this study. The lines of the different Cα values diverge directly after onset of consolidation. Contrary to the different V ox lines, these lines will continue to diverge over time, as creep continues infinitely. After 30 years, subsidence with minimum Cα is c.16cm, and with a Cα maximum c.24cm, or −20% and +20% relative to subsidence calculated with the parameters used in this study. Within the time period of 30 years, both parameters are important for subsidence after primary consolidation ends. However, for longer subsidence periods, the Cα parameter is of most influence, as peat oxidation eventually ends.
Discussion
Subsidence patterns
In most low-lying coastal-deltaic plains that are subjected to human-induced subsidence, the highest amount of subsidence is measured in urban areas such as cities and industrial complexes (Erkens et al., Reference Erkens, Bucx, Dam, De Lange and Lambert2015). Here, concentrations of human populations and industry demand large quantities of fresh water, which is extracted from deep aquifers. As a result, coastal cities such as Tokyo (Japan) (Furuno et al., Reference Furuno, Kagawa, Kazaoka, Kusuda and Nirei2015), Shanghai (China) (Chai et al., Reference Chai, Shen, Zhu and Zha2004), Jakarta (Indonesia) (Abidin, et al., Reference Abidin, Djaja, Darmawan, Hadi, Akbar, Rajiyowiryono, Sudibyo, Meilano, Kasuma, Kahar and Subarya2001) and Ho Chi Minh (Vietnam) (Thoang & Giao, Reference Thoang and Giao2015) have irreversibly subsided during the 20th and 21st centuries. These cities are generally subsiding at higher rates than their surrounding agricultural lands, because the groundwater extraction only affects the direct vicinity of exploitation wells.
In the coastal-deltaic plain of the Netherlands, subsidence occurs due to a different mechanism; as a result of centuries of human-induced phreatic groundwater lowering in reclaimed polder areas, agricultural areas have experienced major subsidence due to compression and oxidation of shallow Holocene peat layers. These are still the most vulnerable areas for future subsidence when phreatic groundwater levels are progressively lowered. In urban areas, thick anthropogenic brought-up soils covering peat have caused it to compress in the past. Still, future subsidence is expected to be much lower here, since the underlying peat cannot oxidise, and the overburden made the peat layers much less compressible. Consequently, surface elevations resulting from subsidence in the coastal-deltaic plain of the Netherlands are reversed from those in many other urbanised coastal zones. If the process of periodical phreatic groundwater level lowering continues in the near future, the urban areas will become regional heights in a low-lying subsided coastal-deltaic plain, whereas cities in many other coastal-deltaic plains will be situated in depressions.
Subsidence rates
Subsidence rates in the Netherlands by peat oxidation and compression have been relatively stable since the 1970s, with regional subsidence rates ranging between 1 and 12mma−1 (Schothorst, Reference Schothorst1977; Nieuwenhuis & Schokking, Reference Nieuwenhuis and Schokking1997; Van den Akker et al., Reference Van den Akker, Kuikman, De Vries, Hoving, Pleijter, Hendriks, Wolleswinkel, Simoes, Kwakernaak, Farrell and Feehan2008; Hoogland et al., Reference Hoogland, Van den Akker and Brus2012; Van de Born et al., Reference Van den Born, Kragt, Henkens, Rijken, Van Bemmel and Van der Sluis2016). Predicted future subsidence rates in the peat areas of the Netherlands are slightly lower, although they are within the range of recent and present-day rates. Hoogland et al. (Reference Hoogland, Van den Akker and Brus2012) predicted future subsidence rates between <1 and 5.3mma−1 for near-surface peat layers in agricultural areas of the central Netherlands for a period of 15 years, with water levels maintained at fixed elevations relative to the subsiding surface. Similar results were obtained by Van Hardeveld et al. (Reference Van Hardeveld, Driessen, Schot and Wassen2017) for subsidence of near-surface peat layers in agricultural areas of the central and western part of the Netherlands. They predicted subsidence rates between 0.6 and 4.5mma−1 for the entire 21st century, with water levels maintained between 30 and 90cm below the surface.
Subsidence rates predicted in this study range from 7 to 8mma−1 for scenarios 3 and 4 (30 year interval), and 11 to 13mma−1 for scenarios 1 and 2 (15 year interval). Since primary compression takes place in the first few years after groundwater level lowering, the subsidence rates decrease with time. Although our predicted future subsidence rates are twice as high as those of Hoogland et al. (Reference Hoogland, Van den Akker and Brus2012) and Van Hardeveld et al. (Reference Van Hardeveld, Driessen, Schot and Wassen2017), they are in good correspondence with documented recent and present-day subsidence rates.
Model limitations
In this study, the Bjerrum function was applied to predict compression of peat (cf. CUR, 1992). The formulation used assumes that the peat experiences virgin compression when phreatic groundwater levels are lowered. In practice, this will not be the case, as creep reduces the compressibility of peat by increasing its vertical effective stress. This process is expressed by the overconsolidation ratio (OCR). The OCR of a peat layer determines the threshold between reversible and irreversible compression and influences creep rates. Although the OCR was initially not implemented in the Bjerrum function (CUR, 1992), at present it is considered a prime input parameter (Visschedijk, Reference Visschedijk2010). It is for future updates of the subsidence modelling to use the state-of-the-art Bjerrum-function formulation, and to parameterise GeoTOP peat voxels with OCR. Implementation of lateral and vertical differential OCR values in GeoTOP will for instance cause older and deeper-situated peat layers to experience minor elastic compression when phreatic groundwater levels are lowered, whereas surficial peat layers will irreversibly compress and furthermore experience substantial creep. Mapping OCR over large spatial scales, however, is challenging, as this needs to be determined on local scales per subsurface unit. Implementation of the OCR of Holocene peat in GeoTOP could be conducted using large available datasets of Cone Penetration Testing that are maintained by TNO-GSN (Mayne & Kemper, Reference Mayne and Kemper1988; Robertson, Reference Robertson2009).
Another important physical peat property that reduces subsidence by compression and oxidation is the presence of admixed sediments in peat (Koster et al., Reference Koster, Stafleu, Cohen, Stouthamer, Busschers and Middelkoop2018a). Koster et al. (Reference Koster, Stafleu, Cohen, Stouthamer, Busschers and Middelkoop2018a) presented a method to assign peat voxels in GeoTOP with organic matter and sediment content, yielding 3D grids of dry mass and volumes of peat organic matter and sediments. It is widely accepted that admixed sediments in peat reduce its compressibility as it occupies pore spaces. Furthermore, as oxidation only affects peat organic matter, admixed sediments decrease the volume lost during phreatic groundwater level lowering. The organic matter and sediment content of peat are implementable in the Bjerrum function (Den Haan, Reference Den Haan1992); however, this does not account for peat oxidation functions. Consequently, in the presented subsidence modelling, 3D grids of peat organic matter and sediments were not used. It will therefore be a critical step forward to develop peat oxidation functions that comprise the amount of admixed sediments.
Conclusions
The subsidence potential of the urbanised and agricultural peat-rich coastal-deltaic plain of the Netherlands was estimated for periods of 15 and 30 years after a 0.25 and 0.5m phreatic groundwater level lowering. Agricultural areas were found to have a higher subsidence potential than urbanised areas. Peat in agricultural areas is often situated near the surface, and consequently very prone to oxidation, whereas peat beds in urbanised areas are systematically overlain by anthropogenic brought-up soil and thereby protected from aeration. Furthermore, the anthropogenic brought-up soil causes peat underlying cities to have low initial void ratios, and therefore the peat is less compressible than peat in agricultural lands. Subsidence by compression was more widespread than subsidence by oxidation, as compression reduced the thickness of all peat layers whereas oxidation was restricted to those above the lowered phreatic groundwater level. Future phreatic groundwater level lowering will result in increased elevation differences between the heavily urbanised zones and the agricultural areas of the coastal plain, with significant implications for maintaining infrastructure and land use planning.
Acknowledgements
This study is part of the PhD research of K.K., funded by TNO – Geological Survey of the Netherlands. Hans Middelkoop is acknowledged for his input and critical review of an earlier draft of the manuscript. Kim Cohen, Freek Busschers, Willem Jan Zaadnoordijk and Aris Lourens are thanked for their input at different stages of the research. We also thank G. Gambolati and an anonymous reviewer for their helpful comments.


