


Introduction
To be able to assess the fragility of the large building stock in the Groningen region, the buildings in the area have been categorised into a number of different typologies. The buildings in each typology are judged to have similar resistance to earthquake-induced accelerations and have similar usage and occupancy characteristics. Collapse fragility functions, which provide an estimate of the probability of collapse conditional on a level of ground shaking, need to be developed for each building typology by considering the building practices and materials from the Groningen area over the previous decades and centuries.
As many of the residential buildings in the Groningen area have been built using unreinforced masonry (URM), a highly heterogeneous material, these buildings have been given significant attention in the research carried out to date. As a result, the two main lines of research into building typologies are split between masonry buildings and non-masonry buildings (where the latter includes reinforced concrete, steel and timber constructions).
Modelling of masonry buildings requires in-depth knowledge of the material properties that are manufactured and used locally, and the possibility of capturing these properties faithfully within numerical models. Therefore the activities to assess the fragility of masonry buildings have started with (1) the measurement of masonry properties of buildings and materials in the area through in situ and laboratory tests and (2) a programme to validate the numerical methods used to assess the response of masonry buildings to strong ground shaking.
Non-masonry buildings (reinforced concrete, steel and timber) are more readily modelled with existing software that has already been validated against available experimental tests from around the world (Mosayk, 2014, 2015a). However, for increased confidence in the response of some specific reinforced concrete (RC) building typologies found in the Groningen region, which appear to be unique to this area of the world, a set of laboratory tests on reinforced concrete specimens is also being undertaken.
Numerical models have been developed for each building typology to estimate the lateral forces and displacements that each can withstand before collapse occurs. It is noted that the main causal pathways for loss of life that are currently being considered for URM buildings within the risk model include the following: being hit due to the collapse of a non-structural element (e.g. parapet or chimney) outside of the building, or being hit by the debris caused by partial or complete collapse of the building (both inside and outside), brought about by the global dynamic response of the structure to an input acceleration. Most of the residential buildings have large triangular gable walls which tend to be the most fragile elements of these buildings in terms of partial collapse mechanisms, due to their low overburden load and location at the top of the building (where the floor amplification is expected to be highest). For other types of non-residential URM buildings that do not have gable walls, it is likely to be the upper storey facade walls that are the most fragile and contribute most to partial collapse states. Complete collapse is defined as a collapse mechanism that involves the failure not only of the walls of the structure, but also of the floor and/or roof.
The numerical models have been calibrated through in situ and laboratory testing on the materials, connections, structural components and even full-scale buildings. The calibrated models have then been used to develop fragility functions by subjecting them to increasing levels of ground shaking (such as peak ground acceleration, PGA). These functions provide an estimate of the probability of structural collapse, given a specific level of ground shaking, and include the variability between buildings (due to different geometrical and material properties, which can be accounted for in the numerical models) and between the ground-shaking characteristics of earthquakes with the same magnitude and epicentral distance. The collapse mechanisms observed in the numerical analyses have been used to estimate the consequences in terms of collapsed debris, which would pose a threat to the lives of those in the collapsed portion of the building.
Selecting index buildings for numerical modelling
A study to identify the buildings to numerically model for each building type (referred to as ‘index buildings’), and to understand the representativeness of these buildings within the population of residential terraced, semi-detached, detached and apartment buildings in Groningen was carried out (Fig. 1) (Arup, 2016a). Based on the building inspections carried out within the field to date, around 15 different URM building types have been identified, and representative index buildings have been identified for the majority of these types. Efforts to cover all building types with one or more index buildings are continuing.
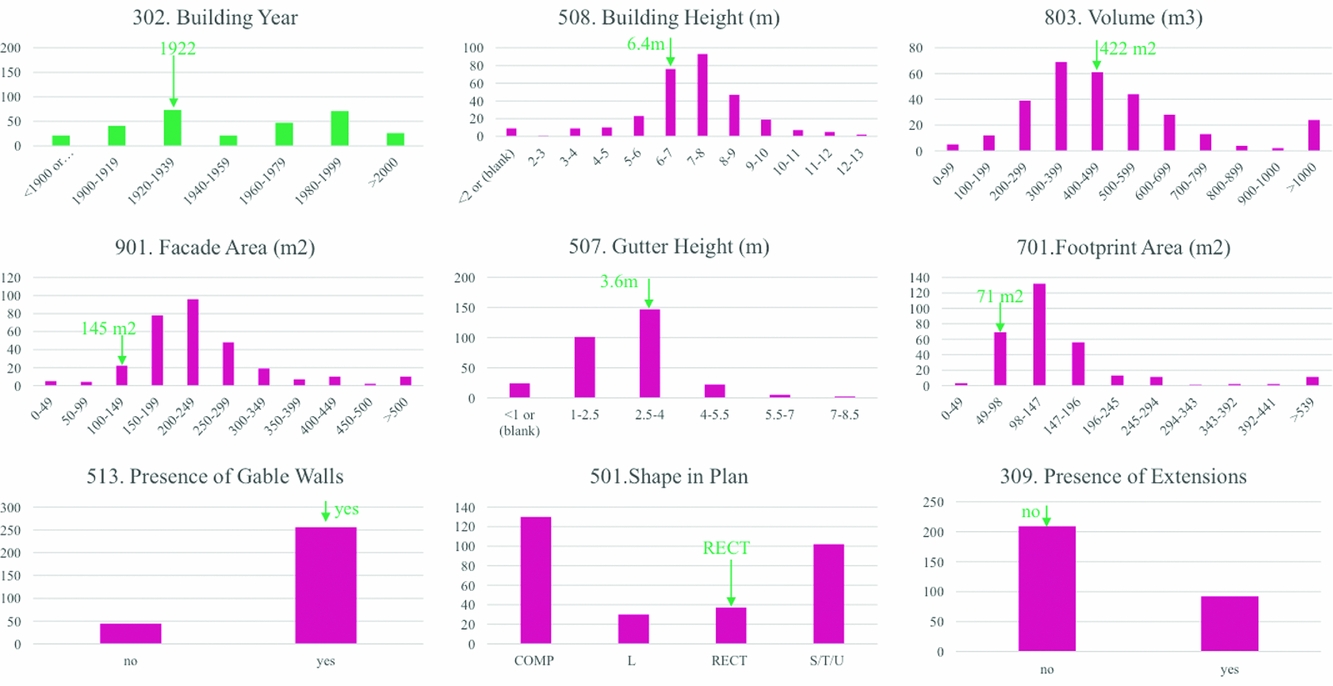
Fig. 1. Example representativeness study showing the distribution of building characteristics across a population of detached buildings, and the location of the selected index buildings within such population (green arrows).
Figure 2 shows six of these index buildings that have been modelled in both the LS-DYNA and TREMURI software packages (Arup, 2016b; Eucentre, 2016a) following their comprehensive implementation in the 2014 cross-calibration and blind prediction testing activities (Arup et al., 2015, 2016). Both software packages were used to understand the collapse capacity (under different collapse mechanisms, as mentioned previously) of the index buildings, once they had been calibrated using field and laboratory data, as discussed in the next section.

Fig. 2. Screenshots of some numerical model URM index buildings (taken from LS-DYNA).
Calibration of numerical models
A number of tests on masonry houses have been carried out in situ (Eucentre et al., 2015). Various tests on the walls have provided insight into the average material properties of masonry, which can then be used as input to the numerical software (Fig. 3). Geophone tests (Fig. 4) have also been used to characterise the frequency characteristics of some buildings, which could then be compared with the mode shapes and frequencies of vibration obtained from the numerical models of these buildings.

Fig. 3. In situ material tests on walls inside masonry houses (Eucentre et al., 2015).

Fig. 4. Geophones applied to a terraced masonry house to measure its frequency characteristics (for this building fundamental periods of vibration of 0.16 and 0.07 s in each direction have been measured) (Eucentre, 2014).
For further calibration and testing of the numerical methods used to predict the response of masonry to ground shaking, sets of solid and cavity walls have been constructed by Groningen masons and tested within laboratories in the Netherlands and Italy (Eucentre, 2015a; Graziotti et al., Reference Graziotti, Tomassetti, Penna and Magenes2016a, b; Tomassetti et al., Reference Tomassetti, Graziotti, Penna and Magenes2016) (Fig. 5).

Fig. 5. Masonry walls constructed by Groningen masons and tested in laboratories (Eucentre, 2015a) and blind prediction from one software package (Arup et al., 2015).
These walls have been tested both in-plane and out-of-plane, and a number of modelling teams have predicted the response of the tests (in terms of strength and stiffness of the walls, displacements at which failure occurs, crack patterns, etc.) using various numerical software packages (Arup et al., 2015). The lessons learned from the tests have then been used to improve the modelling capabilities of LS-DYNA, TREMURI and DIANA. Figure 5 shows some of the predictions of the software for the response of these component tests.
Figure 5 shows that the in-plane tests of slender walls have highlighted an important characteristic of the calcium silicate bricks, which is that they have a much higher capability to dissipate energy than would be expected for a slender wall responding with a rocking mechanism.
Two full-scale URM house specimens, a cavity wall terraced house (with one unit) and a solid wall detached house, have been constructed on top of a shaking table by Groningen masons using local materials and construction practice (Graziotti et al., Reference Graziotti, Guerrini, Kallioras, Marchesi, Rossi, Tomassetti, Penna and Magenes2017a,Reference Graziotti, Tomassetti, Rossi, Kallioras, Mandirola, Penna and Magenesb, in review) (Fig. 6). These structures have been tested by applying accelerations to their base, which have been selected to match the hazard characteristics of the Groningen field (Eucentre, 2015b). Disaggregation of the hazard model that has been developed for the Groningen field (van Elk et al., Reference Van Elk, Doornhof, Bommer, Bourne, Oates, Pinho and Crowley2017) was undertaken at both a low level of ground shaking (predicted to cause moderate damage to the building) and at a higher level of ground shaking (predicted to lead to near-collapse). Response spectra and expected significant durations were calculated for the modal scenarios identified from the disaggregation using the ground-motion prediction model for the field (Bommer et al., Reference Bommer, Dost, Edwards, Kruiver, Ntinalexis, Rodriguez-Marek, Stafford and van Elk2017), and records (from a global database) were then selected and matched to these ground motion parameters.

Fig. 6. Two full-scale house specimens on the shaking table (Eucentre, 2015b, 2016b).
The accelerations have been scaled to values much higher than those already experienced in the Groningen field, so that comprehensive calibration of the numerical models (Fig. 7) can be undertaken. Figure 8 shows the blind prediction and post-diction results of the different software packages for one of the shaking-table tests.

Fig. 7. Numerical models (developed by Arup, TU Delft, Eucentre) of the full-scale terraced house building tested on the shaking table.

Fig. 8. Blind prediction (top) and post-diction (bottom) of one of the full-scale houses tested on the shaking table (Arup et al., 2016).
Finally, it is noted that not only masonry structures, but also reinforced concrete wall-slab frames (and their connections) have been and continue to be tested in the laboratory (e.g. Eucentre, 2017), given that the seismic response of such types of structure has never been scrutinised in the past. Two examples of such RC full-scale test specimens are shown in Figure 9.

Fig. 9. Two full-scale RC wall-slab frames (top: cast-in-place, bottom: precast) tested in laboratory.
Development of fragility functions
In addition to providing a wealth of data that is used to test and calibrate the various software packages being used to model URM buildings, the shaking-table tests are also able to offer a check on the assumed capacity of buildings. Figure 10 shows the peak response in terms of base shear (normalised with respect to the weight of the building) and floor displacement from each dynamic analysis carried out during the second shaking-table test (for the detached URM building). This plot has been compared with the equivalent plots obtained from the numerical analyses of the URM index building that was used to represent older, URM detached buildings with solid walls and timber floors. Despite the differences in geometry between the two URM buildings, which impacts in particular the stiffness of the house, the similarity in strength and displacement capacity seen in this plot provides a consistency check of the numerical analyses used in the fragility model.

Fig. 10. Comparison of the experimental capacity of the URM building tested on the shaking table and the numerical capacity of the index building used to represent detached URM buildings with solid walls and timber diaphragms in the fragility model.
Once calibrated numerical models have been developed for each index building, a set of incremental dynamic analyses such as those shown in Figure 10 are carried out to assess the initial stiffness, maximum base shear and ultimate displacement capacity (at partial and complete collapse). These multi-degree-of-freedom (MDOF) results are transformed to represent the capacity of equivalent single-degree-of-freedom (SDOF) systems, and nonlinear dynamic analyses using hundreds of records are then undertaken on each of these SDOF models to account for the record-to-record variability in the nonlinear response.
In addition, the effects of soil–structure interaction (i.e. foundation-soil flexibility and damping) are also accounted for by adding springs and dashpot dampers at the base of the SDOFs (Mosayk, 2015b), to represent the presence of either shallow foundations or piles on the different soils found within the Groningen field.
Records that uniformly covered a range of ground-shaking intensities (arising from a range of earthquake magnitudes, distances and durations consistent with the seismic hazard assessment carried out for the Groningen field) have been selected for the nonlinear dynamic analyses, and the displacement response of each structural typology to these records has been estimated (see Fig. 11a). From this cloud of ground-shaking intensity versus nonlinear response data, it is possible to use regression analysis to obtain the parameters that describe the probability of collapse (for a given mechanism) at different levels of ground shaking (Fig. 11b), again for each structural typology. This probability of collapse does not consider the model uncertainty that results from inaccuracies in the structural models used to represent the median building of a given typology. This uncertainty is assumed to be correlated across all buildings within a given building typology, and has thus been included in the risk assessment within a logic tree. For computational efficiency, only three branches have been considered on the logic tree, and hence the model uncertainty has been modelled as a discrete three-point distribution. Currently, the recommendations in FEMA P-58 (FEMA, 2012) have been used to identify appropriate values of modelling uncertainty dispersion for each typology, but future efforts will consider how the comparisons of the models with the experimental test results can be used to quantify this uncertainty.
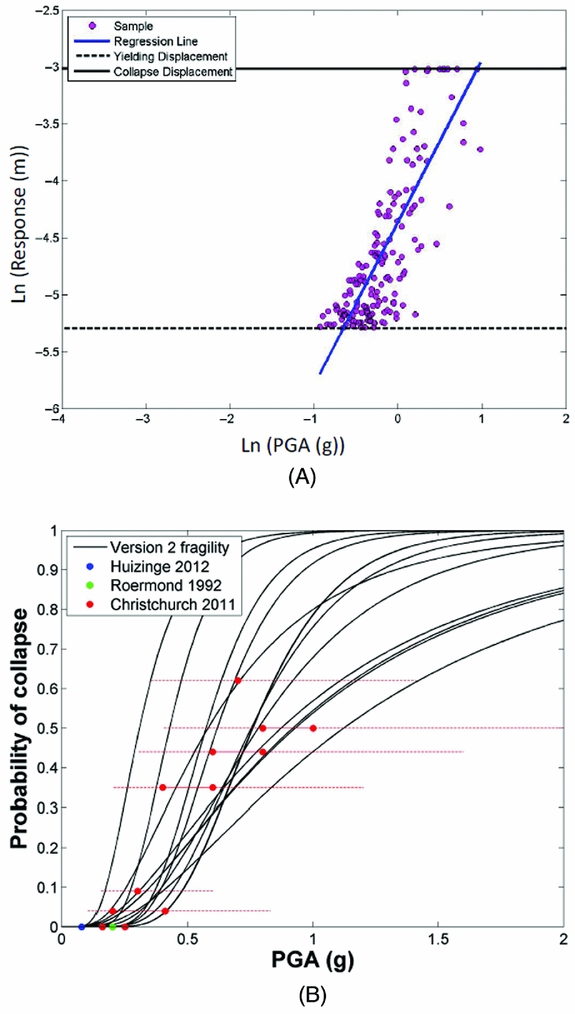
Fig. 11. (A) Ground-shaking intensity vs nonlinear response (B) resulting fragility functions (the latter are herein defined in terms of PGA simply for the purpose of facilitating comparison with damage data from past earthquakes that have hit buildings with characteristics similar to those in Groningen).
Readers are referred to Crowley et al. (Reference Crowley, Polidoro, Pinho and van Elk2017) for more details on this methodology used for developing fragility functions.
Finally, history and empirical data checks are carried out by comparing damage estimates obtained with the derived analytical fragility functions against the actual damage observed in past earthquakes that have hit buildings with characteristics similar to those in Groningen (including past events in the Groningen region itself). Figure 11b shows a comparison of the fragility functions for all URM typologies (shown in black) with the collapse data of URM buildings from recent events in the Groningen field (Huizinge 2012), the Netherlands (Roermond 1992) and New Zealand (Christchurch 2011).
Developing the consequence model
The results of the numerical modelling of URM index buildings described above have also been used for the consequence model. The LS-DYNA models were able to explicitly model the collapse of the load-bearing URM walls and the consequences in terms of roof/attic/floor collapse. Such detailed global collapse modelling capabilities have allowed an estimation to be made of the floor area that would be covered in debris for different collapse mechanisms, from local collapse of the gable wall to collapse of one or more storeys. For the local failure mechanisms of gable and facade walls, past earthquakes have shown that only a percentage of these walls fail during strong ground motion, and they fail both inside and outside the building. These factors are taken into account when estimating the area of inside debris expected from these local failure mechanisms (Fig. 12).

Fig. 12. Collapse mechanism forming during nonlinear dynamic analysis of a URM index building modelled with LS-DYNA.
In order to translate this area of debris into a probability of loss of life inside the building, a person is assumed to be spread uniformly across the total internal floor area of the building. The ratio of the area of debris to floor area thus gives an estimation of the probability of an occupant being trapped/hit by debris. It has been observed in past earthquakes (Coburn & Spence, Reference Coburn and Spence2002) that a percentage of people trapped/hit by debris will be killed instantaneously. This probability is judged to be much higher for people hit by an object falling outside from the upper floors of the building (Arup, 2016c) than for people within the collapsed portion of the building, given that structural and non-structural elements tend not to fall so far, and there are a number of features of the building that can provide shelter for occupants (furniture, doorways etc.). The percentage of the surviving trapped people who subsequently die also needs to be accounted for; this has been observed from past earthquakes to depend on the building material and the effectiveness of search and rescue efforts, and thus an estimate of this percentage can be translated into a probability.
Future plans
The identification of additional index buildings to represent different building typologies continues, together with efforts to numerically model these buildings. Both the in situ and laboratory experimental campaigns will also be continued over the next months/years, and this will naturally provide opportunities for further verification and calibration of the numerical models used to develop fragility and consequence functions.
It is appreciated, however, that real masonry buildings may have been modified over time by homeowners, they may have been subject to degradation and subsidence, and they may include additional components that could collapse, such as chimneys and parapets, which have not yet been tested in the laboratory. In order to gain a better understanding of the capacity of these buildings (and their components) to withstand collapse, in situ shaking-table tests are needed and are currently being planned for 2018 (Fig. 13).

Fig. 13. Scheme for in situ shaking of a real masonry building and associated mobile laboratory.
This additional experimental programme will therefore constitute a valuable complement to the aforementioned laboratory tests, thus allowing for a more complete calibration of the fragility and consequence functions.
Acknowledgements
Many people have contributed to this work, either directly or through constructive and helpful discussions held throughout the development of this work. In particular, the comments from the Scientific Advisory Committee led by Lucia van Geuns have been instrumental in improving this work. Raphael Steenbergen has contributed to this work through many discussions over the years. We also wish to thank the anonymous reviewers for helpful comments on the original version of this paper, and guest editor Karin van Thienen-Visser for assistance with the processing of this contribution.


 Open access