


1. Introduction
Automated essay evaluation (AEE) is the process of evaluating and scoring written essays via computer programs using features intended to measure many of the traits specified in scoring rubrics, such as the six-trait model (Spandel and Stiggins Reference Spandel and Stiggins1990).Footnote a Nowadays, AEE systems play an important role in writing evaluation and have been successfully used in large-scale writing assessments. Automated assessment holds the potential for maintaining scoring reliability and desired timelines for reporting scores in large-scale assessments (Ramineni and Williamson Reference Ramineni and Williamson2013). A large body of data shows that the reliability of AEE scores is superior to human ratings (Attali and Burstein Reference Attali and Burstein2006; Shermis et al. Reference Shermis, Burstein, Higgins and Zechner2010; Burstein, Tetreault and Madnani Reference Burstein, Tetreault, Madnani, Shermis and Burstein2013).
1.1 The trait of ideas in an essay
The trait of ideas in an essay is considered one of the most important characteristics in the existing essay scoring rubric (Spandel and Stiggins Reference Spandel and Stiggins1990; Cui Reference Cui2001; the National Writing Project, NPC, America 2006; Ruegg and Sugiyama Reference Ruegg and Sugiyama2013), which reflects the writing construct. The quality of ideas includes the main idea, details, information and material, reasoning, and the selection and confirmation of evidence (Northwest Regional Educational Laboratory, NWREL 2014). According to the curriculum standards for Standard Chinese language and other subjects in compulsory education (2011) issued by the Ministry of Education of China, the ideas in the composition are often the first consideration in the process of written assessment (Feng Reference Feng1990; Jin Reference Jin1992; Cui Reference Cui2001). The criteria for evaluating compositions according to the assessment of teaching quality for basic education (ATQE) include five basic elements for evaluating compositions (Table 1 contains the scoring rubric).Footnote b Three aspects to describe the quality of the ideas can be derived from the rubric:
-
• Is there a main idea?
-
• Does the content support the main idea?
-
• Are the ideas developed adequately?
For example, high-scoring essays usually present a clear and well-focused main idea along with specific details to support their main point; whereas, low-scoring essays contain irrelevant content and an unclear main idea that might not even display a connection to the topic.
However, it is worth noting that the construct for AEE system measurements differs from human scoring in rating essays no matter how strongly the computer and human scoring correlate (Deane Reference Deane2013). AEE systems tend to be more detail-oriented since they usually pay more attention to specific sets of quantitative linguistic features. Most AEE systems generate general quality holistic scores for composition, while some of them also score for different potential composition traits (Shermis Reference Shermis2002; Attali Reference Attali2011, Reference Attali, Shermis and Burstein2013; Zedelius, Mills and Schooler Reference Zedelius, Mills and Schooler2018). The trait of content is easier to measure than ideas, but both traits are linked (Quinlan, Higgins and Wolff Reference Quinlan, Higgins and Wolff2009). Current AEE systems extract text features to capture the content characteristics of an essay by employing content vector analysis (e.g., e-rater, Educational Testing Service) (Burstein, Tetreault and Madnani Reference Burstein, Tetreault, Madnani, Shermis and Burstein2013), latent semantic analysis (LSA) (Landauer, Lochbaum and Dooley Reference Landauer, Lochbaum and Dooley2009), or latent Dirichlet allocation methods to compare similarities between essays and then determine the content-level quality. Also, some current AEE engines use different specific features based on statistics or machine learning methods to detect whether an essay is off-topic (Higgins, Burstein and Attali Reference Higgins, Burstein and Attali2006; Louis and Higgins Reference Louis and Higgins2010; Chen et al. Reference Chen, Zhu, Xia and Zhang2015; Rei Reference Rei2017).
Research on automatic scoring of Chinese compositions started relatively later than the automatic scoring of English compositions. Some studies measure shallower linguistic aspects, such as the choice of the words, (Chen Reference Chen2016) and the recognition of beautiful sentences via computer programs (Liu, Qin and Liu Reference Liu, Qin and Liu2016; Fu et al. Reference Fu, Wang, Wang, Hu and Liu2018). The LSA method was also introduced to assess the similarity to high-scoring Chinese compositions (Cao and Yang Reference Cao and Yang2007). Bochen Kuo’s team (in National Taichung University of Education, Taiwan) developed a Chinese Coh-Metrix online text analysis system (Ni et al. Reference Ni, Bai, Zhang and Liao2013, Reference Ni, Zhang, Liao, Guo and Bai2014; Zhang et al. Reference Zhang, Ni, Liao, Kuo and Bai2014) and Mo (Reference Mo2018) used the features in this system to predict the writing ability of Chinese second language learners.
Table 1. Ideas’ scoring guide for Chinese composition in ATQE

Note: The table is an English translation of the scoring rules (originally in Chinese) for the ideas in ATQE.
1.2 Graph-based method for essay scoring
A concept map can be employed to analyze a student’s understanding of a complex situation (Koszalka and Spector Reference Koszalka and Spector2003; Zouaq and Nkambou Reference Zouaq and Nkambou2008; Villalon and Calvo Reference Villalon and Calvo2011; Zouaq, Gasevic and Hatala Reference Zouaq, Gasevic and Hatala2011). Using language as the basis for constructing a concept map is likely to represent a more accurate picture of the meaning and structure of the targeted internal knowledge (Pirnay-Dummer et al. Reference Pirnay-Dummer and Ifenthaler2010; Kim Reference Kim2012a) because structural knowledge consists of concepts and relations (Koszalka and Spector Reference Koszalka and Spector2003). Each essay is transformed into a concept map, in which nodes correspond to words, n-grams, or other tokens of text, and the co-occurring ones are connected by weighted edges. However, the use of concept maps for educational assessment is just beginning. Concept maps are used as a visual inspection to reveal the assessment context and writing style. In performance assessments, a concept map can be used to investigate the abilities of a writer to solve complex problems (Schlomske and Pirnay-Dummer Reference Schlomske and Pirnay-Dummer2008; Kim Reference Kim2012a, Reference Kim2012b; Zhou, Luo and Chen Reference Zhou, Luo and Chen2018), but these studies do not utilize full automation in the assessment process. Somasundaran et al. (Reference Somasundaran, Riordan, Gyawali and Yoon2016) investigated whether the development of ideas in writing could be captured by graph properties derived from the text and if this could be used to improve holistic scoring in persuasive and narrative essays. Also, text analysis based on complex networks proves that composition quality has a strong correlation with complex network features (such as the degree of nodes) (Antiqueira et al. Reference Antiqueira, Nunes, Oliveira and Costa2007; Amancio, Oliveira and Costa Reference Amancio, Oliveira and Costa2012), which can be used in essay scoring (Ke, Zeng and Luo Reference Ke, Zeng and Luo2016; Zupanc and Bosnic Reference Zupanc and Bosnic2017). The commonality and individuality of these AEE systems indicate a tight-knit relationship between graph-based characteristics and essay quality.
For the construction of a concept map, our method is based on Somasundaran et al. (Reference Somasundaran, Riordan, Gyawali and Yoon2016) and Zupanc and Bosnic (Reference Zupanc and Bosnic2017), but there are some differences. Essay words in our study were merged synonymously to enhance the meanings of the nodes and create refined concepts rather than recognizing nodes by word types (Somasundaran et al. Reference Somasundaran, Riordan, Gyawali and Yoon2016). Whereas Zupanc and Bosnic (Reference Zupanc and Bosnic2017) utilized the sliding window method to transform a composition into a continuous token sequence, where each token is represented as a node and only contacts its front and back nodes. Their method is suitable for evaluating composition coherence but is inapt at concept map forming. Besides, Janda et al. (Reference Janda, Pawar, Du and Mago2019) used sentences as nodes, and the semantic similarity between these sentences as the weight of the edges to construct a graph, which differs from our concept maps.
In terms of developing graph-based features, we combined graph theory features, and some features adopted from Somasundaran et al. (Reference Somasundaran, Riordan, Gyawali and Yoon2016) and Zupanc and Bosnic’s (Reference Zupanc and Bosnic2017) studies. However, Somasundaran et al. (Reference Somasundaran, Riordan, Gyawali and Yoon2016) did not use distributed semantics to represent concept map nodes, whereas our research employed word2vec embedding to represent essay concepts. Although Zupanc and Bosnic (Reference Zupanc and Bosnic2017) used high-dimensional vectors to represent nodes and calculate features, the meaning of the nodes and edges is quite different from our concept maps. Zupanc and Bosnic’s features are used to access the distribution pattern of sequential overlapping essay parts, and our research evaluates the distribution pattern of concepts in an essay. Moreover, Maharjan and Rus (Reference Maharjan and Rus2019) transformed student answers into concept maps and compared the similarity of learning tuples between ideal concept maps and student-made maps to evaluate their answers. This method is suitable for short-answer questions, which usually have a golden (or reference) answer. However, composition semantics are superior with open-ended questions; therefore, we compared the similarity of a targeted essay with a high-scoring essay set to develop features. Finally, past researchers concentrated on general composition assessment, while this study’s main objective is to reveal the potential relationship between concept map characteristics and idea traits.
1.3 Argument mining in automatic essay scoring
There is another line of work that applies argumentation mining (AM) technology to the automatic scoring of persuasive essays in the education field. This research is based on identifying argumentative structures that consist of argumentative components such as claims, premises (Mochales-Palau and Moens Reference Mochales-Palau and Moens2009; Kwon et al. Reference Kwon, Zhou, Hovy and Shulman2007; Eckle-Kohler, Kluge and Gurevych Reference Eckle-Kohler, Kluge and Gurevych2015; Stab and Gurevych Reference Stab and Gurevych2014a, Reference Stab and Gurevych2014b, Reference Stab and Gurevych2017), and the relationship between these components (Ong, Litman and Brusilovsky Reference Ong, Litman and Brusilovsky2014; Stab and Gurevych Reference Stab and Gurevych2014a, Reference Stab and Gurevych2014b; Ghosh et al. Reference Ghosh, Khanam, Han and Muresan2016; Persing and Ng Reference Persing and Ng2016; Nguyen and Litman Reference Nguyen and Litman2016; Ghosh, Klebanov and Song Reference Ghosh, Klebanov and Song2020; Persing and Ng Reference Persing and Ng2020), which can help represent complex concepts in essays written about controversial topics. There are two scenarios for the use of argument mining technology in the automatic evaluation of persuasive essays. The first is the use of argumentation features to automatically grade particular essay quality dimensions, such as topic relevance, (Persing and Ng Reference Persing and Ng2014), views and objectives (Farra, Somasundaran and Burstein Reference Farra, Somasundaran and Burstein2015), and argument strength (Persing and Ng Reference Persing and Ng2015; Wachsmuth, Khatib and Stein Reference Wachsmuth, Khatib and Stein2016; Ke Reference Ke2019). The other is examining the contribution of the argumentative features to the quality of the holistic score (Persing and Ng Reference Persing and Ng2013, Reference Persing and Ng2015; Ong, Litman and Brusilovsky Reference Ong, Litman and Brusilovsky2014; Song et al. Reference Song, Heilman, Klebanov and Deane2014; Farra Somasundaran and Burstein Reference Farra, Somasundaran and Burstein2015; Ghosh et al. Reference Ghosh, Khanam, Han and Muresan2016). Nguyen and Litman (Reference Nguyen and Litman2018) proposed a method for automatically extracting features in the whole process of cross-prompt argumentation and analyzed the effect of each dimension feature using the controlled variable method. Some automatic essay scoring systems are based on scoring rubrics (Rahimi et al. Reference Rahimi, Litman, Correnti, Wang and Matsumura2017; Zhang and Litman Reference Zhang and Litman2017, Reference Zhang and Litman2018; Zhang et al. Reference Zhang, Magooda, Litman, Correnti, Wang, Matsmura, Howe and Quintana2019), while some utilize end-to-end neural models (Cocarascu and Toni Reference Cocarascu and Toni2018).
Although recent years have seen a surge of interest in automated essay scoring based on AM technology, there are still some problems that inevitably limit the use of AM in essay scoring. Argumentation is an important aspect of persuasive essay assessment, but it is not equally effective for all essay types. For example, the data collected in this study use essays written by eighth-grade Chinese students that were obtained from a large-scale test, and the corpus of each prompt is a mixture of various essay genres such as descriptive, narrative, and persuasive. Most AM-based research on persuasive writing is aimed at college students’ writing, so younger students’ writings have received insufficient analysis. Due to this knowledge gap, standard discourse structures (such as thesis, main proposition, support, and conclusion) are not shown, so the argument component is rare or difficult to identify (Ghosh, Klebanov and Song Reference Ghosh, Klebanov and Song2020) in younger students’ writings. Moreover, different prompts often lead to diverse arguments, and few researchers have made progress in scoring general writings (Mayfield and Black Reference Mayfield and Black2020). In fact, if the evaluation objective is the ideas generated by the students in the writing process, it should also consider contextual details in addition to an essay’s argumentive part. In this regard, researchers have noticed the influence of contextual knowledge on the identification of argumentative structures (Nguyen and Litman Reference Nguyen and Litman2016; Saint-Dizier Reference Saint-Dizier2017; Opitz and Frank Reference Opitz and Frank2019); however, these studies did not directly use contextual information to predict the quality of the arguments.
The concept map method in our research can be seen as a promising alternative in overcoming these problems, although it faces challenges in the representation of complex concepts in argumentation. To evaluate the quality of ideas across different genres and essay forms, and not just confined to the concepts that appear in the argumentation, we use concept maps to capture the overall quality of ideas in the global concept distribution of the context. In text computing, there are two different views on coding and representing knowledge. The first way, which is popular in the deep learning community, is to embed the semantics of text into a high-dimensional vector space through pretraining, such as word2vec (Mikolov et al. Reference Mikolov, Chen, Corrado and Dean2013), Glove (Pennington, Socher and Manning Reference Pennington, Socher and Manning2014), and bidirectional transformer architecture (BERT) (Devlin et al. Reference Devlin, Chang, Lee and Toutanova2019). Furthermore, the knowledge embedded in the pretrained semantic vector is implicit and unstructured. The other way is from a structural point of view. As mentioned above, concept maps (or semantic networks) can reflect the conceptualization space generated by an author, but structural evidence based on graphs has not been fully explored.
This study mapped the student essays to a concept map in high-dimensional semantic space to show the advantage of using concept maps to combine pretrained distributed semantic information and the structure information of a map to predict the idea scores. The goal of this research is to develop an automatic scoring system (named AECC-I: Automated Evaluation for Chinese Compositions-Ideas) for ideas with generalization and to investigate whether the system can capture changes in the quality of the ideas of each subdimension based on a rubric.
2. Capturing the quality of ideas using concept maps
2.1 Essay as a concept map
In this study, it is assumed that a concept map can effectively assess a student’s conceptualization of a problem in a writing task, and a concept map elicited from a student’s response by computer is used to represent the underlying semantics embedded in the essay.
2.1.1 Preprocessing
Three text-preprocessing steps were implemented by the computer before extracting concept maps: Chinese word segmentation (CWS), part-of-speech (POS) tagging, and filtering the stop word (FSW). To do that, the Language Technology Platform Cloud (LTP-Cloud) is used in this study,Footnote c which was developed by the Research Center for Social Computing and Information Retrieval at Harbin Institute of Technology (HIT-SCIR). LTP-Cloud is a widely used Chinese language processing platform that we have completed word segmentation and POS tagging for Chinese compositions before. Steps for text preprocessing are as follows:
Step 1: Chinese word segmentation
Because sentences written in Chinese are composed without spaces and require word segmentation, CWS, a process of segmenting Chinese sentences into word sequences, is required. Since words are the basic units of language that make sense in Chinese, word segmentation is the initial step for information retrieval, text classification, sentiment analysis, and many other Chinese natural language processing tasks.
Step 2: POS tagging
POS is the process of labeling each word in a sentence with its appropriate part of speech (deciding whether each word is a noun, verb, adjective, etc.). Compared with English, Standard Chinese lacks morphological changes, so it cannot be used to identify parts of speech. LTP can solve this problem by using a dictionary query algorithm based on string matching and a POS algorithm based on statistics.
Step 3: Filtering the stop word
To filter noise in word segmentation results, a stop word list made up of 1208 words was created. This filtering removes function words such as “a” as well as punctuations.

Figure 1. The process of constructing a concept map from a composition.
2.1.2 Constructing concept maps
Concept maps are automatically constructed from essays by representing each concept in an essay as a node in the concept map. Concepts distilled from an essay are based on a set of rules, and edges are created by connecting all nodes (concepts) to other nodes based on their co-occurrence relation in a sentence. The assumption is that the edges between a pair of concepts simulate the links of a writer’s ideas in an essay. A flowchart of the concept map construction process is shown in Figure 1. Two key steps are described below.
–Identifying concepts
Words are the basic unit of language that carries meaning in Standard Chinese, but some words share the same meaning or very similar meanings. For example, a mobile phone could be contextually synonymous with a cellphone, and they both refer to a common concept in general. In this study, a synonymy merging process is used to collapse similar words based on Cilin.Footnote d Cilin contains more than 10 million entities, which are divided into 12 categories, 94 middle categories, and 1428 subcategories. The most detailed level is the atomic word groups; for each synonym atomic word group, a uniform general word is used to represent the concept of the word group. Then, the concepts were distilled from the word groups depending on a set of rules via a computer program. Finally, a concept set obtained through the above process serves as the node set on a concept map, and the number of nodes on a concept map is taken as equal to the number of unique concepts in an essay.
The concepts were distilled from general words depending on a set of modified rules based on Somasundaran et al. (Reference Somasundaran, Riordan, Gyawali and Yoon2016):
-
• Rule 1: A concept can be a general noun, compound noun, pre-modifier adjective, direction noun, or a named entity (the name of a person, location, organization, or other entities in a sequence of words recognized by LTP tools).
-
• Rule 2: Distilled concepts are primarily stored as standardized word types.
-
• Rule 3: Co-reference resolution, which means pronouns are replaced with the nouns they represent, except for first-person pronouns.
-
– Identifying co-occurrence relation
-
Identifying links among concepts is the most important step because it provides information used to construct edges on concept maps. A pair of concepts appearing together usually means there is a syntactic or semantic connection between them (Zhou et al. Reference Zhou, Hu, Zhang and Guan2008). An example of an essay converted into a concept map is illustrated in Figure 2. The gray lines on the right graph represent the co-occurrence relations between pairs of concepts in this essay.

Figure 2. The composition is transformed into a concept map (Chinese characters have been translated into English in the graph on the right.
In order to evaluate the quality of an automatically extracted concept map, two teachers and five students participated in the manual construction of a concept map for each of the 100 randomly selected compositions from the same datasets. Before participating in the evaluation, these teachers and students participated in formal scoring for compositions (described in Section 3.1), so they have adequate familiarity with the writing topics and essay content. While constructing a concept map, participants followed the rules similar to the automatic extracting process. To reduce the burden of concept recognition, some basic statistical information (word frequencies and a stop word list) from the text was provided. Participants were required to identify key concepts and the co-occurrence relationship between these concepts for each composition and generate a skeleton concept map (the weight of the concept edges was not included here). Two students independently constructed a concept map for each composition, and then the teacher led a discussion with the students about the differences between the two concept maps and determined the final manual concept map. Comparing the concept maps between the manually constructed and automatically extracted from the same composition allows us to assess the degree of consistency between them. We found that the participants recognized some concepts that were not considered by the automatic extraction process, so we optimized the extraction technique program, such as entering standardized word types for specific concepts. Finally, the number of identical nodes in the automatically constructed concept map and the manually constructed concept map is 93.8% on average; the number of identical edges in the automatically constructed concept map and the manually constructed concept map is 91.2% on average. Thus, the validity of the concept maps created from the essays should ultimately be reflected in the accuracy and effectiveness of the automatic essay scoring model in this study.
2.2 Features based on the concept maps
In this section, a graph-based feature set is computed based on a combination of a concept map structure and word embeddings representation. The assumption is that the ideas in an essay might change the structure and characteristics of a concept map extracted from the essay. Based on capturing the relationships between concepts, the distances between concepts are calculated based on the vector representation of concepts. We used the word2vec (Mikolov et al. Reference Mikolov, Chen, Corrado and Dean2013) representation, which is a well-known model used in natural language processing to represent words as a numeric vector. A numerical vector with 300 dimensions, by a skip-gram model, implies semantic information for each concept in this task, and the Euclidean distance metric was used to compute the distances between concepts. Based on the four characteristics of concept maps, 12 features were distilled and listed in Table 2.
Table 2. A framework of features extracted by computer

2.2.1 Global convergence
Convergence is one of the most important formal measurements when evaluating idea cohesion (Zhou, Luo and Chen Reference Zhou, Luo and Chen2018). Essays have one central object of elaboration—the main idea, which is unique and serves as the convergence point for all the information in the essay; the other ideas and content should be relevant to the main idea and extend outward with the main idea as the core. The main idea is the focus defined by the writer on the premise of their existing knowledge (Stevens, Slavin and Farnish Reference Stevens, Slavin and Farnish1991), and the selection of other subject information reflects the cognitive perspective of the writer on the main idea. Three proposed features to measure the global cohesion of ideas are as follows:
–Moran’s I (MI)
Moran’s I (MI) is a classic spatial autocorrelation measurement that expresses the global clustering situation of points in space. If the values of variables in space become more similar to the reduction of distance, it means that the data are clustered in space, which is called positive spatial correlation. If an article shows positive spatial autocorrelation, it indicates that the parts of the composition are well related to each other (Kim Reference Kim2013). On the contrary, if the measured value grows with the reduction of distance, the data are scattered in space, which is called a negative spatial correlation. This indicates a lack of dependence on the composition, and the composition contains randomness. Zupanc and Bosnic (Reference Zupanc and Bosnic2017) method was adopted to calculate this measurement, which suits the researcher’s 300-dimensional semantic space adjustment from the original two-dimensional space:
 \begin{align}Moran's\ I=N/S \cdot n\sum_{k=1}^{n}\left[\sum_{i=1}^{N}\sum_{j=1}^{N} w_{ij}\left(D_{i}^{k}-\overline{D_{c}^{k}}\right)\left(D_{j}^{k}-\bar{D_{c}^{k}}\right)\bigg/\sum_{i=1}^{N}\left(D_{i}^{k}-\overline{D_{c}^{k}}\right)^{2}\right] \end{align}
where N is the number of points (or concepts) in a concept map and n is the number of dimensions on the word2vec representation. So, ${\rm{\;}}n=300{\rm{\;}}D_i^k$
k = 1… n;
${\rm{\;}}n=300{\rm{\;}}D_i^k$
k = 1… n; $i=1$
, …, and N is a kth dimension of concept
$i=1$
, …, and N is a kth dimension of concept $i$
;
$i$
; $\overline{D_c^k}$
is the kth dimension of a mean center. Weights (
$\overline{D_c^k}$
is the kth dimension of a mean center. Weights ( ${w_{ij}}$
) are assigned to every pair of concepts, with the value
${w_{ij}}$
) are assigned to every pair of concepts, with the value ${w_{ij}}$
= 1. If
${w_{ij}}$
= 1. If $i$
and
$i$
and ${\rm{\;}}j$
are neighbors, then it means there is an edge between
${\rm{\;}}j$
are neighbors, then it means there is an edge between $i$
and
$i$
and ${\rm{\;}}j$
; otherwise, the value
${\rm{\;}}j$
; otherwise, the value ${w_{ij}}$
= 0 and S are a sum of
${w_{ij}}$
= 0 and S are a sum of ${\rm{\;}}{w_{ij}}$
. The range of MI varies from −1 to +1. A positive value indicates positive spatial autocorrelation, and the neighboring concepts cluster together, while a negative value indicates the opposite. Furthermore, values close to zero indicate complete randomness.
${\rm{\;}}{w_{ij}}$
. The range of MI varies from −1 to +1. A positive value indicates positive spatial autocorrelation, and the neighboring concepts cluster together, while a negative value indicates the opposite. Furthermore, values close to zero indicate complete randomness.
–Standard distance (SD)
Standard distance (SD) measures the amount of absolute dispersion in a concept map, and in this study, it is used to detect deviating concepts in essays by using a formula similar to standard deviation, this feature was also used by Zupanc and Bosnic (Reference Zupanc and Bosnic2017).
 \begin{align}{S_D} = \sqrt {\mathop \sum \nolimits_{k=1}^n \mathop \sum \nolimits_{i=0}^N {{\left( {D_i^k - \overline{D_c^k}} \right)}^2}/N} \end{align}
N, n, ${\rm{\;}}D_i^{}$
, and
${\rm{\;}}D_i^{}$
, and $ \overline{D_c^k}$
in Equation (2) have the same meaning as Equation (1) because it is strongly influenced by extreme values like SD; therefore, atypical concepts have a dominant impact on the value of this feature.
$ \overline{D_c^k}$
in Equation (2) have the same meaning as Equation (1) because it is strongly influenced by extreme values like SD; therefore, atypical concepts have a dominant impact on the value of this feature.
–Mean of PageRank value (MPR)
PageRank (PR) (Brin and Page Reference Brin and Page1998) is a powerful ranking algorithm that is applied to aggregate website link choices. In a concept map, for the $i$
node, the more nodes are linked to
$i$
node, the more nodes are linked to ${\rm{\;}}i{\rm{\;}}$
, and the larger the PR value of the node linked to
${\rm{\;}}i{\rm{\;}}$
, and the larger the PR value of the node linked to ${\rm{\;}}i$
, the larger the PR value of node
${\rm{\;}}i$
, the larger the PR value of node ${\rm{\;}}i$
will be. Given a concept map structure, concepts with closer probabilities to the main idea tend to be more visited. That is, a concept that is related to the main idea in the essay tends to have very high connectivity, which means a high PR value, and an aggregate concept pattern close to the main idea will form.
${\rm{\;}}i$
will be. Given a concept map structure, concepts with closer probabilities to the main idea tend to be more visited. That is, a concept that is related to the main idea in the essay tends to have very high connectivity, which means a high PR value, and an aggregate concept pattern close to the main idea will form.
According to the algorithm of PR, its value is also influenced by a number of concepts in the concept map. A concept map with more concepts will obtain a smaller PR value than a concept map with fewer concepts, even if the two concepts have the same linking structure. For this reason, the original PR value is multiplied by the total number to produce a normalized PR value (Somasundaran et al. Reference Somasundaran, Riordan, Gyawali and Yoon2016). Besides, because normalized PR values tend to be small numbers, the researchers made negative log versions for all normalized PR values (hereafter referred to as PR value). Finally, a feature corresponding to the mean PR value was computed for a concept map.
2.2.2 Local convergence
The degree of local convergence is mirrored by the degree of correlation among the different parts of a concept map. For example, the concept map for an essay with a clear but not well-supported main idea may show more segmentation and be divided into several subgraphs that are not related to each other or have low correlation. In this study, Gettis’s G maximum number of clusters and the transitivity of the concept map are adopted to describe the degree of local cohesion.
–Local Gettis’s G (LG)
In this study, the local Gettis’s G is used to examine idea cohesion at a local scale. Global autocorrelation statistics may obscure the fact that local spatial autocorrelation is negative in space. Thus, analyzing whether some positions in the concept map are negatively correlated in space is interesting, because concepts with negative spatial autocorrelation may be weakly related to the main idea of the whole composition. Similar to Zupanc and Bosnic (Reference Zupanc and Bosnic2017), the researchers calculated Gettis’s G for a 300-dimensional semantic space, where N, n, k, ${\rm{\;}}D_i^k$
,
${\rm{\;}}D_i^k$
, $\;{\rm{and\;}}{w_{ij}}$
have the same meaning as in Equation (1), and the larger the value of Gettis’s G is, the greater the likelihood of local aggregation:
$\;{\rm{and\;}}{w_{ij}}$
have the same meaning as in Equation (1), and the larger the value of Gettis’s G is, the greater the likelihood of local aggregation:
 \begin{align}Gettis's\ G=1/n\sum_{k=1}^{n}\left[\sum_{i}^{N}\sum_{j=1}^{N}w_{ij}D_{i}^{k}D_{j}^{k}\bigg/\sum_{i=1}^{N}\sum_{j=1}^{N} D_{j}^{k}D_{j}^{k}\right]\end{align}
–Number of maximal cliques (NMC)
In graph theory, a clique is a set of vertices with edges between them. In a graph, if a clique is not contained by any other clique, then it is not a true subset of any other clique, and it is a maximal clique on the graph. In a concept map, concepts in a maximal clique tend to point to common ideas, and these concepts have common characteristics. At the same time, the concepts in a maximal clique are more or less connected with other concepts in the clique. Each maximal clique is a relatively aggregated unit on the graph, and the connections between the different maximal cliques are relatively loose.
–Graph transitivity (GT)
Transitivity is the main concept for many relational structures. In a graph, the calculation method is the fraction of all possible triangles which are in fact triangles, and possible triangles are identified by the number of “triads” that have two edges with a common vertex. Transitivity measures the probability that the adjacent vertices of a vertex are connected. Nafa et al. (Reference Nafa, Khan, Othman and Babour2016) proposed that the semantic graph transitivity (GT) can be used to discover hidden cognitive relationships among knowledge units. Two concepts that connect to the same concept are likely to connect, the stronger the transitivity of the concept map, the closer the relationship between the pairs of concepts.
2.2.3 Distance between nodes
The changes and developments in the concepts or exemplifications presented in compositions reflect the compactness coherence between contexts. Zupanc and Bosnic (Reference Zupanc and Bosnic2017) use similar metrics based on transforming sequential essay parts to access the coherence of essays.
–Average distance between connected points (DCP)
Connected points refer to the pair of points with an edge between them. For each concept map, the sum of all the Standard Euclidean distances are measured based on word2vec between two connected concepts and then dividing it by the number of connected concept pairs.
–Average distance to the nearest neighbor (DNN)
For a particular concept, the average distance to the nearest neighbor (DNN) is the average distance from each concept to its nearest connected concept. The Standard Euclidean distances are measured based on word2vec between a concept and its nearest neighbor.
–Average distance between any two points (DAP)
The average distance between any two points (DAP) is another metric to measure how well and fast ideas are developed in a composition. This number is represented as the average Standard Euclidean distance between all paired nodes in a concept map.
In addition, three reference features were computed only for accessing the value of the word embeddings in terms of system performance. We replaced the measures based on the Standard Euclidean distance between word2vec vectors with the word-based distance measures (Wu and Palmer Reference Wu and Palmer1994) using Cilin. This is the corresponding formula:
 \begin{align}si{m_{LC}}\left( {{c_1},{c_2}} \right) = \left( {2 \times depth\left( {lso({c_1},{c_2})} \right)} \right)\Big/\left[ {len\left( {{c_1},{c_2}} \right)+2 \times depth\left( {lso\left( {{c_1},{c_2}} \right)} \right)} \right]\end{align}
Equation (4) $depth\left( {{c_i}} \right)$
indicates the depth of the concept
$depth\left( {{c_i}} \right)$
indicates the depth of the concept ${c_i}$
in Cilin, and
${c_i}$
in Cilin, and $len\left( {{c_1},{c_2}} \right)$
is the shortest distance between the concepts
$len\left( {{c_1},{c_2}} \right)$
is the shortest distance between the concepts ${{\rm{c}}_1}$
and
${{\rm{c}}_1}$
and ${c_2}$
(calculated by the number of edges), and
${c_2}$
(calculated by the number of edges), and $lso\left( {{c_1},{c_2}} \right)$
refers to the deepest common parent node of
$lso\left( {{c_1},{c_2}} \right)$
refers to the deepest common parent node of ${{\rm{c}}_1}$
and
${{\rm{c}}_1}$
and ${c_2}$
in Cilin. Then, three reference features (denoted as
${c_2}$
in Cilin. Then, three reference features (denoted as $DC{P^{\prime}}$
,
$DC{P^{\prime}}$
, $DN{N^{\prime}},\;$
and
$DN{N^{\prime}},\;$
and $DA{P^{\prime}}$
), which correspond to the above three features (DCP, DNN, and DAP), are generated.
$DA{P^{\prime}}$
), which correspond to the above three features (DCP, DNN, and DAP), are generated.
2.2.4 Similarity to the high-scoring essays’ concept maps
After drawing lessons from the Chinese composition similarity analysis method of LSA (Cao and Yang Reference Cao and Yang2007) (based on the edge matching method in graphs), the matching degree between concept graph structures is calculated to represent the similarity between texts in this study.
In this study, the high-scoring compositions refer to the highest-scoring essays written by students for each prompt in the training set (i.e., idea score of 6 in prompts 1, 2, and 3, and score of 4 in prompts 4, 5, and 6), and each prompt gets a subset of high-scoring essays. Each subset of high-scoring compositions is mapped into a large concept map via a similar method discussed in Section 2.1. Then, the concept map for each target essay in a prompt is compared with the same large concept map for this prompt to calculate the similarity between the target essay and the high-scoring compositions. It is assumed that the more the edge structures of the two concept maps repeat, the greater the similarity. Lastly, the information (nodes, edges, and weights) drawn from the target essay and the high-scoring essay subsets are used to calculate the similarity.
–Number of common nodes (NCN)
The number of common nodes (NCN) is the number of identical nodes in the concept map of a particular composition and the concept map of the high-scoring composition from the same prompt.
–Number of common edges (NCE)
The number of common edges (NCE) is the number of identical edges in the concept map of a particular composition, and the concept map of a corresponding high-scoring composition.
–Edge similarity (ES)
The edge similarity (ES) calculation formula used in this study is as follows:
 \begin{align}{\rm{Similarity}}\left( {C{M_i},C{M_H}} \right) = {m_c}/{\rm{min}}\left( {C{M_I},C{M_H}} \right)\end{align}
In Equation (5), the similarity between a concept map $\left( {C{M_i}} \right)$
, and a concept map from a high-scoring essay set (
$\left( {C{M_i}} \right)$
, and a concept map from a high-scoring essay set ( $C{M_H}$
) is noted as
$C{M_H}$
) is noted as ${\rm{similarity\;}}\left( {C{M_i},C{M_H}} \right)$
, which is taken as the similarity between an essay
${\rm{similarity\;}}\left( {C{M_i},C{M_H}} \right)$
, which is taken as the similarity between an essay $({e_i}){\rm{\;}}$
and high-scoring essays.
$({e_i}){\rm{\;}}$
and high-scoring essays. ${m_c}$
is the number of the identical edges of
${m_c}$
is the number of the identical edges of $C{M_i}$
and
$C{M_i}$
and $C{M_H}$
, and
$C{M_H}$
, and ${\rm{min}}\left( {C{M_i},C{M_H}} \right)$
is the minimum number of edges of
${\rm{min}}\left( {C{M_i},C{M_H}} \right)$
is the minimum number of edges of $C{M_i}$
and
$C{M_i}$
and $C{M_H}$
.
$C{M_H}$
.
3. Implementation and evaluation
3.1 Data
Experiments were performed on six different prompts (essay topics) using six different datasets. The essays used in this experiment are from ATQE 2016 writing tasks and were written by eighth-grade middle school students. The writing task required students to write a composition based on a specific topic. Students have to focus on expressing the main idea and supporting it with exemplifications and details. The datasets in this study contain student essays from six different prompts; the first three prompts included different writing genres (persuasive, expository, or narrative). The topics of these three prompts in the sequence are “Companionship is the best gift,” “If given another chance,” and “Something hard to forget.” The last three prompts (4, 5, and 6) are practical writing: prompt 4 is a notification for an event, prompt 5 is a proposal to save food, and prompt 6 is a letter to your teacher. Appendix A shows the translation of prompt 1 into English.
Human raters of large-scale examinations usually need to have certain qualifications. The essay raters that participated in this study were mainly composed of teachers, teaching researchers, and graduate students. All the raters have experience with scoring and received face-to-face on-site training before scoring essays for this research project. The training mainly included scoring rules, composition examples, scoring practice, and final assessments. The assessment samples used in training constituted typical student responses. These essays were given benchmark scores by the expert committee in advance. If a rater’s score differed greatly from the benchmark score, he or she did not pass the assessment and needed to be retrained. The raters who passed the assessment are qualified to formally score compositions independently. The ideas of each essay in the examination were rated by two human raters on an integer scale of 1 to 6 (poor (1) to excellent (6)) for prompts 1, 2, and 3, and on an integer scale of 1 to 4 (poor (1) to excellent (4)) for prompts 4, 5, and 6. If there was a notable discrepancy between scores, the expert raters arbitrated the discrepancy. Compositions needed to be arbitrated by experts on average of 2–3% of the time. It is noted that the score after arbitration was used as the reporting score for the test rather than used in this study. Inter-rater reliability was calculated using quadratic weighted kappa (QWK) (Cohen Reference Cohen1968). QWK for the six prompts are as follows: 0.75, 0.71, 0.74, 0.79, 0.76, and 0.80, which is considered acceptable.
Each dataset was divided into training and test sets, and the ratio of the training set to the test set was 7:3. The training set was used to develop the scoring model, and the test set was utilized to predict the scores and evaluate the prediction accuracy. Table 3 reports the characteristics of each dataset.
Table 3. Description of the training set and test set

SD = standard deviation.
3.2 Prediction model
A multiple linear regression (MLR) model was adopted to predict the idea scores in this study for three reasons:
-
(1) The first human scores (hereafter referred to as H1) available for each essay were used to train the MLR model. The MLR generated a continuous value prediction for the score. If a prediction was outside the range of the scale (such as a predicted score above 6 or less than 1), it was assigned the value of the nearest score point. Scores predicted by MLR can be used to assess how much a student has progressed in their writing ability. The kappa measurements of agreement (introduced in Section 3.4) were calculated between the MLR predicted scores, which were rounded to the nearest integer and the human scores.
-
(2) The researchers sought to use meaningful features to evaluate the ideas of an essay instead of dealing with a large number of variables that are more difficult to interpret, and MLR is sufficient to handle a relatively small number of variables.
-
(3) With MLR, the researchers were able to explore the importance of features by examining their relative weights in the model. Through this study, it is hoped to construct a relatively stable framework and weighting scheme of features for different writing tasks. Hence, we investigated whether the prediction accuracy of the regression models trained on the different prompt sets is stable across six datasets and assess the relative importance of features, which is useful to improve the standardization, interpretability, and generalizability of AEE.
After considering these reasons, a multiple regression model was used to predict the ideas score.
3.3 Baseline
3.3.1 Fine-tuning BERT
This study used two baselines, the bidirectional transformer architecture (BERT) model, which is pretrained and fine-tuned on our data, and the Coh-Metrix. They served as the baselines to compare the performance of the concept map-based features.
The field of NLP research has been dominated by deep neural network research, such as the BERT model, which has proven to have great advantages in other fields. BERT is a pretrained language model that has been proven effective in various NLP tasks. The use of neural models for automatic essay scoring is still in the initial exploratory stage (Rodriguez, Jafari and Ormerod Reference Rodriguez, Jafari and Ormerod2019; Mayfield and Black Reference Mayfield and Black2020). Neural models use a large amount of existing text data to pretrain multi-layer neural networks with context-sensitive meaning. They also contain more than 100 million parameters that are then fine-tuned to a specific new labeled dataset and used for classification or prediction.
In our work, we use training data to fine-tune a pretrained BERT model (Devlin et al. Reference Devlin, Chang, Lee and Toutanova2019) that produced a 768-dimensional embedding based on a network.Footnote e For texts, BERT tokenizes them using predefined vocabulary and then generates the input sequence by concatenating a [CLS] token, tokenized text and a [SEP] token. Generally, the hidden state corresponding to the [CLS] token is used as the text representation of the input text (Devlin et al. Reference Devlin, Chang, Lee and Toutanova2019). Here we have to truncate a small number of essays longer than 512 Chinese characters since it is the maximum the BERT can process, which is mostly in datasets 1, 2, and 3. For the regression task in this study, a specific linear layer is used on top of BERT to obtain a value prediction, and BERT is fine-tuned together with the linear layer by the Adam optimizer, the set learning rate is 0.00001. In addition, we train the network by concatenating features derived from the concept maps with the text representation produced by BERT to compare the performance of the BERT model without the proposed features. The technical contribution of these baselines is to investigate the performance of the fine-tuned BERT model with our training data and whether a fine-tuned BERT model would offer different performances with and without using concept-map-based features.
3.3.2 Coh-Metrix features
Coh-Metrix, which was first used for text analysis of reading comprehension, is an online English text analysis system developed by the University of Memphis. Coh-Metrix has been widely used in various fields of research and represents the current mature level of text mining (Graesser et al. Reference Graesser, Mcnamara, Louwerse and Cai2004; Zedelius, Mills and Schooler Reference Zedelius, Mills and Schooler2018) and automated essay scoring (Aryadoust and Liu Reference Aryadoust and Liu2015; Mo Reference Mo2018; Latifi and Gierl Reference Latifi and Gierl2020; Shin and Gierl Reference Shin and Gierl2020). In this study, a Chinese Coh-Metrix feature system, inspired by English Coh-Metrix, was developed. It contains 68 features under 8 dimensions of language characteristics. Appendix B has an explanation of the computational features for Chinese. This study investigated how a feature set drawn from concept maps performs in comparison to the Coh-Metrix baseline.
3.4 Evaluation
The evaluation of AEE includes the prediction accuracy and quality analysis of AECC-I. Since an important goal of AEE is to imitate human scoring, the more accurate the model, the closer the two scores will be. For accessing the accuracy of the proposed AECC-I system, the following statistical measurements were used.
3.4.1 Quadratic weighted kappa (QWK)
In 1960, Cohen proposed that the kappa value can be used as an indicator for rating the consistency of graders and has been widely used in practice ever since. The kappa value ranges from 0 (random agreement between raters) to 1 (complete agreement between raters). In general, a kappa value of 0.7 is an acceptable minimum in essay scoring (Ramineni and Williamson Reference Ramineni and Williamson2013) since it explains nearly half of the scoring variation. The QWK takes into account the degree of difference between different scores (Fleiss and Cohen Reference Fleiss and Cohen1973). For example, the difference between 1 point and 4 points is much larger than that between 1 and 2 points. In this study, the QWK was computed to investigate the agreement between automated scoring and human scoring. QWK is given by:
 \begin{align}{\rm{QWK}}=1 - {\sum _{i,j}}{w_{i,j}}{O_{i,j}}/{\sum _{i,j}}{w_{i,j}}{E_{i,j}}\end{align} $w$
are weights calculated as:
$w$
are weights calculated as:
 \begin{align}{w_{i,j}} = {\left( {i - j} \right)^2}/{\left( {r - 1} \right)^2}\end{align}
where O is the confusion matrix of observed H1 counts and predicted scores and E is the confusion matrix of expected H1 counts and predicted scores based on chance. The index i and j refer to a rating of the H1 i score point and a score point j by the AEE. The variable r is the number of rating categories.
–Adjacent agreement measure
This measurement is defined as the percentage of essays that were scored equally and similarly (usually within one point) by human raters and the AEE system.
To investigate the internal structure of the feature set, a correlation analysis was applied (Subsection 4.2.1) to investigate the relation between features and scores, and applied factor analysis (Subsection 4.2.2) was used to explore the latent components of construct measured by these features.
4. Results and discussion
4.1 Concept map-based AEE system accuracy
The following three different models were compared to evaluate if concept-map-based features could yield better model performance for automated scoring ideas:
-
(1) Automated scoring for the ideas using a fine-tuned BERT model without concept-map-based features. The baseline is denoted as ${\rm{\;}}{M_B}$
;
${\rm{\;}}{M_B}$
; -
(2) Automated scoring for the ideas using a fine-tuned BERT model that combines concept-map-based features. The baseline is denoted as
$\;{M_{B + CM}}$
; -
(3) Automated scoring for ideas using only Coh-Metrics features (listed in Appendix B, Table E.1). The baseline features are denoted as
${\rm{\;}}{M_{Coh}}$
; -
(4) Automated scoring of the ideas used features from concept maps (listed in Table 2), and this scoring model is denoted as
${\rm{\;}}{M_{CM}}$
. Furthermore, the models corresponding to the four feature subsets under
${M_{CM}}$
are denoted as
${M_{CM - c}}$
(features of global cohesion of ideas: MI, SD, and MPR),
${M_{CM - l}}$
(features of local cohesion of ideas: LG, NMC, and GT),
${M_{CM - d}}$
(features of idea development: DCP, DNN, and DAP), and
${M_{CM - s}}$
(features of similarity to high-scoring essays); -
(5) To assess the value of the embedding vector in terms of system performance, the features that do not rely on word embeddings in Table 2 are used to build a model. They are denoted as
${\rm{\;}}{M_{C{M^{\prime}}}}$
and are compared to
${M_{CM}}$
, which does rely on embeddings. Accordingly,
${M_{C{M^{\prime}}}}_{ - c}$
is built on the features of MI and SD;
${M_{C{M^{\prime}}}}_{ - l}$
is built on the features of NMC and GT. Since the feature group of “Distance between nodes” is all based on word embeddings,
${M_{C{M^{\prime}}}}_{ - d}$
is built on reference features of
$DC{P^{\prime}}$
,
$DN{N^{\prime}}$
,and
$DA{P^{\prime}}$
(described in Section 2.2). These features use the word distance measurements based on Cilin rather than word embeddings, while
${M_{CM - s}}$
, which does not use distance measurements, is preserved. -
(6) Both concept map features
${M_{CM}}$
and Coh-Metrics were used for scoring ideas, and the scoring model for ideas is denoted as
${\rm{\;}}{M_{CM + }}$
.


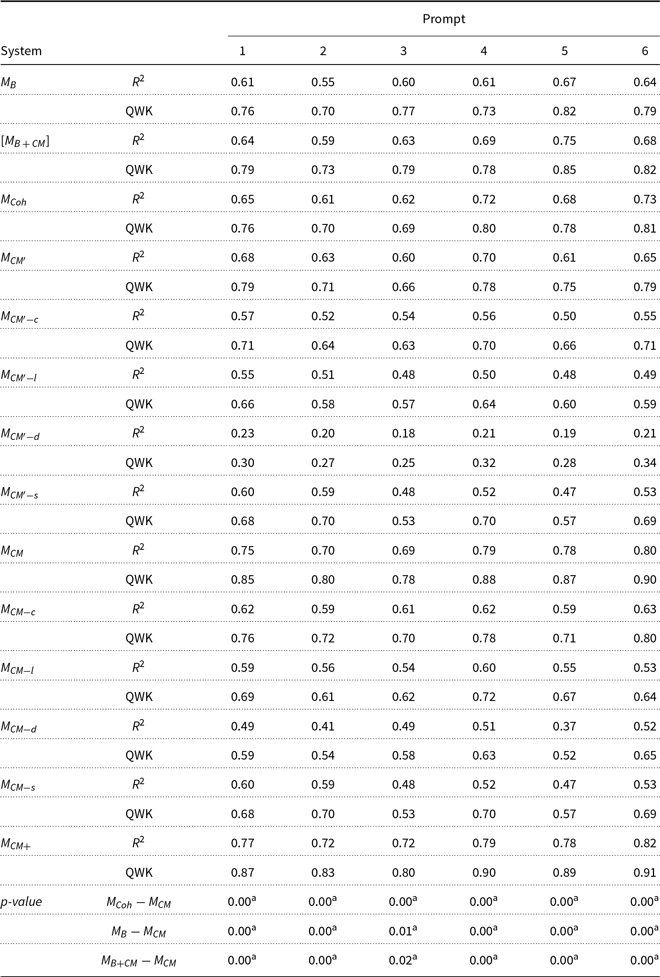
Table 4 reports the R2 and QWK values of the various models for ideas scoring. R2 is the fraction of the variance in the data that are explained by the regression, and the values range from 0 to 1. The closer the value is to 1, the stronger the explanatory power and the better the model fit. The results show that all QWK values from the ${M_{CM}}$
model are in the range of 0.77 to 0.90 on the six datasets.
${M_{CM}}$
model are in the range of 0.77 to 0.90 on the six datasets.
Table 4. The R2 for multiple linear regression and QWK value (Quadratic-weighted kappa between automated and human scoring) for the feature sets for ideas scoring on the test set
p-value 0.05.
The $\;{M_{CM}}$
model outperformed the Coh-Metrics baseline in all datasets, and the QWK values were about 8–10% higher than the QWK values of
$\;{M_{CM}}$
model outperformed the Coh-Metrics baseline in all datasets, and the QWK values were about 8–10% higher than the QWK values of ${\rm{\;}}{M_{Coh}}$
. When the concept map features were added to the Coh-Metrics features, there was a prominent boost in performance (more than 10%). Relatively, the Coh-Metrics baseline did not substantially improve the performance of
${\rm{\;}}{M_{Coh}}$
. When the concept map features were added to the Coh-Metrics features, there was a prominent boost in performance (more than 10%). Relatively, the Coh-Metrics baseline did not substantially improve the performance of ${M_{CM + }}$
.
${M_{CM + }}$
.
It is noted that both BERT models ( $\;{M_B})$
achieve approximately the same performance as the Coh-Metrix feature-based model; however, our data show that the BERT models did not perform better than the concept map feature-based models on most prompts. Even the models combined with the concept map-based features(
$\;{M_B})$
achieve approximately the same performance as the Coh-Metrix feature-based model; however, our data show that the BERT models did not perform better than the concept map feature-based models on most prompts. Even the models combined with the concept map-based features( ${M_{B + CM}})$
only exceeded
${M_{B + CM}})$
only exceeded ${M_{CM}}$
by 0.01 QWK on prompt 3. It is generally believed that the relative performance of a fine-tuned BERT model depends on the similarity between the pretraining task and the target task. So, a possible explanation for this result is that the knowledge learned by our BERT models has a limited ability to access the quality of ideas in essays. For long essays (prompts 1, 2 and 3), the BERT models leave out some words, which may cause accuracy problems because some of the semantic information is lost; for short essays, the semantic differences among essays are relatively small, but the global organization and structure of the concepts may show distinctions.
${M_{CM}}$
by 0.01 QWK on prompt 3. It is generally believed that the relative performance of a fine-tuned BERT model depends on the similarity between the pretraining task and the target task. So, a possible explanation for this result is that the knowledge learned by our BERT models has a limited ability to access the quality of ideas in essays. For long essays (prompts 1, 2 and 3), the BERT models leave out some words, which may cause accuracy problems because some of the semantic information is lost; for short essays, the semantic differences among essays are relatively small, but the global organization and structure of the concepts may show distinctions.
We also noticed a result that was not expected. A simple combination of proposed features and the BERT model presented small improvements of 0.02–0.05 QWK compared to the BERT models without additional features. Here, we do not claim that our results are the best results that BERT fine-tuning can achieve. A more sophisticated combination would likely yield better results via optimization since the complexity of hyperparameter and curriculum learning for transformers could be improved on larger training datasets.
Table 4 also reports the performance of the four smaller feature set models. The QWK values of ${M_{CM - c}}$
are the best-performing individual small feature set and is basically equal to that of
${M_{CM - c}}$
are the best-performing individual small feature set and is basically equal to that of ${\rm{\;\;}}{M_{Coh}}$
, while the performance of the other three models are ranked from highest (1
st
) to lowest (3
rd
):
${\rm{\;\;}}{M_{Coh}}$
, while the performance of the other three models are ranked from highest (1
st
) to lowest (3
rd
): $1{\rm{st}}.\;\;{M_{CM - l}},{\rm{\;}}2nd.\;\;{M_{CM - d}}$
, and
$1{\rm{st}}.\;\;{M_{CM - l}},{\rm{\;}}2nd.\;\;{M_{CM - d}}$
, and $3rd.\;{M_{CM - s}}$
. This confirms the hypothesis that the feature sets for the global cohesion of ideas give the best performance for scoring ideas.
$3rd.\;{M_{CM - s}}$
. This confirms the hypothesis that the feature sets for the global cohesion of ideas give the best performance for scoring ideas.
In order to assess the value of the word embeddings used in the features extracted, the performance of ${\rm{\;}}{M_{C{M^{\prime}}}}$
is compared with
${\rm{\;}}{M_{C{M^{\prime}}}}$
is compared with ${\rm{\;}}{M_{CM}}$
. The QWK values of
${\rm{\;}}{M_{CM}}$
. The QWK values of ${\rm{\;}}{M_{CM}}$
are all higher than
${\rm{\;}}{M_{CM}}$
are all higher than ${M_{C{M^{\prime}}}}$
in a range of 6–12%. The feature group based on embeddings used in
${M_{C{M^{\prime}}}}$
in a range of 6–12%. The feature group based on embeddings used in ${M_{CM - d}}$
has the greatest improvement in terms of model performance. Compared with the Cilin-based word distance features in
${M_{CM - d}}$
has the greatest improvement in terms of model performance. Compared with the Cilin-based word distance features in ${M_{C{M^{\prime}}}}_{ - d}$
, the embeddings-based features in
${M_{C{M^{\prime}}}}_{ - d}$
, the embeddings-based features in ${M_{CM - d}}$
have approximately doubled the performance of
${M_{CM - d}}$
have approximately doubled the performance of ${M_{C{M^{\prime}}}}_{ - d}$
. While the PR feature in the global convergence feature group performs best, after the other two features based on embeddings were added to the model, the QWK values are improved by 5–9 points on the six datasets. In the local convergence feature group, the only feature-based on embeddings (LG) increased the KAPPA value of the model based on the two features (NMC, GT) by 3–7%.
${M_{C{M^{\prime}}}}_{ - d}$
. While the PR feature in the global convergence feature group performs best, after the other two features based on embeddings were added to the model, the QWK values are improved by 5–9 points on the six datasets. In the local convergence feature group, the only feature-based on embeddings (LG) increased the KAPPA value of the model based on the two features (NMC, GT) by 3–7%.
In this study, the exact agreements and the exact-plus-adjacent agreements were calculated. Table 5 shows that the exact agreements for ${M_{CM}}$
and
${M_{CM}}$
and ${M_{CM + }}$
are all higher than the human raters. The distribution of
${M_{CM + }}$
are all higher than the human raters. The distribution of ${M_{CM}}$
is closer to the human scores than the baseline model, while
${M_{CM}}$
is closer to the human scores than the baseline model, while ${M_{CM + }}$
is the closest to the human scores.
${M_{CM + }}$
is the closest to the human scores. ${M_{CM}}{\rm{\;}}$
improves the exact agreements with H1 by 3–8% compared to
${M_{CM}}{\rm{\;}}$
improves the exact agreements with H1 by 3–8% compared to ${\rm{\;}}{M_{Coh}}$
. To compare the differences between models, McNemar’s test was used on the exact and exact-plus-adjacent agreements. The results show significant differences in the exact agreements between models
${\rm{\;}}{M_{Coh}}$
. To compare the differences between models, McNemar’s test was used on the exact and exact-plus-adjacent agreements. The results show significant differences in the exact agreements between models ${\rm{\;}}{M_{Coh}}$
and
${\rm{\;}}{M_{Coh}}$
and ${\rm{\;}}{M_{CM}}$
for predicting idea scores.
${\rm{\;}}{M_{CM}}$
for predicting idea scores.
Table 5. The exact (E) agreements and exact-plus-adjacent (E+A) agreements for the six datasets

p-value 0.05.
Figure 3 shows that the distribution patterns of the automated scoring models are roughly the same as human scores. The scores distribution of ${M_{CM}}{\rm{\;}}$
is closer to the human scores. The following studies were conducted using
${M_{CM}}{\rm{\;}}$
is closer to the human scores. The following studies were conducted using ${\rm{\;}}{M_{CM}}$
, and the system AECC-I is based on this model.
${\rm{\;}}{M_{CM}}$
, and the system AECC-I is based on this model.

Figure 3. Comparison of the score distributions between automated and human scoring on two prompts.
4.2 Evaluation of the proposed features
An end-to-end AEE system can achieve high consistency with manual scoring in many cases, but these models do not address the structural validity (Perelman Reference Perelman2012; Condon Reference Condon2013; Rodriguez, Jafari and Ormerod Reference Rodriguez, Jafari and Ormerod2019). AECC-I is based on a rubric’s idea scoring for compositions to ensure that the features used for scoring can cover the dimension of the construct. This allows the feature data inside the AEE to convert into formative feedback information (Zhang et al. Reference Zhang, Magooda, Litman, Correnti, Wang, Matsmura, Howe and Quintana2019) and help students understand why their scores are low.
4.2.1 Correlation analysis
The construct coverage of AEE depends on the internal structure and must have feature sets with a proven ability to evaluate ideas. Applied correlation analysis was used to investigate the relationship between each concept map feature in relation to the idea scores. The following analysis is mainly based on MLR models, and the Pearson correlation coefficient between each feature and ideas score are shown in Table 6. Besides, the composition length tends to affect their scores, as does the scoring of ideas because longer essays are likely to get higher scores. Therefore, the influence of the composition length as a variable was removed, and the partial correlation between other features and scores was calculated. Due to space limitations, only the evaluation of features in prompt 1 and prompt 2 were performed.
Table 6. Correlation and partial correlation (controlling for length) of concept map features with idea scores

**significant at p < 0.01; *significant at p < 0.05.
All the features have high (> 0.5) to low (between 0.1 and 0.3) correlation with the idea scores (significant at p < 0.01). The three global cohesion ideas features are all moderately or highly positively correlated with ideas (p < 0.01). This indicates that the stronger the global cohesion is, the higher the idea scores will be. This is consistent with previous research results (Li et al. Reference Li, Zhou, Luo and Yang2012; Ke, Zeng and Luo Reference Ke, Zeng and Luo2016; Antiqueira et al. 2017). The local Gettis’s G and the number of maximal cliques (NMC) have a negative correlation with the scores, and this means that the more local aggregation in a concept map, the more cliques a concept map will be divided into, and the lower the ideas scores of the composition will be. The GT has a positive correlation with the idea scores, and this suggests better connectivity in a concept map and higher idea scores. All of the idea development features show a positive correlation with scores, and this indicates that the larger the change from point to point in the concept map of composition, the more adequate the development of the ideas in the composition will be, which is consistent with Ke, Zeng and Luo (Reference Ke, Zeng and Luo2016). The three features of similarity in relation to the high-scoring essays all have a positive correlation with the idea scores and are consistent with the researcher’s expectation that the more similar a concept map of a composition is to a high-scoring composition, the higher the ideas score will be. After the composition length effects were removed, all the concept map features affected by composition length had a reduction in correlation with the ideas score (see the Partial Correlation column). Furthermore, no significant correlation with the idea scores in relation to the average distance between connected points, the average distance between any two points on prompt 1, the NMC, and the average distance to the nearest neighbor.
We initially extracted a large number of concept map features; however, the meaning of some features is unclear, and there is a high correlation between some features, which is not conducive for training the MLR model. Therefore, in addition to ensuring the fitting degree of the model, we also considered the following aspects when selecting features: 1) the relationship between the meaning of the feature and the idea’s construct is not contrary to common sense; 2) some features that are not related to the conceptual interpretation of ideas’ quality have been eliminated; 3) some features which are theoretically reasonable but statistically limited are eliminated to try to prevent the problem of multicollinearity, and 4) factor analysis was used to verify the construct validity of the feature set.
4.2.2 Factor analysis
Factor analysis is an important method to validate the scoring construct (Attali Reference Attali2007) by exploring the internal structure of the proposed features.
Table 7 presents the Promax-rotated principal factor pattern for the 12 features for the four-factor solution. The 12 features were grouped into different factors based on their highest loading on the different factors due to structural validity, which is also coincident with what we expected. To show the influence of these four factors on the quality of the ideas more intuitively and concisely, the four factors were named as the main idea factor (measured by the MI, mean of the PR value, and SD features), a local support factor (measured by the Local Gettis’s G, the NMC and GT features), a development factor (measured by the average distance between connected points (DCP), average DNN and the average distance between any two point features), and a similarity factor (measured by the NCN, the NCE and ES features).
Table 7. Factor pattern after Promax rotation for the four factors on prompts 1 and 2 and the factor names are F1 (main idea), F. (local support), F3 (idea development), and F4 (similarity)

4.2.3 Relative importance of features
In order to display the relative importance of the different features in the regression prediction, the contribution of each feature prediction to R2 was calculated. Figure 4 presents the relative importance of the features for the regression models, and the global cohesion feature set of ideas makes the largest contribution. Next, the feature set for local cohesion of ideas and similarity to high-scoring essays. Lastly, the feature set for idea development has the smallest contribution in datasets 1 and 2. For individual features, the mean of the PR value contains the most important features on both prompts. The importance of most features is relatively stable, except for the SD and the features related to similarity.
Table 8 presents the standardized coefficients and p-values of the regression analysis, and the ranking of the standardized regression coefficients of the features and the ranking of the relative weights are similar.
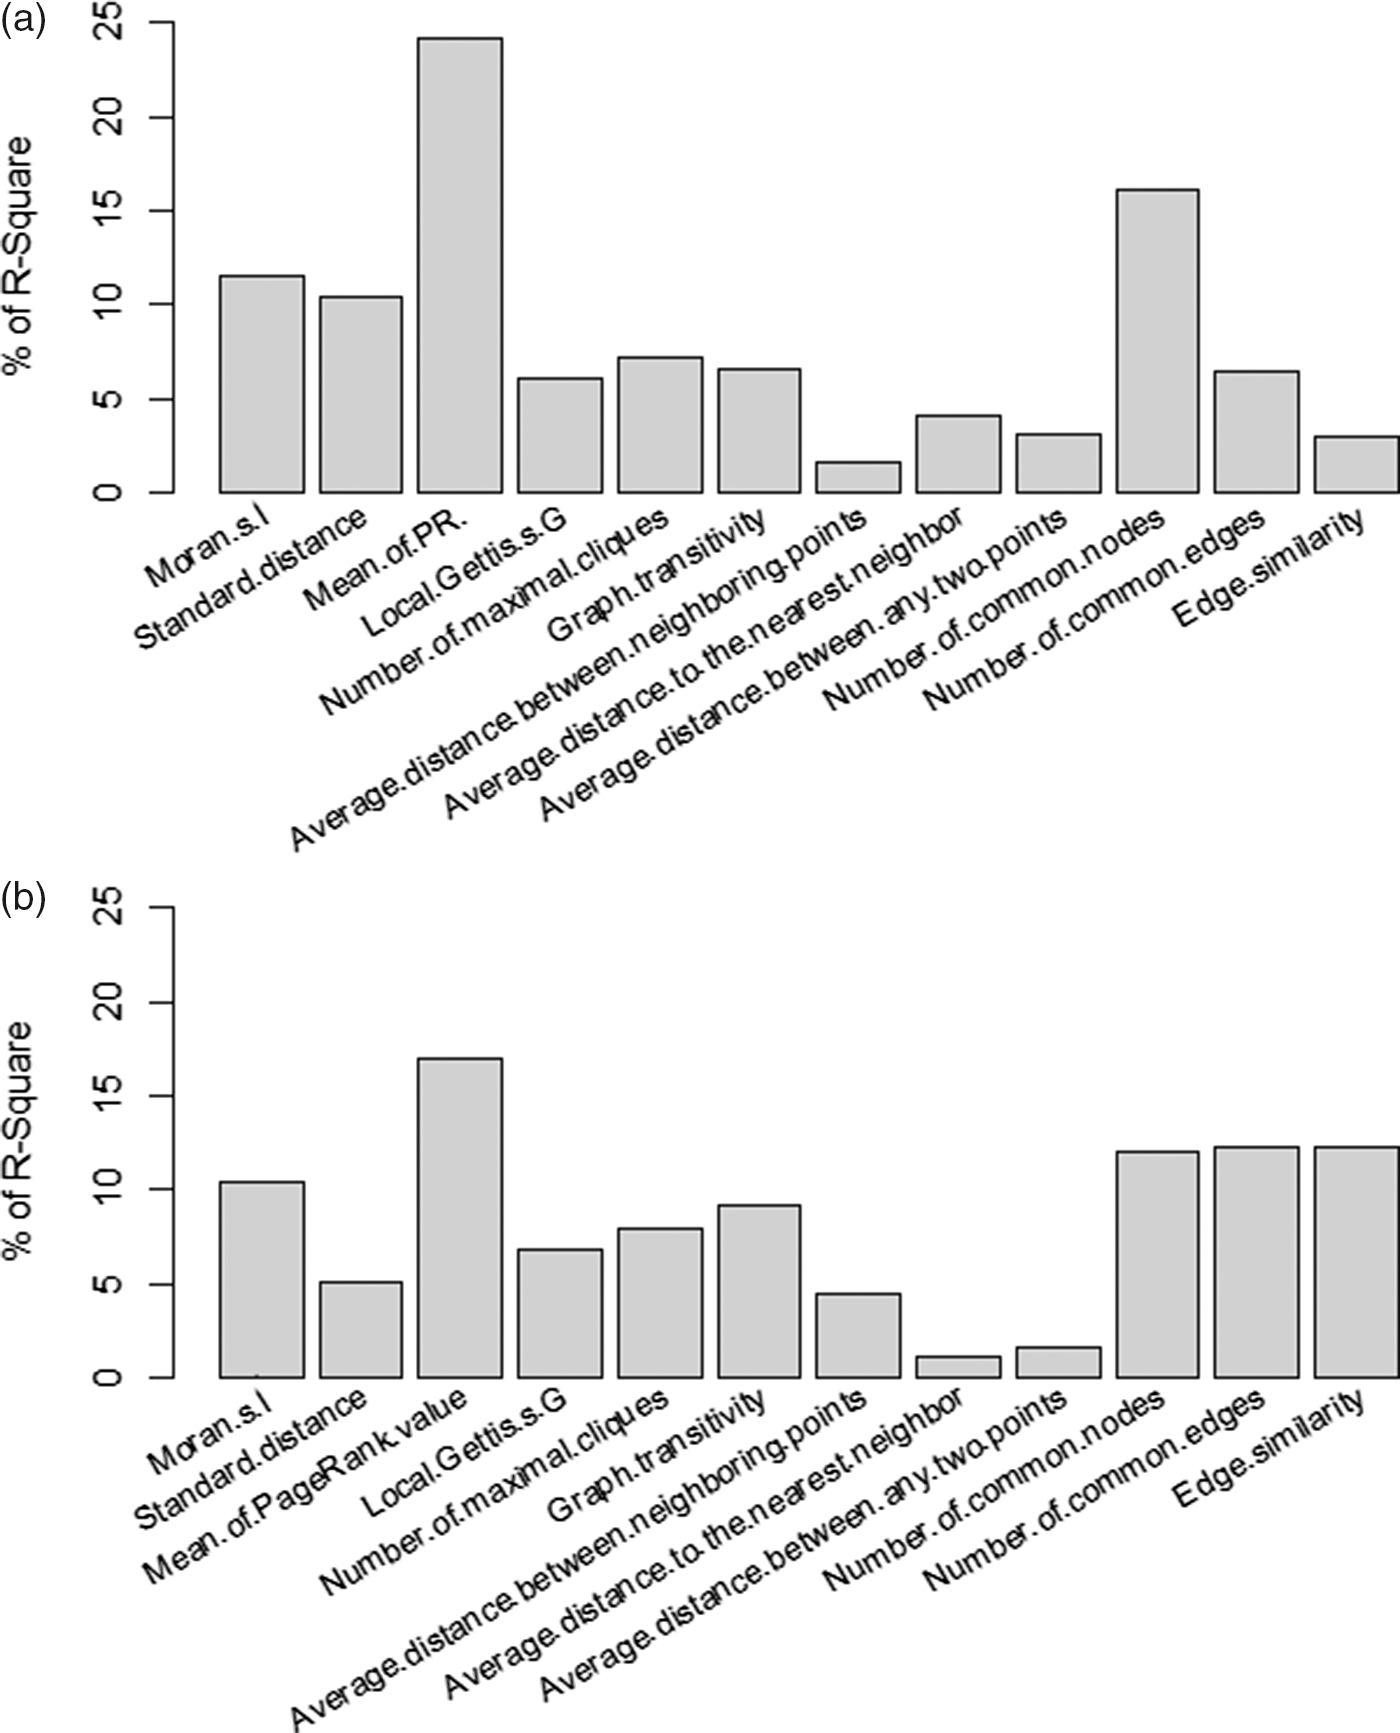
Figure 4. Relative feature importance is expressed as a percent of the total weights from regression for the predicted ideas scores.
Table 8. The regression table for the two prompts with the standardized coefficients and p-values
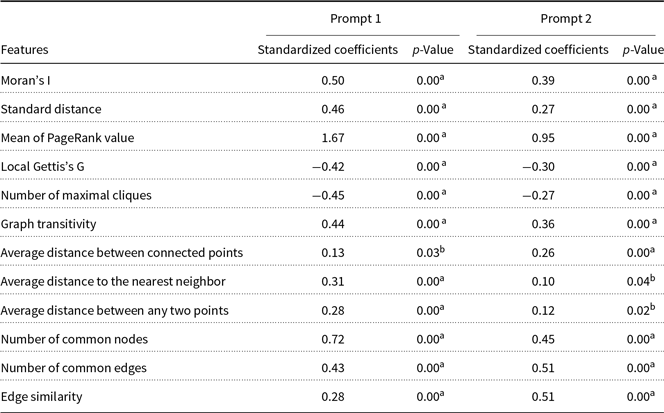
p-Value < 0.01.
p-Value < 0.05.
4.3 Qualitative analysis and smart feedback
4.3.1 Qualitative analysis
To investigate whether concept map features indeed capture the idea characteristics, this study drew on the method of qualitative analysis in Somasundaran et al. (Reference Somasundaran, Riordan, Gyawali and Yoon2016). The contents of the high-scoring essays for prompt 1 (with the topic of “Companionship is the best gift”) were modified in three ways to simulate different defects. These modification methods are used to reduce the quality of composition ideas, obtain lower feature scores, and examine whether the feature scores are sensitive to composition quality. These three modification strategies lead to the scoring change of the first three factors (main idea, local support, and ideas development) described in Subsection 4.2.2. The last similarity factor, which was obtained by comparing it with a high-score composition, is not the characteristics of the composition itself. Therefore, this similarity feature is not included in this part of the analysis. Listed below are the types of compositions generated by the three modification strategies:
-
(1) No main idea: The main idea in this simulated composition is not clear. We found sentences or paragraphs in the composition that are closely related to the central idea and then replaced all the other parts of the composition with this so that the full text contains similar ideas but has no focus. The length of this simulated essay changed a little between before and after the revision;
-
(2) Weak support: Various parts of this simulated essay lack support for the main idea. The ideas and examples in paragraphs two and three were deleted. Therefore, this essay is shorter than the original text.
-
(3) Vague development: This simulated composition presents slower and vaguer idea developments than the original text. To do this, some examples in paragraphs two and three were deleted and replaced with examples from the first paragraph. The length of this simulated essay is basically the same as the original text.
Table 9 presents three types of simulated composition information: the average score for the factor scores before and after, and composition length. The factor score is the weighted average of the standardized values of its associated features, and the weight is the load of the features on the factors in the factor analysis. Model ${M_{CM}}$
was used to predict the idea scores for these simulated compositions (last column in Table 9). The impact of the three factors on the idea scoring ranked as follows from highest to lowest: the main idea, local support, and ideas development. Therefore, the composition scores with different revision strategies were ranked from lowest to highest: no main idea, weak support, and then vague development.
${M_{CM}}$
was used to predict the idea scores for these simulated compositions (last column in Table 9). The impact of the three factors on the idea scoring ranked as follows from highest to lowest: the main idea, local support, and ideas development. Therefore, the composition scores with different revision strategies were ranked from lowest to highest: no main idea, weak support, and then vague development.
Table 9. Factor scores for simulated compositions

Text length = the number of Chinese characters.

Figure 5. The changes of three-factor scores in different types of simulated composition.
Figure 5 intuitively illustrates whether the factor scores are sensitive to changes in the quality of the composition ideas. The same letters are used to represent each original essay, and its transformed version so that the difference in factor scores between the original and their transformed version is demonstrated in the graph. Compared to the original composition, the main idea score for the simulated composition is much lower than that of the original composition for most essays in Figure 5(a). It is interesting that even though the length of the weak supporting composition is shorter than that of the original text, the focus of the composition seems to be clearer than the original text. This indicates that deleting some of the examples in the text made the main idea of the composition better. In Figure 5(b), the score of the weak supporting composition is lower than the score of the original text, while the score of the other two compositions did not change much. For the composition with poor development, the average score of development in Table 9 decreased, but the change in the scatter graph (c) was not obvious. The similarity factor scores are also shown in the table, and they indicate that the manipulations used to produce essays with no main idea, weak support, and vague development also made the resulting essays less similar to the original ones.
This result illustrates that the main idea is the most important factor for ideas scoring, and it is consistent with the factor analysis and satisfies the expectations for idea scoring constructs in Chinese compositions. Moreover, although weak support is the lowest one, the predicted scores are higher than the essay’s labeled no main idea, which is due to the fact that it has been stripped of exemplification information, which strengthens the focus of the text, and it indicates that the concept map features are not easily affected by the text length.
4.3.2 Visual inspection and smart feedback
An inspection of the concept maps (See Figure 6) revealed a clear distinction between poor and excellent ideas in different compositions.

Figure 6. Concept maps made from compositions with idea qualities ranging from excellent to off-topic.
Figure 6(a) depicts a clear and meaningful center in the concept map with excellent ideas because the center of the concept map consists of three key concepts “myself,” “thanks,” and “parents.” Other concept centers connect to the main idea and support it. Similar to the reference essay from Kim’s research (Reference Kim2013), this concept map is highly coherent and connected. Although the word “company” does not appear in the text, the main idea is clearly expressed. From the concept map, it can be inferred that the author is thanking his parents for accompanying him in his growth. This composition will get a high ideas score, according to the rubric of ATQE, because the composition has a well-focused main idea and expresses ideas well and effectively addresses the topic. It should be noted that composition creativity was not evaluated in this study.
In contrast, the concept map drawn from a composition without the main idea does not contain a center with concrete meaning, as shown in Figure 6(b). The concept “myself” has the most relations, but it is meaningless and does not completely express the writer’s position. This suggests that this kind of composition has a poor main idea, even though the composition is rich in ideas and development, so it will get a score below the grade of insufficient response according to the ATQE rubric and receive feedback such as “the position or main idea is very unclear” (excerpt from the ATQE rubric; all excerpts below are all from the ATQE rubrics). Figure 6(c) shows a concept map with weak main idea support because it has more local aggregation and fewer relations to the main concepts (“parents” and “myself”) than Figure 6(a). Figure 6(c) is split into several parts, suggesting it will get a lower score for ideas and feedback such as “provides uneven support for the main idea.” The other type of composition is one with vague ideas development, as seen in Figure 6(d). In this essay, the center is clear and rounded with rich concepts and relations; however, there are many similar concepts, and the relations are too dense, which indicates little variation between concepts and implies that the ideas are not fully developed. This type of essay will get feedback, such as “sentences and words may be simple and unvaried.” The last one is the off-topic composition in Figure 6(e). Here, the key concept (“accompany”) shared few connections with the rest of the concept map, and most of the other concepts make up a subset that is semantically far from the key concept. The result illustrates that the key concept is isolated from the main body of concepts, so it can be identified as an off-topic composition with feedback such as “provides no relevant ideas and content in response to the topic.”
Providing meaningful feedback is of great importance for teachers and students. Systems with feedback can not only help to reduce the scoring load for teachers but can also encourage students to autonomously improve their writing ability. Therefore, the system AECC-I based on concept map can be used in the classroom or at home.
5. Discussion
5.1 General discussion
The findings in this study confirm a basic assumption that the quality of the ideas in essays can be captured by characteristics in concept maps via two aspects. Firstly, the proposed concept map features a framework that can predict the ideas score well, and secondly, more importantly, it also exhibits promising to cover the ideas scoring construct.
This study uses concept maps to supplement the higher-order trait of construct coverage of automated writing evaluations. Ideas of the internal cognition of students during writing are reflected through an intuitive conceptual network structure. Based on this concept map, this study can automatically score the ideas in a student’s composition. Moreover, the concept map feedback is closely related to writing strategies, so it prioritizes writing skills rather than linguistic feedback (Stevens, Slavin and Farnish Reference Stevens, Slavin and Farnish1991).
Our research is largely inspired by Somasundaran et al. (Reference Somasundaran, Riordan, Gyawali and Yoon2016) and Zupanc and Bosnic (Reference Zupanc and Bosnic2017). Somasundaran et al. (Reference Somasundaran, Riordan, Gyawali and Yoon2016) only used two types of features derived from a graph: features based on degree and PR. These features are used to capture idea development and calculate the features without using embedded semantic representations. Our research uses four sets of features, and the first three feature sets are similar to those in Zupanc and Bosnic’s research (Reference Zupanc and Bosnic2017). However, Zupanc and Bosnic (Reference Zupanc and Bosnic2017) used multiple features to predict the holistic scores rather than a specific dimension of ideas, and the nodes in the graph were sequentially overlapping on parts of the essay (a common method of measuring coherence); so, each node had only two neighbors in the graph. By contrast, in our concept map research, nodes are key concepts rather than word types (in Somasundaran et al. Reference Somasundaran, Riordan, Gyawali and Yoon2016) or sequence parts of an essay (in Zupanc and Bosnic Reference Zupanc and Bosnic2017). In terms of semantic representation, we use word2vec embeddings instead of TF-IDF as in Zupanc and Bosnic’s study (Reference Zupanc and Bosnic2017). Also, we proposed a group of similarity features, which was not included in previous studies, to access the ideas by estimating the similarity between an essay and high-scoring essays based on the graph. Furthermore, we expect the four groups of features to have the ability to capture the writing criteria of ideas and demonstrate the strengths and weaknesses of an essay (as illustrated in Figure 6). For example, it is more meaningful and easier to understand feedback that contains valuable insight rather than just pointing out semantic inconsistencies or grammar errors. These findings require further verification, but it is encouraging that the evaluation of ideas can be predicted using computational features based on a concept map created from a composition. To a certain extent, this study adopts a hypothesis-driven method and selects specific concept-based features that are assumed to aid in evaluating ideas. Our hypothesis method can be replaced by other theoretical hypotheses; however, judging from the research results so far, these hypotheses need to be further verified.
It is noted that this study hopes to distilled concepts that are as close as possible to the content of an essay so that each node in the graph can represent or be close to a concept rather than a word (Ke, Zeng and Luo Reference Ke, Zeng and Luo2016; Somasundaran et al. Reference Somasundaran, Riordan, Gyawali and Yoon2016). The process of concept recognition includes filtering stop words, coreference resolution, and merging synonyms. These recognitions are a key step to merge words that have the same (or very similar) semantics. Generally speaking, the more complex a concept is, the higher the level of abstraction, so we need to make a trade-off between complexity and generality to define a concept. This study takes word types that appear the most in the corpus and consider it as the standard word type to represent a synonym word group. As a result, we mainly used the word types close to the leaf nodes in the thesaurus tree as the concepts, so the degree of abstraction and complexity of the concepts are often not high. In the future, improving the degree of concept abstractions is a direction of our research, and we hope to investigate the relationship between highly abstract concepts and the quality of ideas.
Moreover, this approach is it is not limited by genre or argument, which is very important for large Chinese writing assessment projects. The previous research on automatic scoring for Chinese compositions lacks a general and stable scoring feature system (Zhang and Ren Reference Zhang and Ren2004; ; Cao and Yang Reference Cao and Yang2007; Xu et al. Reference Xu, Chen, Wu and Xie2015; Liu, Qin and Liu Reference Liu, Qin and Liu2016; Fu et al. Reference Fu, Wang, Wang, Hu and Liu2018; Zhong and Zhang Reference Zhong and Zhang2019), and the relationship between features and scoring criteria is vague or difficult to explain. This makes it difficult to support model validity and is not conducive to the application and promotion of automatic scoring systems in practice. The three datasets (prompts 1, 2, and 3) did not restrict genres (description, narration, and argumentation), with relatively broad and unclear topics, as students decide their composition’s main idea and organizational flow. Therefore, the proposed model should be adaptable to a composition set with multiple writing focuses, rather than just evaluating the argument for a specific idea.
5.2 Relationship with AM-based automatic essay scoring
Although concept mapping is not a new technology, previous studies have shown that the local and global network structure of the text can indeed show interesting and different patterns between different types of individuals and groups (Qiao and Hu Reference Qiao and Hu2020). The focus of our work is to distinguish these differences and to rank them from high to low. Compared with AM research, this is a relatively robust rating. In the context of essay scoring, the profound significance of AM research lies in explaining “why” from an argumentative point of view. For example, which AM technology-based features base contribute to the persuasive strength of the composition, and how complex concepts constitute the argument structure. In fact, a well-written and persuasive essay often clearly states the author’s point of view and supports their position by evoking relevant ideas and concepts. However, one of the main challenges of AEE is the inability to use specific prompt-specific models to evaluate new topics (Attali Bridgeman and Trapani Reference Attali, Bridgeman and Trapani2010; Lee Reference Lee2016), few researchers have made progress on general essay scoring (Mayfield and Black Reference Mayfield and Black2020). Unlike the AM method, the concept map-based method and BERT are better suited for new topics. Although the method in this study may be a simplified solution to access the quality of ideas compared with the argument mining-based method to access the quality of ideas, it may also reduce the complexity of identifying argument components and relationships, while still being able to investigate the “why” based on the argument mining. Considering the generalizability, timeliness, and fairness of language tests, the concept map-based method still has great potential. The starting points of the two research methods may be different, but the two methods are not incompatible. We are also very pleased to see that the latest research applies graphical representation to argument recognition (Dumani et al. Reference Dumani, Biertz, Witry, Ludwig, Lenz, Ollinger, Bergmann and Schenkel2021) and are looking forward to applying this method to further the automatic assessment of the quality of ideas research.
5.3 Comparison with automatic essay scoring based on BERT model
While neural networks have reduced the costs of feature engineering in automated essay scoring, the cost to fine-tune BERT models to achieve satisfactory performance has increased, especially with limited training data. To some extent, this may be a problem of value orientation; so the shift to deep neural models needs to take into consideration the price (Mayfield and Black Reference Mayfield and Black2020). In psychometrics, AEE researchers tend to give priority to simpler models, and the general concern is whether essay scoring is based on a set of strict and well-defined criteria (Attali Reference Attali, Shermis and Burstein2013). For example, psychometricians select a set of reasonable variables for multiple regression (Attali and Burstein Reference Attali and Burstein2004). This model preserves the mapping between variables and identifiable dimensions, such as coherence or lexical complexity (Yannakoudakis and Briscoe Reference Yannakoudakis and Briscoe2012; Vajjala Reference Vajjala2018). Neural networks definitely have great potential for automatic composition scoring, such as an intermediate representation of an essay (Fiacco, Cotos and Rose Reference Fiacco, Cotos and Rose2019; Nadeem et al. Reference Nadeem, Nguyen, Liu and Ostendorf2019), or in combination with handcrafted features (Peters, Ruder and Smith Reference Peters, Ruder and Smith2019). It can be inferred that neural models, such as BERT, have different scoring contributions for various aspects of an essay’s quality. Therefore, in addition to the holistic score and ideas score, these models are also worth exploring for scoring other dimensions of an essay’s quality.
5.4 Limitations
This study uses a scoring model based on the characteristics of concept maps to automatically score ideas, rather than the writing quality in Chinese compositions. We speculate that the characteristics derived from concept maps also relate to other writing aspects, but this method should be tested carefully before scoring other writing aspects.
This study is a starting point for evaluating automated scoring of ideas, as many potential research topics might improve upon it. For automatic assessing methods based on concept maps, one important consideration regards the method to construct the edges in concept maps. In this study, a co-occurrence relation was used to decide if there was an edge between two nodes. The assumption is that the co-occurrence relation between two concepts implies a grammatical or semantic relationship between them; future researchers can construct concept maps based on grammatical relations and semantic relations to capture the ideas relations and semantic distribution in compositions more effectively.
Lastly, AECC-I currently only assesses middle school written essays, so the stability and generalization of the system require further investigation, such as more reliability and validity studies because the model stability in different subgroups was not fully measured (such as fairness in relation to fair different grades, regions, and genders). Furthermore, although this study can predict composition idea scores, the features adopted may also relate to other dimensions of composition evaluation to some extent, such as composition structure and word choice. Lastly, the relationship between concept map features, other scoring dimensions, and total scores needs to be explored.
6. Conclusion
This study investigates multifaceted features based on concept maps derived from Chinese students’ essays. When fusing the structure of a concept map and the semantic representation of word2vec to calculate the features, the handcrafted features method significantly better than BERT models and Coh-Metrix baselines. These results hopefully inspire future research into the potential benefits of developing the structural model of the knowledge graph in combination with trendy neural models.
The feature framework in this study has good structural validity, which can improve the transparency of automated scoring and can contribute to providing constructive feedback for students. The features extracted from these concept maps have a high-to-low correlation with idea scores, and factor analysis illustrates that the 12 features grouped into 4 factors (the main idea factor, a local support factor, a development factor, and a similarity factor) can explain the quality of the ideas more intuitively and concisely. Furthermore, the three features of global cohesion of ideas make the largest contribution to ideas scoring, which indicates stronger global cohesion; thus, higher idea scores. Lastly, a visual inspection of the concept maps can reveal distinctions between poor and excellent ideas in different compositions.
Financial support
We thank Rui-Ji Fu and his team at Beijing research institute of Iflytek Co., Ltd. for the help on providing the toolkit of Chinese word segmentation and data-preprocess. We also thank the National Assessment Center for Education Quality of Chinese Ministry of Education for the financial support. The opinions expressed are those of the author and do not represent views of the Institute or the Department of Education.
Appendix A. An English translation of prompt 1
Original:
Translation:
Please write a composition entitled “Companionship is the Best Gift.”
Requirement: The writing style is not limited, with a clear central idea, substantial content, and fluent language expression, and no less than 400 words. (6 marks)
Appendix B. The baseline of the Chinese Coh-Metrix feature set (Table E1)


