


DISCUSSION POINTS
• The coronavirus has become a global health threat triggering the WHO to declare it a global pandemic. Strong investments are announced to revamp the economy and one of the top priorities in using them should be renewable energy: global warming is the next big emergency and we must be prepared for it.
• Renewables are of paramount importance in the energy market, but this is not sufficient to avoid the climate change emergency. A new impulse is necessary for limiting the temperature rise below the 1.5° limit indicated by IPCC.
• Extending electrification to all energy users is a key strategy for de-carbonization of the energy system at the planetary level. Transport is a key sector for limiting CO2 emissions. Hybrid and electric vehicles are here to stay. Transition to electric cars is not a technological issue anymore; the matter is involving the public opinion.
Introduction
The new strategies for human society will have to consider an increasing demand of energy. In view of the growth of the world population and the improved living conditions, the best criteria for converting energy with maximum efficiency combined with a minimal impact on the environment will have to be identified. Otherwise, the natural balance between human beings and our planet will be irreversibly damaged.
The perfect storm
Warning signs can be seen all over the world announcing the arrival of a perfect “heavy” storm due to water and food shortage, rise of energy costs and effects on the environment. In 2009, John BeddingtonReference Beddington1 predicted the perfect storm by 2030: “[…] If we do not tackle this chain of causes we can expect large destabilizations, with an increase of disorders and potentially significant internationally migratory waves, escaping to avoid shortages of food and water.” This scenario is compatible with the recent increase in food prices due to production not being aligned with demand, a general trend of declining food stocks, and the occurrences of extraordinary droughts or flooding. “Food and water, but also energy. Are all closely connected” says Beddington. “We cannot treat an issue without considering the others.” We need relevant investments in technologies for increasing crop yields, a better use of existing water sources, and sustainable energy supplies.
The starting point of John Beddington's analysis is the global population increase (predicted 8.3 billion in 2030) that will inevitably create a higher demand of food (50% higher) but not supported by potential production. Similarly, the demand of fresh water will increase by about 30% (50% in developing countries) and energy demand will increase as well by about 60%, not supported by available resources. In summary, the human society must now attempt to solve a set of complex, interrelated problems that are fundamental threats to human civilization, and many of these issues are directly related to water, food, energy, security, prosperity, and equity. Water use grew at almost twice the rate of population increase in the last century, resulting in an increasing number of regions that are chronically short of water. On average, agriculture accounts for 70% of global freshwater withdrawals and, over the last 30 years, food production has increased by more than 100%. FAO estimates that about 60% more food will be needed by 2050 to meet food requirements, and consequently, water demand will increase.2 FAO also predicts that irrigated food production will increase by more than 50% by 2050. The world contains an estimated 1400 million km3 of water. Only 0.003% of this amount, about 45,000 km3, are “fresh water resources” that could be used for drinking, hygiene, agriculture, and industry, and not all of this water is accessible because part of it flows in remote rivers during seasonal floods. It takes between 1 and 3 tons of water to grow 1 kg of cereal, and up to 15 tons of water to produce 1 kg of beef. FAO estimates that between 2000 and 5000 l of water are needed to produce a person's daily food: for the global population, this results in several tens of billions of cubic meters of water per day, i.e., a sizable part of the total accessible fresh water. Clearly, especially considering the non-uniform and non-matching distribution of water resources and of population density, fresh water cannot be treated as an unlimited resource.
Land use is another key factor and has changed very much over the past few years. More than 580 million hectares of forest have degraded, 23% of usable land for agriculture has degraded,Reference Koellner, L., T., M., B., M., L., R., D. and R.3 and about 20% of the world pasture is now damaged. This tendency of land use changeReference Shukla, Skea, Calvo Buendia, Masson-Delmotte, Pörtner, Roberts, Zhai, Slade, Connors, van Diemen, Ferrat, Haughey, Luz, Neogi, Pathak, Petzold, Portugal Pereira, Vyas, Huntley, Kissick, Belkacemi and Malley4 is critical in view of the increasing demand of food by growing population, and it is a dangerous ingredient of the perfect storm. Food, energy, and water shortages will inevitably lead to international tension and migrations because in 2030 nearly half of the world population will live in areas under high water and food stressReference Kang and Banga5: for example, Africa will have a population between 75 and 250 million subjected to such pressure.
What to do then? The most urgent need today is to spread awareness, particularly in the young generations. This requires a major, multidisciplinary effort that cannot be delayed. In the following, however, we will focus on another key urgent action, i.e., a paradigm shift in the way we conceive energy. In fact, among the factors that are expected to unleash the “perfect storm,” energy demand growth is particularly critical. This criticality emerges not only because of the potential lack of resources to sustain such energy demand and the global tension arising from it but also because of the strong link between energy production and climate change. This is possibly the most important and urgent emergency we have ever faced as humankind: ineffective climate action over the next few decades might threaten the sustainability of human societies on the planet. Therefore, sustainability must be the driver for this much-needed paradigm shift in the energy system. Undoubtedly, economic and social sustainability; but, at this time in history, a special attention to the often-neglected environmental sustainability must also be paid.
The link between global warming, GHG emissions, and energy
Climate change, of which global warming is one of the key indicators and main causes, has been unequivocally associated with greenhouse gas (GHG) emissions produced by human activities.6 Energy-related activities associated with transport and industrial, commercial and residential uses are the largest contributors, accounting for over two-thirds of the overall GHG emissions at the global level. The vast majority of such energy-related emissions is carbon dioxide (CO2) and derive from burning of coal, oil-based products, and natural gas – which in 2018 contributed for 24.4%, 19.5%, and 19.3% of the total emissions, respectively.7 It is clear that acting on the energy system, which currently depends for over 80% on fossil fuels, is by far the most effective strategy for mitigating the expected devastating effects of climate change over the next few decades.
Current actions for reducing GHG emissions are largely insufficient. The annual global emissions were over 54 GtCO2-eq in 2019, and by 2030 are expected to increase to 60 GtCO2-eq under current policies.Reference Olhoff and Christensen8 However, annual emissions should be reduced to at most 41 GtCO2-eq by 2030 and to 21 GtCO2-eq by 2050 to stay on track for limiting the global average temperature rise to less than 2 °C – a target that could mitigate but not prevent possibly devastating changes to the planetary equilibria. To keep the temperature rise lower than a more desirable 1.5 °C, the annual emissions should reduce to 25 GtCO2 by 2030 and to 6 GtCO2-eq by 2050.Reference Olhoff and Christensen8 In summary, resolute action to reduce GHG emission should be undertaken in order to achieve at least marginal climate change mitigation.
Despite a long-lasting effort to inform the public opinion, warn the decision-makers, and reach a consensus even within the scientific community, awareness about the criticality of the situation is far from being sufficient. This inadequacy is reflected in the recent energy-related GHG emissions trend, which has shown an average annual growth rate since 2011 (i.e., after the global economic crisis) of about 1%, not any lower than that observed in the decade 1990–1999 (i.e., before China's economic boom and the associated anomalous growth of CO2 emissions). In addition, even if an encouraging stagnation has been observed in 2019, the energy-related emissions have grown by a dismaying 1.6% and 1.8% in 2017 and 2018, respectively. Future scenarios are even more discouraging: not even the rigorous implementation of the Nationally Determined Contributions (NDC) pledged by the national governments after the Paris agreements would be able to invert these trends, as it is predicted, at best, to level annual emissions to today's values (54 GtCO2-eq).
Looking at the 2030 horizon, therefore, a major emission gap needs to be filled: a reduction by 13 GtCO2-eq is required for meeting the less-than-2 °C temperature increase target, or a reduction of 29 GtCO2-eq for the more desirable 1.5 °C target. Clearly, drastic measures well beyond current NDC are needed immediately, in order to achieve at least marginal climate change mitigation.
Incidentally, while changes in the energy system have the largest potential for reducing GHG emissions, demand-side materials efficiency is, too, an important (yet often overlooked) mitigation strategy. In fact, a sizable portion of GHG emissions is associated with materials production (11.5 GtCO2-eq in 2015), where the production of steel and cement contributes over a half of the overall materials-related emissions. Increasing demand for these construction materials could then become a critical factor as urban population and industrialization are set for an unprecedented growth in emerging countries.
Key strategies for demand-side materials efficiency are product lightweighting and material substitution; improvement of the yield in materials production and in product manufacturing; re-design for more intensive use and lifetime extension of products; enhanced recycling and reuse. These strategies could also have synergic effects on energy demand. Notable examples are the substitution of construction materials with more lightweight and insulating materials (which leads to energy savings during construction and building operation), or lightweighting in the automotive sector (where lighter vehicles lead to fuel savings). These two sectors alone could contribute with a 2 GtCO2-eq in GHG emissions reduction by 2030.Reference Olhoff and Christensen8
While the urgency of reducing GHG emissions is clear, as it is clear that acting on the energy system is the most effective strategy, global energy demand has grown significantly over the past years (over 40% since 2000) and is expected to keep growing (Fig. 1). The majority of the energy we use today comes from fossil fuels: in 2018, oil, gas, and coal collectively contributed to 81% of the global primary energy demand. Under the currently stated policies, the combined share of fossil fuels is projected to decrease to 74% by 2040, but this is hardly good news since the overall use of these carbon-emitting sources is actually bound to increase by over 13% (from 11,595 Mtoe in 2018 to 13,145 Mtoe in 2040) in view of the predicted increase of energy demand. It should be noted, however, that some scenarios have been proposed where the overall fossil fuel demand decreases and are indeed compatible with realistic – though more radical – policies.7,9–11 In all scenarios, however, fossil fuels will remain the major contributors to the energy demand for at least the next couple of decades. Oil, in particular, is expected to keep a prominent role. This leads to major uncertainty in the sustainability of the energy system since the future prominence of oil in the energy system relies upon the exploitation of oil fields yet to be discovered, or of unconventional oil. Moreover, the convenience and environmental impact of these sources are questionable, one reason above all being the constantly reducing energy return with respect to the energy invested of these sources (EROEI), as also recalled below.Reference Poisson and Hall12–Reference Rye and Jackson14

Figure 1. Primary energy consumption from 1990 to 2040.7
Clearly, currently stated energy policies are not satisfactory, both because of the massive reliance upon an uncertain source such as oil, and because the energy mix that will result from such policies does not help in filling the emission gap, i.e., in reducing GHG emissions to the levels required for adequate mitigation of the global temperature rise. More radical actions are needed.
Renewable energy and the early vision of Giacomo Ciamician
The roadmap for filling the emission gap involves the simultaneous implementation of a number of strategies,Reference Olhoff and Christensen8 and all the ones expected to have the most impact are related to energy. Demand reduction via energy savings and efficiency is widely recognized as the strategy with the highest potential impact – although its actual applicability is rather uncertain in light of the expected demand growth in emerging countries. The other key elements of the roadmap, listed in order of potential impact, are the extensive use of renewable energy, decarbonization of transport and industry, and coal phase-out.
The expansion of renewable energy electricity alone could cover between 25% and 35% of the emission gap.7 In addition, this strategy brings along a number of benefits: potential for new employment, wider access to clean and secure energy, benefits to health, and opportunities for improving efficiency on the end-use energy demand side.
The majority of what are commonly considered renewable energy sources (RES) originates from solar energy: photovoltaics and solar thermal, but also indirect forms such as hydroelectric and wind energy. Biomass has a solar origin, too. Humankind has been using solar energy in its various forms as the sole source of energy for millennia, but the first vision in post-industrialization times that solar energy could sustain energy-intensive human activities came in 1912. Giacomo Ciamician, a chemist born in Trieste, Italy, gave a talk at the VIII International conference on applied chemistry entitled “The photochemistry of the future,” and soon after published the paper in Science.Reference Ciamician15 Ciamician says:
“Modern civilization is the daughter of coal for this offers to mankind the solar energy in its most concentrated form: that is in a form in which it has been accumulated in a long series of centuries. Modern man uses it with increasing eagerness and thoughtless prodigality […]. The earth still holds enormous quantities of it, but coal is not inexhaustible. Is fossil solar energy the only one that may be used in modern life and civilization?”
If we substitute “coal” with “fossil fuels,” the words of Ciamician become rather factual and up-to-date. The talk has a prophetic closure:
“And if in a distant future the supply of coal becomes completely exhausted, civilization will not be checked by that, for life and civilization will continue as long as the sun shines! If our black and nervous civilization, based on coal, shall be followed by a quieter civilization based on the utilization of solar energy, that will not be harmful to progress and to human happiness.”
Ciamician declared the unsustainability of the situation as early as 1912 and, more important, he pointed to the solution: for this reason, he could be considered a pioneer in the field of renewable energies.
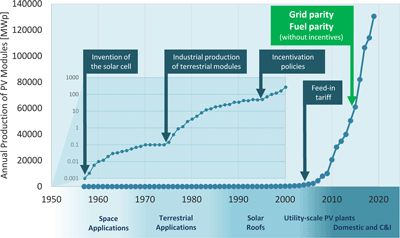
Ciamician's vision is finally starting to gain momentum: RES and, in particular, “modern” renewables are growing fast. Wind and solar photovoltaics are at the forefront, leading the growth of the non-biomass portion of modern renewables at a rate that is unprecedented in previous energy transitions (Fig. 2). Because of their characteristics, most modern RES are most easily used as sources for electricity generation; therefore, it does not come as a surprise that a continuous growth of the share of RES in the global electricity mix has been observed over the past few years, reaching 26% in 2018.17 Interestingly, the growing share of electricity in the final energy consumption (19% in 2018 with respect to 17% in 20107) is bound to keep increasing over the next years – pushed by policies for providing electricity to 1.8 billion people who do not have access to it, or by the emergence of electric mobility. Large additions of new power capacity are therefore needed, and this represents a major opportunity for focusing these new investments on RES, thus improving the sustainability of the global energy mix. In the following, we shall focus on the role of RES in power generation.
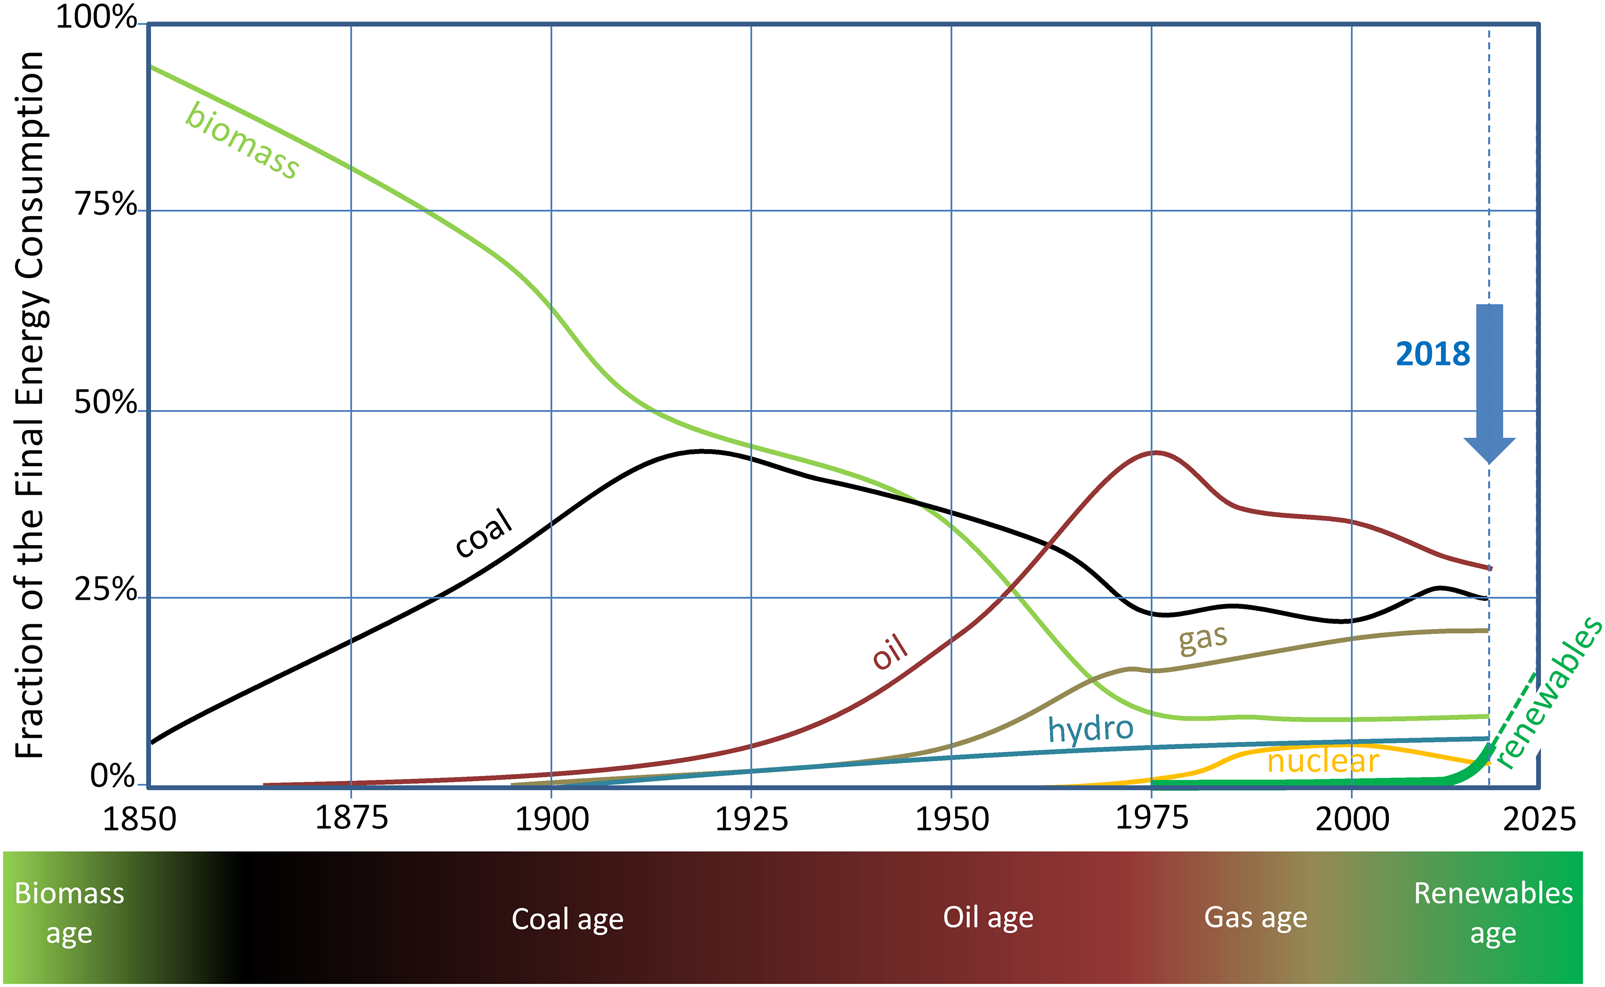
Figure 2. Share of the final energy consumption of the main energy sources, showing the key energy transitions in history. The curve labeled “renewables” includes here only data of wind power, photovoltaics, geothermal, concentration photovoltaics, and solar thermal (data from IEA Report 20197 and Global Energy Assessment 201216).
The production of electricity from RES has grown exponentially since the beginning of the millennium, and the global installed power at the end of 2019 exceeded 2.5 TW.18 From 2010 to 2018, RES for electricity have grown at a faster pace than that of fossil and fissile sources combined7; moreover, an increasing number of plants powered by these latter sources is being decommissioned. This energy transition to RES (Fig. 2) is due to several reasons. We believe that the growing awareness about the limits of traditional fossil fuels and their effects on climate change does play an important role. Also, focusing on more measurable factors, we mention the increasing share of electricity as mentioned above; the diffusion of distributed generation; the widespread efforts to limit local pollution; the reduction of the electricity generation cost from renewable sources (e.g., the cost of wind power and PV dropped in the last decade by 70% and 89%, respectively19); and modular and fast installation of RES-based power generation plants (e.g., the commissioning time for utility-scale PV is about 6 months, while that of nuclear plants can take up to 20 years in some cases20,21 ).
Solar photovoltaics
Photovoltaics (PV) is the leading energy technology in terms of annual growth rate (over 35% in 2010–201918), number of jobs produced (over 3.5 million in 201922), and annual installed power.7 We will focus our attention on PV since we believe that this technology will be at the forefront of the renewable era of the energy system.
In the past, PV has been criticized for requiring too much energy with respect to the energy produced over its lifetime. However, this is not true, and less so when considering modern PV technology. One measure of this, and a key indicator for comparing sources and guiding sound energy strategies, is the Energy Return on Energy Investment (EROEI), i.e., the amount of energy obtained from an energy production process per unit energy consumed in the process itself. Energy sources with an EROEI of less than unity should not be considered since the energy generated by these sources is less than that needed for their exploitation. Recent dataReference King and Van Den Bergh23 confirm that solar PV has the second highest EROEI value (25) after hydroelectric (84). Other RES have values ranging from 9 to 14, while the EROEI of fossil fuels has steadily decreased over the decades, ranging now between 7 and 13 or even less for unconventional oil.Reference Poisson and Hall12–Reference Rye and Jackson14
Photovoltaics is and has been growing at an extraordinary pace (Fig. 3) for a number of reasons: the solar source is widespread, practically unlimited, and free of charge; PV plants are easy and quick to install, and are durable; they do not produce acoustic or chemical emissions – excellent features for urban areas. Moreover, the installation of PV does not require highly specialized skills, thus providing a great opportunity for the creation of distributed jobs for local labor. Finally, the high modularity of the installations enables exploitation of the economies of scale, leading to a quick reduction of costs in the local markets. These peculiar characteristics make PV one of the cornerstones of the energy transition of the 21st century.

Figure 3. Global photovoltaic installed capacity over time.18
However, the growth of PV is far from being over, and we expect it to become increasingly decisive and faster. Should currently stated policies be implemented, solar PV would become the largest source of installed electrical power capacity by 2035, surpassing coal and gas.7 Three factors support this expectation: the economical convenience of PV electricity; the growth trends of PV currently observed in major, high-potential markets such as China and India; the push for PV from distribution system operators (DSOs).
Economics of PV. Figure 4 shows the historical evolution of the volumes of PV production. Since its birth in the mid-1950s, with the invention of silicon PV cells and the first space applications, a series of innovations (technological or economical) has led to the opening of new markets and to a drastic increase of the diffusion of PV installations. From a technological standpoint, the majority of the breakthrough innovations that have led to the most remarkable efficiency improvements have been associated with material quality and fundamental device architecture and have been devised and implemented before the mid-1990s. Considering as a reference the best of single-crystal silicon cells, an improvement from about 12% in the mid-1970s to about 24% in 1995 was observed. The increase of efficiency has since slowed down – not surprisingly, as the physical limits are being approached – and the current best single-crystal silicon cell shows a 26.6% efficiency. Remarkable technological improvements have been achieved, over the past decade, also by refining the architecture and the manufacturing of PV modules. This has led to higher module efficiency (now exceeding 24% for the best modules, and averaging in the range of 17–22% in widely available commercial modules) and most of all to higher reliability and durability – or, in the end, to higher bankability and therefore wider diffusion. It is worth mentioning some technological advances that in recent years have been implemented in commercial technologies and have contributed to reducing the LCOE of PV installations: “Black” silicon, where the surface is treated to obtain a nanostructured morphology leading to a more efficient absorption of the solar radiation and, ultimately, to and improved efficiency at a moderate cost increase. Double-sided cells, where the backside of the cell is also active and can collect and convert diffused radiation. And finally, metal wrap-through cells, which drastically reduce the complexity of assembling PV modules, thus reducing cost and improving reliability.
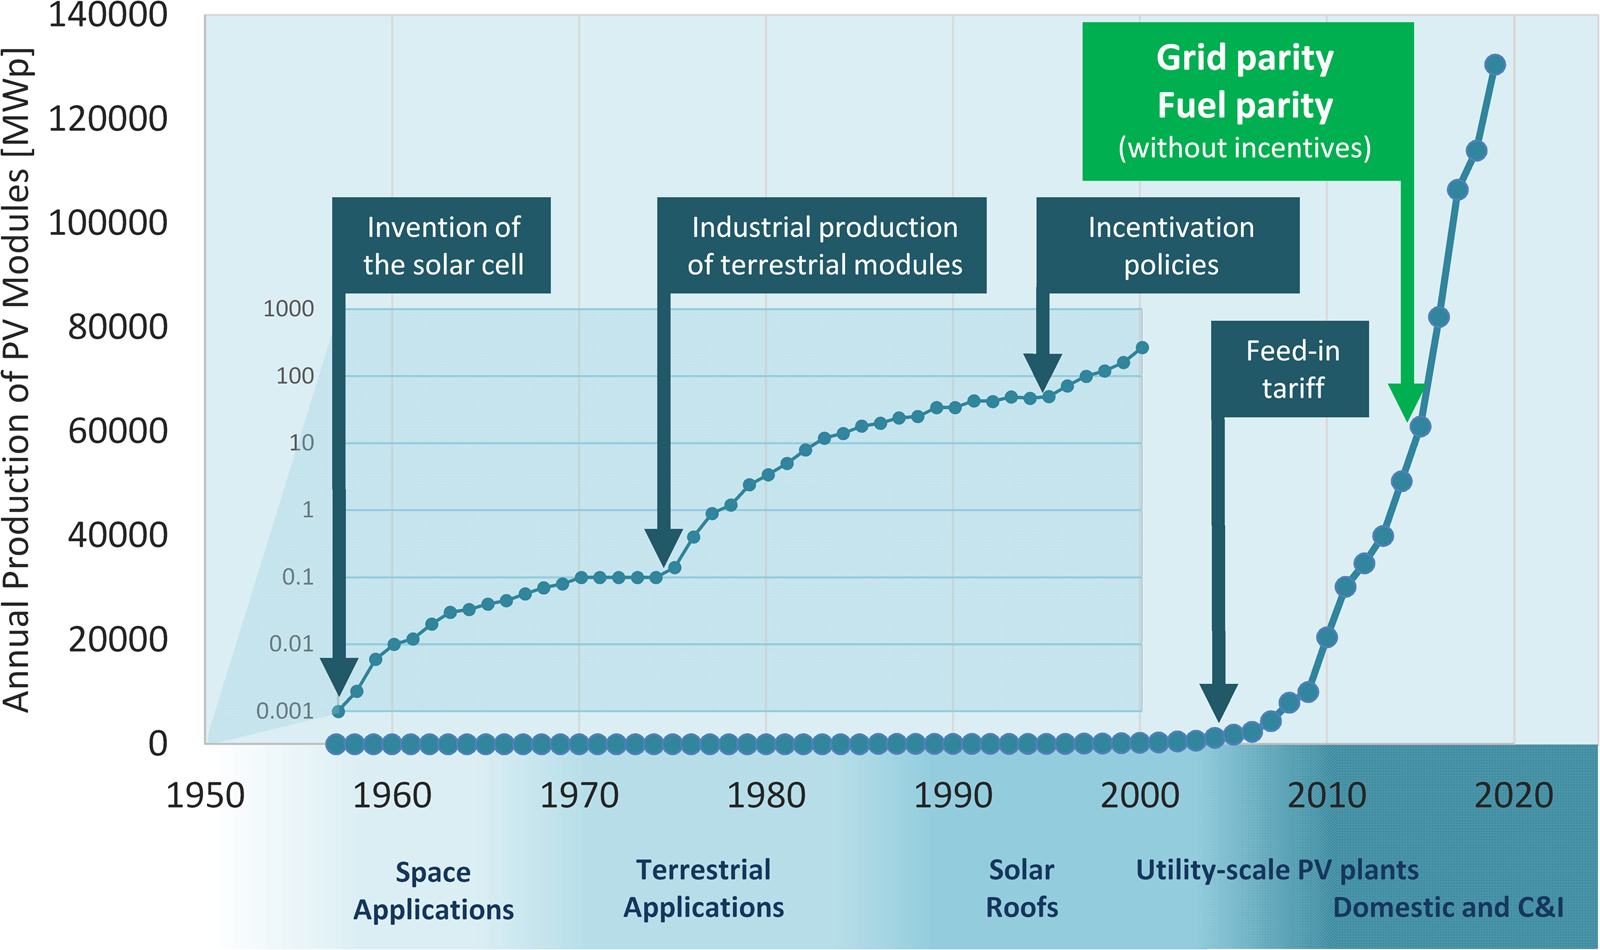
Figure 4. Annual production of PV modules over time. The data from 1957 to 2000 are also reported in the inset on a logarithmic scale. Some key events that have triggered a marked expansion of the PV market are highlighted.
In recent times, however, economical factors and policy have played a perhaps even more important role in favoring PV diffusion. In particular, the possibility for the end consumer to become a producer and be remunerated for the energy produced via feed-in tariff schemes has been one of the tipping points that promoted the widespread diffusion of PV both at the domestic level and for utility-scale generation. These facts led to the current, tangible impact on the energy portfolio of several countries. Such growth triggered a drastic cost reduction across the entire PV supply chain (especially for the PV modules, which showed a cost reduction of more than 99% over the past 40 years24,Reference Nemet25 ). At last, this has led to grid parity in several energy markets – whereby the cost of the electricity for the final user that installs a PV plant is lower than the price that the user would pay for buying the electricity from the grid.Reference Massi Pavan and Lughi26 In some cases, fuel parity is observed, whereby the cost of PV electricity equals the cost of the electricity produced by the local energy source mix.Reference Viola, Miceli, Di Dio, Massi Pavan, Sulligoi, Lughi and Pauli27 Grid parity and fuel parity effectively mark the maturity of the solar era, where photovoltaics has become economically convenient, without the need for incentives.
The Italian market is a good example where, in many typical cases, grid parity and fuel parity have been attained. Table 1 shows that the LCOE (Levelized Cost of Energy) for domestic, commercial, and industrial PV plants in Italy is consistently lower than the price of the electricity (grid parity). The table also shows that the LCOE for large-scale PV plants for electricity generation is typically less than the LCOE of electricity produced via traditional primary energy sources, demonstrating the fuel parity condition.
Table 1. Photovoltaic LCOE for different applications.
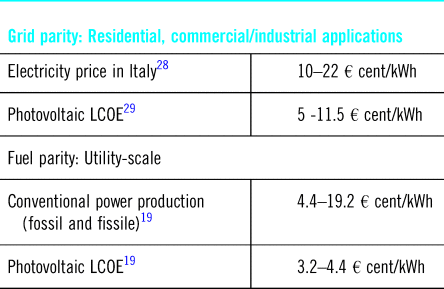
While Italy has been among the first energy markets to achieve grid- and fuel parity, many more have followed, and more are expected to follow as the cost of the electricity produced by photovoltaics keeps dropping. Further exploitation of the economies of scale (especially for what concerns the balance of system, BoS) as the PV market continues expanding, is one likely mechanism for cost reduction; technological breakthroughs arising from new materials and device architecture at the nano- and microscale are, too, a possible source of further cost reduction.
Technological solutions to improve the key figures of merit of PV (efficiency, LCOE, etc.) have been explored for decades. Nevertheless, no single solution has been able to surpass silicon-based PV when the overall performance and convenience is considered. The production cost of silicon cells is now so low that grid parity is possible today without the need for a new technology and has been reduced to such an extreme that further reductions are increasingly difficult and less worthy. As a consequence, most of the potential for reducing the price of a turnkey PV plant today resides in the BoS rather than in the PV modules – thus weakening the drivers for developing new PV cell concepts and materials. Nevertheless, the research for new solutions remains rather active because further module cost reductions are always welcome, and also because higher efficiency is valuable as it helps reducing the cost-per-watt of non-module components in PV systems,Reference Wang and Barnett30 or because it widens the applicability of PV in growing markets such as portable electronics.
Among the many solutions currently under study, perovskite cellsReference Park31 are among the most promising ones. In just a few years of research, the best perovskite cell efficiency has risen to 25.2% – essentially on par with the best crystalline silicon cells. These cells can be fabricated by solution processes, leading to potentially very cheap manufacturing. However, stability issues limit for now the adoption of these devices as a large-scale technology.
Quantum-dot solar cells are another interesting and even younger technology; while the best recorded performance is now 16.7%, the high potential for improvement has not been fully explored yet, in particular the degrees of freedom afforded by possible structural morphologies at the nanometric and micrometric scale.Reference Shaikh, Shaikh, Mali, Patil, Beknalkar, Patil, Tarwal, Kanjanaboos, Hong and Patil32,Reference Lee, Song, Shim and Lee33 Quantum-dot cells can be manufactured by rather inexpensive approaches, and good stability is expected.
PV growth in large emerging markets. Table 2 reveals a second clue pointing to a fast growth of PV. The cumulative installed PV power and the PV power per capita at the end of 2018, and the growth with respect to the previous year, are reported for a set of key countries. The numbers are rather impressive for Germany, Japan, and Italy – which have been the global market leaders for a number of years – and the growth rate is still noteworthy for Japan (mainly an effect of the decommissioning of nuclear power plants). However, these figures are marginal if compared to what is expected to be the contribution of China and India to the global PV growth. Considering their potential market size and the exceptionally high growth rates, these countries will drive the short-term PV global capacity growth. If the untapped potential for growth in Europe and the USA are also considered, the global PV capacity is likely to double in less than 4 years, exceeding 1 TW by 2023.
Table 2. Photovoltaic power in selected countries.18

The role of DSOs. The third clue supporting the expectation of a major growth of PV in the short term arises from the observation that in some markets, most notably Germany and Italy, an increasing number of DSOs have started offering the installation of PV plants to their customers. One important driver for this business strategy is diversification, as DSOs are seeing a decrease in their revenues derived by the direct sale of electricity. Moreover, DSOs are mandated by law to pursue projects that have the objective of reducing energy demand from fossil energy sources, and the installation of PV plants is an effective way to meet these objectives.
The factors discussed above, together with the current stated policies, clearly show that photovoltaics is expected to become the main source of electricity – even though certainly not the only one. In fact, as one of the main cons of photovoltaics is intermittency, integration with other technologies is needed in order to guarantee the needed flexibility of the power systems. Among these, we mention hydropower, gas, coal, interconnections, batteries, and demand response. These technologies are not only capable of balancing demand and supply during peak demand but also to provide the ancillary services to the grid.
Conclusion
The threat of a perfect storm is hovering over the Earth and over humankind. Yet, effective action is lagging and the situation grows more critical every day. Rethinking and reshaping the energy system is the most effective strategy for mitigating global warming; in particular, pervasive expansion of RES – along with energy demand reduction – is the action with the highest potential impact. RES are indeed growing at a very fast pace, and solar PV is expected to become the primary source for electricity in the next 10–15 years. Giacomo Ciamician's vision is finally coming true.


 Open access