


Hyperbolic polaritons are a class of polaritonic[Reference Maier1, Reference Basov, Fogler and García de Abajo2] waves that are supported by highly birefringent materials where the dielectric function along orthogonal axes is opposite in sign.[Reference Poddubny, Iorsh, Belov and Kivshar3, Reference Noginov, Lapine, Podolskiy and Kivshar4] For materials exhibiting a negative real part of the permittivity (dielectric function) along one or two axes in Cartesian coordinates, the material is referred to as a Type I or Type II hyperbolic material, respectively. Due to the extreme anisotropy in the optical response, hyperbolic polaritons propagate through the volume of the material, analogous to plane waves in a dielectric medium, but provide exceptional wavelength compression (optical confinement) consistent with surface polaritons. Furthermore, hyperbolic polaritons can be supported at arbitrarily large wavevectors at a given frequency, but the propagation direction within the material is dictated by the dielectric function.[Reference Caldwell, Kretinin, Chen, Giannini, Fogler, Francescato, Ellis, Tischler, Woods, Giles, Hong, Watanabe, Taniguchi, Maier and Novoselov5–Reference Dai, Ma, Anderson, McLeod, Fei, Liu, Wagner, Watanabe, Taniguchi, Thiemens, Keilmann, Jarillo-Herrero, Fogler and Basov8] This results in several effects, including negative refraction,[Reference Li, Lewin, Kretinin, Caldwell, Novoselov, Taniguchi, Watanabe, Gaussmann and Taubner6, Reference Dai, Ma, Anderson, McLeod, Fei, Liu, Wagner, Watanabe, Taniguchi, Thiemens, Keilmann, Jarillo-Herrero, Fogler and Basov8] sub-diffractional volume-confinement of electromagnetic optical near-fields,[Reference Caldwell, Kretinin, Chen, Giannini, Fogler, Francescato, Ellis, Tischler, Woods, Giles, Hong, Watanabe, Taniguchi, Maier and Novoselov5] and a continuum of multiple branches in the polariton dispersion[Reference Dai, Fei, Ma, Rodin, Wagner, McLeod, Liu, Gannett, Regan, Thiemens, Dominguez, Castro Neto, Zettl, Keilmann, Jarillo-Herrero, Fogler and Basov7] giving rise to an exceptionally large photonic density of states. These properties can be exploited to develop compact hyperlenses,[Reference Li, Lewin, Kretinin, Caldwell, Novoselov, Taniguchi, Watanabe, Gaussmann and Taubner6, Reference Dai, Ma, Anderson, McLeod, Fei, Liu, Wagner, Watanabe, Taniguchi, Thiemens, Keilmann, Jarillo-Herrero, Fogler and Basov8, Reference Liu, Lee, Xiong, Sun and Zhang9] waveguides,[Reference Alfaro-Mozaz, Alonso-González, Vélez, Dolado, Autore, Mastel, Casanova, Hueso, Li, Nikitin and Hillenbrand10, Reference Folland, Fali, White, Matson, Liu, Aghamiri, Edgar, Haglund, Abate and Caldwell11] and surface sensors[Reference Autore, Li, Dolado, Alfaro-Mozaz, Esteban, Atxabal, Casanova, Hueso, Alonso-González, Aizpurua, Nikitin, Vélez and Hillenbrand12, Reference Sreekanth, Alapan, ElKabbash, Ilker, Hinczewski, Gurkan, De Luca and Strangi13] far below the diffraction limit.
Traditionally hyperbolic behavior was achieved by using artificial metamaterials consisting of superlattices of alternating sub-wavelength thickness metal and dielectric layers[Reference Hoffman, Alekseyev, Howard, Franz, Wasserman, Podolskiy, Narimanov, Sivco and Gmachl14] or metallic nanoparticles embedded within a dielectric matrix.[Reference Yao, Liu, Liu, Wang, Sun, Bartal, Stacy and Zhang15] Due to the metallic components, these suffer from significant optical losses. However, natural materials can also be hyperbolic,[Reference Korzeb, Gajc and Pawlak16, Reference Zebo, Jianing, Yu, Ximiao, Xiaobo, Pengyi, Jianbin, Weiguang, Huanjun, Shaozhi and Ningsheng17] with hexagonal boron nitride (hBN) providing an excellent example.[Reference Basov, Fogler and García de Abajo2, Reference Caldwell, Kretinin, Chen, Giannini, Fogler, Francescato, Ellis, Tischler, Woods, Giles, Hong, Watanabe, Taniguchi, Maier and Novoselov5, Reference Dai, Fei, Ma, Rodin, Wagner, McLeod, Liu, Gannett, Regan, Thiemens, Dominguez, Castro Neto, Zettl, Keilmann, Jarillo-Herrero, Fogler and Basov7] In hBN, hyperbolicity arises in the mid-infrared (MIR) due to highly anisotropic polar optical phonons, which have significantly different energies in- and out-of-plane. Consequently, hBN has two spectral bands where hyperbolic polaritons can be supported, of both Type I (spectral range ~740–825 cm−1, the “lower reststrahlen band”) and Type II (spectral range ~1360–1614 cm−1, the “upper reststrahlen band”). As the hyperbolic behavior arises from the interaction of light with phonons, the scattering lifetimes are orders of magnitude longer than surface plasmons and thus result in substantially lower absorption losses.[Reference Caldwell, Lindsey, Giannini, Vurgaftman, Reinecke, Maier and Glembocki18] Earlier works explored hyperbolic modes in hBN via either nano-structuring[Reference Caldwell, Kretinin, Chen, Giannini, Fogler, Francescato, Ellis, Tischler, Woods, Giles, Hong, Watanabe, Taniguchi, Maier and Novoselov5, Reference Alfaro-Mozaz, Alonso-González, Vélez, Dolado, Autore, Mastel, Casanova, Hueso, Li, Nikitin and Hillenbrand10] or scattering-type scanning near-field optical microscopy (s-SNOM),[Reference Li, Lewin, Kretinin, Caldwell, Novoselov, Taniguchi, Watanabe, Gaussmann and Taubner6–Reference Dai, Ma, Anderson, McLeod, Fei, Liu, Wagner, Watanabe, Taniguchi, Thiemens, Keilmann, Jarillo-Herrero, Fogler and Basov8, Reference Brown, Davanco, Sun, Kretinin, Chen, Matson, Vurgaftman, Sharac, Giles, Fogler, Taniguchi, Watanabe, Novoselov, Maier, Centrone and Caldwell19–Reference Li, Dolado, Alfaro-Mozaz, Casanova, Hueso, Liu, Edgar, Nikitin, Vélez and Hillenbrand21] both of which are technically challenging experiments, making characterization of the properties of polaritons in different crystals of two-dimensional (2D) materials difficult. For example, it becomes arduous to assess the quality and dispersion of hBN crystals produced with different isotopic purities,[Reference Giles, Dai, Vurgaftman, Hoffman, Liu, Lindsay, Ellis, Assefa, Chatzakis, Reinecke, Tischler, Fogler, Edgar, Basov and Caldwell20, Reference Vuong, Liu, Van der Lee, Cuscó, Artús, Michel, Valvin, Edgar, Cassabois and Gil22] or fabricated using different growth techniques. It has historically also been difficult to measure hyperbolic polaritons in the lower reststrahlen band of hBN due to the lack of commercial laser sources for s-SNOM. Indeed, this is even more problematic in investigating phonon polaritons in other two dimensional materials[Reference Low, Chaves, Caldwell, Kumar, Fang, Avouris, Heinz, Guinea, Martin-Moreno and Koppens23] such as transition-metal dichalcogenides (TMDs), due to the inherently low-energy scale of their optic phonons.[Reference Zebo, Jianing, Yu, Ximiao, Xiaobo, Pengyi, Jianbin, Weiguang, Huanjun, Shaozhi and Ningsheng17, Reference Uchida and Tanaka24]
Here we demonstrate how infrared attenuated total reflectance (ATR) spectroscopy using an ATR microscope objective, can efficiently launch and measure the properties of hyperbolic phonon polaritons (HPhPs) and anisotropic dielectric resonances in a Kretschmann–Raether[Reference Raether25] configuration. In this approach, total internal reflection (TIR) at the boundary between a dielectric and a polaritonic material launches the polariton [Fig. 1(a)], with an in-plane momentum determined by the incident angle and the index of refraction of the prism. The use of an ATR microscope objective enables measurements over a broad spectral range from small regions of interest, overcoming limitations with prisms that are orders of magnitude larger than the material flake being studied. This ATR micro-spectroscopy approach enables broadband, quick measurements using an appropriate prism and FTIR/microscope configuration. For example, polaritons in any 2D material could be measured within the transmission window of germanium with the same prism and detectors used in this paper, including graphene[Reference Dai, Jiang and Xiang26] and transition-metal oxides,[Reference Zebo, Jianing, Yu, Ximiao, Xiaobo, Pengyi, Jianbin, Weiguang, Huanjun, Shaozhi and Ningsheng17] while modifying the setup to use a DLaTGS or bolometer detector would offer these measurements from TMDs.[Reference Uchida and Tanaka24]
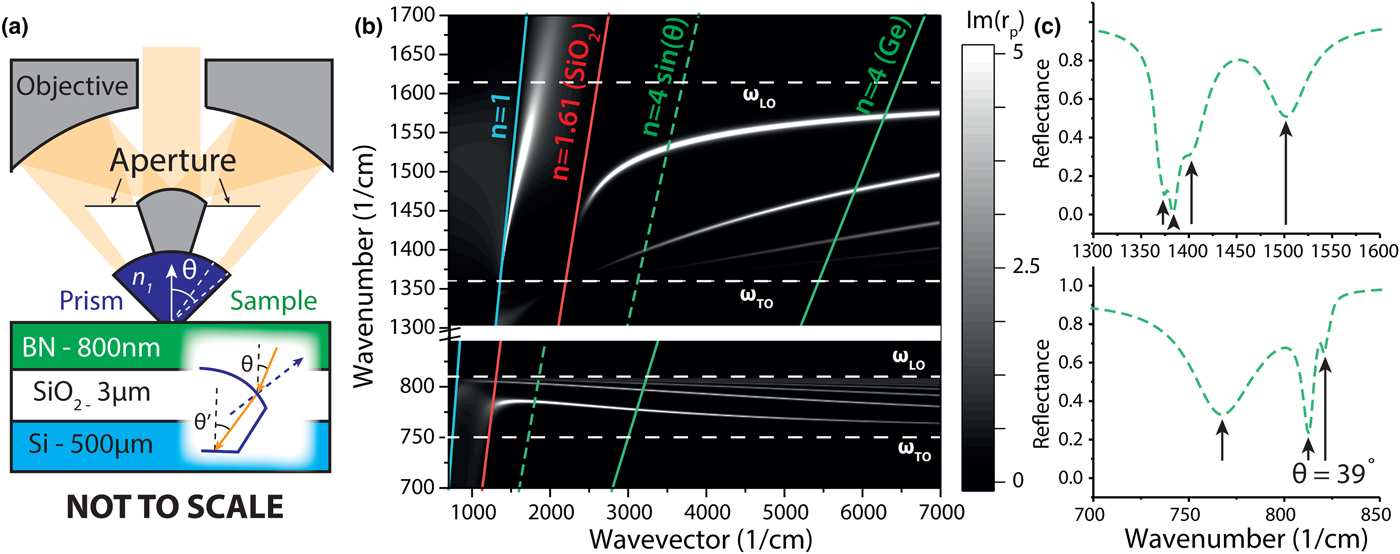
Figure 1. (a) A schematic of the prism-coupled, ATR micro-spectroscopy measurements of hyperbolic polaritons in hBN. The schematic details the basic design principle of the ATR objective used to measure small (approximately 100 µm across) flakes of hBN for this study. Inset: Illustration of how refraction at the non-planar prism–air interface can result in a slightly different incidence angle in the prism versus in free space. (b) The dispersion of HPhPs in hBN is represented in a contour plot with the z-axis plotting the imaginary part of the Fresnel coefficient. For assistance with the discussion in the text, the dispersion of light in vacuum, SiO2, and germanium are provided as the blue, red, and green solid lines, respectively. The green dashed line provides the dispersion of light through a typical Cassegrain-type objective using a Ge prism. (c) The ATR reflectance spectrum calculated using TMMs for an incidence angle commensurate with experiments in both lower (top plot) and upper (bottom plot) reststrahlen bands. Arrows indicate polariton modes.
In ATR spectroscopy, a high-refractive index prism provides a high in-plane momentum to couple into polariton modes, with wavevector k = k 0n 1sin(θ′) [illustrated in Fig. 1(a)]. The polariton dispersion (frequency versus wavevector) of hyperbolic polaritons in an 800 nm thick flake of hBN exfoliated onto a 3 µm layer of SiO2 on silicon is shown in Fig. 1(b), calculated using a transfer-matrix-based approach.[Reference Dai, Fei, Ma, Rodin, Wagner, McLeod, Liu, Gannett, Regan, Thiemens, Dominguez, Castro Neto, Zettl, Keilmann, Jarillo-Herrero, Fogler and Basov7] The bright lines (corresponding to maxima in the imaginary part of the Fresnel coefficient) represent hyperbolic polariton modes. Note, this hyperbolic dispersion exhibits multiple branches, each with successively higher spatial confinement (wavelength compression) at the same frequency. This is a hallmark of hyperbolic media, with the number of branches and the corresponding slopes being strongly thickness dependent.[Reference Dai, Fei, Ma, Rodin, Wagner, McLeod, Liu, Gannett, Regan, Thiemens, Dominguez, Castro Neto, Zettl, Keilmann, Jarillo-Herrero, Fogler and Basov7] This contrasts with surface polaritons, which typically exhibit a single branch (e.g., one wavevector per incident frequency). Onto this HPhP dispersion curve we plot the dispersion of light in vacuum (cyan), the SiO2 substrate (red), and the Ge prism (green solid line). We can couple into hyperbolic polaritons using a germanium prism (aka k = k 0n 1) in the region between the red and green lines by changing the angle of incidence. Crucially, we can potentially couple into a series of different hyperbolic modes, even at the incidence angles of typical Cassegrain microscope objectives [green dashed line in Fig. 1(b)]. At angles commensurate with those achieved in our experiment, we expect to see four resolvable polariton resonances in the upper reststrahlen band, shown in Fig. 1(c) [calculated using a transfer matrix method (TMM)[Reference Passler and Paarmann27]], and three in the lower reststrahlen. These are due to stimulation of the HPhPs within the first four (three) branches in the upper (lower) reststrahlen regions. This provides strong motivation that this proposed approach can be used to systematically investigate polaritons in small flakes of 2D materials[Reference Low, Chaves, Caldwell, Kumar, Fang, Avouris, Heinz, Guinea, Martin-Moreno and Koppens23] using ATR micro-spectroscopy.
Our experimental approach to launching hyperbolic polaritons is based around a commercially available (Bruker Optics) ATR microscope objective, schematically shown in Fig. 1(a). A germanium prism (n 1 ~ 4) with a base diameter of ~100 µm is mounted at the focal point of a 20× Cassegrain-type reflective microscope objective (NA = 0.6). This prism is pressed onto the surface of the sample with a force 0.5 N, ensuring good optical contact between the sample and the prism. We classify our setup as Kretschmann–Raether as the prism is in optical contact with the polaritonic medium, however excitation of HPhPs is slightly different from excitation of surface phonon polaritons. Volume confined HPhPs are launched within the volume of the hyperbolic medium itself, with evanescent fields supported in the dielectric substrate on the opposite side of the hBN. Any surface roughness on the interface between prism and sample will lead to a small gap, however these will be extremely small compared with the incident wavelength and thus can be neglected. The as-manufactured ATR objective provides light at incident angles between approximately 22° and 37°, thus potentially broadening the range of polaritonic wavevectors that are simultaneously launched and collected. This would potentially produce significant angular broadening in the collected spectra. In order to reduce the effects of angular spreading, we added a custom-made aperture plate to the objective, which restricted the incident angle to θ = 33 ± 4° [as labeled in Fig. 1(a)].[Reference Maß and Taubner28] When infrared light enters the prism it refracts, slightly altering the angle incident on the sample [see inset to Fig. 1(a)]. To find the true incident angle at the prism–sample interface, we fit to our experimental data, finding a refraction corrected incident angle (θ′) of approximately 39°. This aperture plate also allowed us to control the incident polarization to s- or p-polarized light as previously demonstrated.[Reference Maß and Taubner28] Prior work has exploited prism-based techniques to measure the properties of hyperbolic materials,[Reference Luo and Tang29, Reference Zhang, Hong, Ji, Zhu, Chen, Agrawal, Zhang, Tiwald, Schoeche, Hilfiker, Guo and Lezec30] however, due to the low-refractive-index of the prisms used in those experiments they were unable to measure defined polariton resonances. Furthermore, they typically used samples and prisms on the scale of centimeter—which are not suitable for the relatively small flakes typical of exfoliated hBN or other 2D materials. Thus, the requirement of achieving TIR places stringent requirements on the possible substrates for the polariton film and must be taken into account for any experimental design.
To address the choice of an appropriate substrate for the measurement, we consider the critical angle for TIR. The critical angle (θ c) is defined in terms of the refractive index of the prism (n 1) and of the substrate as (n 2)[Reference Born and Wolf31]:
 $$\theta_{\rm c} = {\arcsin}\left( {\displaystyle{{n_2} \over {n_1}}} \right).$$
Our samples consist of flakes of hBN, mechanically exfoliated onto a thick SiO2 layer grown on silicon. The critical angle for SiO2 (n ~ 1.62) is 24°, and Si (n ~ 3.4) is 58°, which means that ATR measurements can be performed on SiO2 and other low-index dielectric substrates, but that high-index substrates such as silicon require incident angles that cannot be accessed within the current objective design. This has significant implications for sample preparation. For instance, while we exfoliated hBN layers onto thin films of SiO2 grown on silicon, it is also important to ensure the evanescent wave launched at the hBN–SiO2 interface does not significantly interact with the silicon substrate. This is dictated by the decay length (l) of an evanescent field resulting from the TIR of the incident light with an incident free-space wavelength λ that is launched at the prism boundary and is given by the following equation[Reference Born and Wolf31]:
 $$l = \displaystyle{\lambda \over {2\pi \sqrt {{(n_1{\sin}(\theta ))}^2-n_2^2}}} $$
For the case of θ = 30, n 1 4, n 2 ~ 1.62, and λ ~ 7 µm, the decay length is 950 nm, so to ensure that no significant interactions with the silicon substrate occur, the oxide thickness must be a few times larger than this decay length. Thus, in our experiments we choose a SiO2 thickness of 3 µm for our sample. In this analysis we assume a fixed value for the refractive index, but phonon modes in SiO2 cause significant dispersion and absorption in certain regions of the infrared (notably at ~800, ~1000, and ~1200 cm−1). The high-refractive index of germanium means that the critical angle will not change significantly (θ c = 30 for n = 2), but the spectral dispersion (and associated absorption bands) of SiO2 need to be accounted for in analysis of our results. This additional complexity can be overcome by using low-index dielectrics without phonon bands at these frequencies, such as ZrO2 or Y2O3.
Three types of hBN crystals are studied in this work with natural isotopic concentration (~80% 11B/~20% 10B),[Reference Taniguchi and Watanabe32] and isotopically enriched[Reference Giles, Dai, Vurgaftman, Hoffman, Liu, Lindsay, Ellis, Assefa, Chatzakis, Reinecke, Tischler, Fogler, Edgar, Basov and Caldwell20] to ~99% 10B and 11B. Details concerning the growth of the original bulk crystals from which the flakes were exfoliated are available in the literature.[Reference Liu, He, Xu, Li, Liu and Edgar33] Prior to IR characterization, the thickness of each flake was measured using atomic force microscopy (AFM), thereby enabling accurate comparison with electromagnetic simulations. As mentioned previously, this is especially pertinent for hyperbolic modes, as the volume-confined nature gives rise to a strong thickness dependence of the polariton dispersion.[Reference Dai, Fei, Ma, Rodin, Wagner, McLeod, Liu, Gannett, Regan, Thiemens, Dominguez, Castro Neto, Zettl, Keilmann, Jarillo-Herrero, Fogler and Basov7] Experiments were carried out using an IR microscope (Bruker Hyperion 2000) coupled to a Fourier-transform IR (FTIR) spectrometer (Bruker Vertex 70V), with a liquid-nitrogen-cooled HgCdTe (MCT) detector (Infrared Associates FTIR 24-0.25) and a SiC-globar source. To perform ATR measurements, the sample was slowly brought into contact with the prism (0.5 N, ~1 mm/s) that is mounted on the ATR microscope objective and carefully lowered after measurement (~1 mm/s), to minimize damage to the flake. After each measurement the prism was cleaned with isopropyl alcohol on a lens tissue. The spectra were collected using both unpolarized and polarized IR light via a germanium wire grid polarizer (Pike Technologies 090-1500) and referenced to the prism in contact with a gold mirror (to minimize attenuation from atmospheric water).
A representative, p-polarized ATR reflectance spectra of a 490 nm thick flake of naturally abundant hBN is provided in Fig. 2(a). We measure a series of resonant absorbing modes, in both the lower and upper reststrahlen bands, as well as additional peaks that can be assigned to absorption within the silicon dioxide layer. These results compare extremely well with numerical simulations using both transfer matrix and finite element methods, suggesting that we can achieve good optical contact between prism and sample and high degree of angular selectivity. The small deviations between experiment and theory can be attributed to a combination of angular dispersion in the incident light and thickness non-uniformities of the hBN sample. To confirm that the resonant modes shown in Fig. 2(a) are hyperbolic modes in the hBN flake, we used finite element method (FEM) simulations to plot the electromagnetic field profiles (z-component of electric field) for each mode, shown in Fig. 2(c) (i–vii). In the lower reststrahlen band we observe two modes (i) and (ii), with different propagation angles and negative phase velocity,[Reference Yoxall, Schnell, Nikitin, Txoperena, Woessner, Lundeberg, Casanova, Hueso, Koppens and Hillenbrand34] characteristic of Type I HPhPs in hBN. We note that the Type I reststrahlen region overlaps with an absorption band in the underlying silicon dioxide, which enhances absorption in these modes. In the upper reststrahlen band we observe three modes, again each with different propagation angles but instead with positive phase velocity, corresponding to Type II HPhPs. This demonstrates that ATR measurements can be used to directly measure hyperbolic polariton modes and thus provide access to the dispersion relationship.
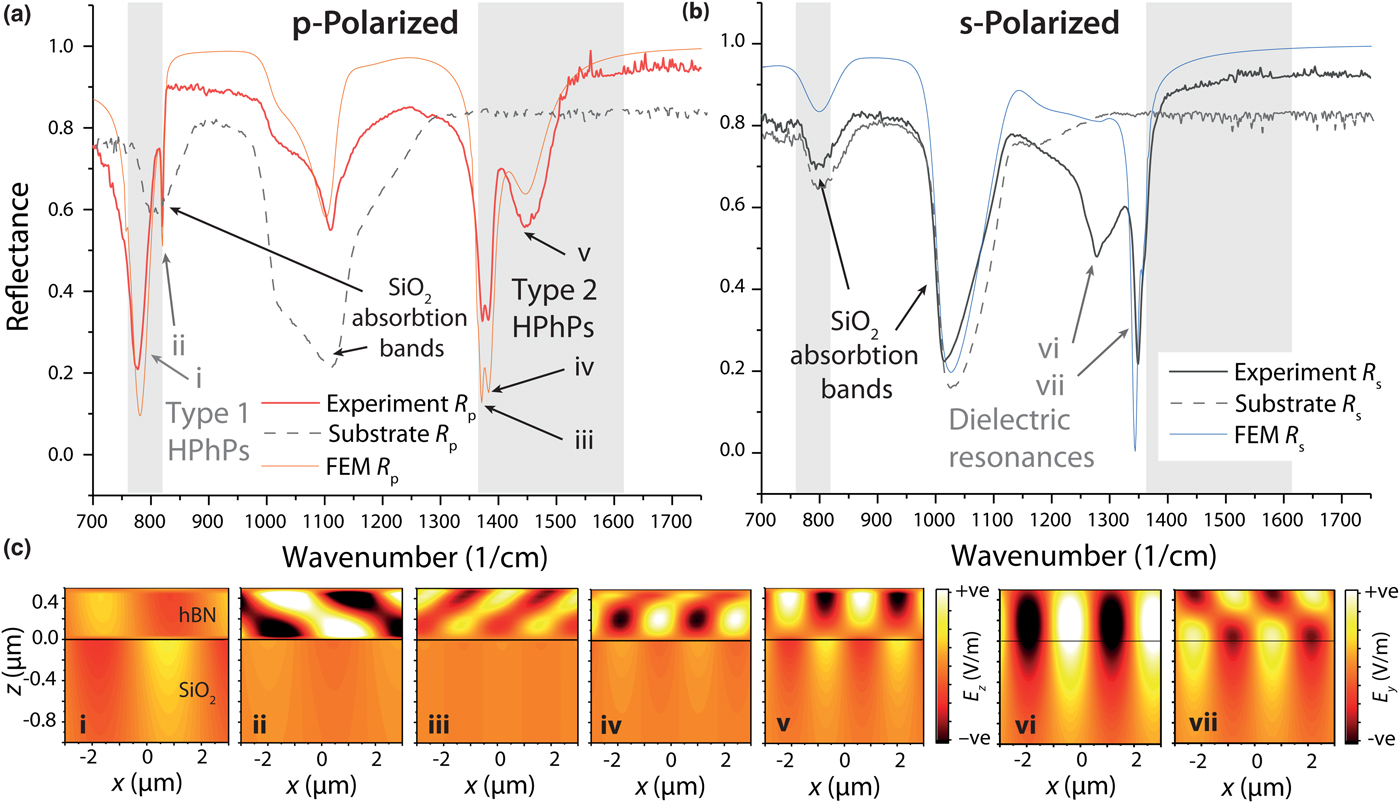
Figure 2. (a) p- (red solid curve) and (b) s-polarized (black solid curve) ATR micro-spectroscopy measurement of a 490 nm thick hBN flake. Corresponding numerical calculations for this sample under both polarizations are provided as the orange and blue solid lines in (a) and (b), respectively. Both finite element (FEM) and transfer matrix techniques were performed, but as no appreciable differences were observed between the two calculated reflection spectra, only the former is plotted here. The gray shaded areas indicate the regions of the lower and upper reststrahlen bands of hBN, where this material is naturally hyperbolic. Multiple resonances are observed, which can be identified as Type I, Type II, and dielectric resonances [labeled in (a) and (b)] by examining electromagnetic field profiles provided in (c), with each mode designated in both a, b, and c by the roman numerals i–vii.
In addition to the hyperbolic modes, in s-polarized reflectance [Fig. 2(b)] we observe two peaks close to the upper reststrahlen band of hBN. In this spectral region all components of the hBN dielectric function are positive, so they cannot be associated with polaritons. However, below the TO phonon energy the dielectric constant of a phononic material can become extremely large and positive, with a refractive index much larger than that in non-dispersive materials.[Reference Schuller, Zia, Taubner and Brongersma35] This means that dielectric cavity, Mie resonances[Reference Kuznetsov, Miroshnichenko, Brongersma, Kivshar and Luk'yanchuk36] can be formed in extremely sub-wavelength cavities that can be comparable in size with polaritonic structures.[Reference Caldwell, Glembocki, Sharac, Long, Owrutsky, Vurgaftman, Tischler, Bezares, Wheeler, Bassim, Shirey, Francescato, Giannini and Maier37] For clarity we note that Mie resonances, despite the nanoscale size of the structures cannot be considered sub-diffractional, as the wavelength compression is due purely to the extremely high index of refraction near this TO phonon absorption band. In our case we observe both first and second order dielectric resonances [Figs. 2(b) and 2(c), vi and vii], due to the refractive index of approximately 7.9 and 15.8 at these two resonant frequencies, respectively, which as stated is significantly higher than can be obtained from typical, weakly dispersing dielectric materials. Highly anisotropic dielectric resonances have not been measured previously, and could potentially be used for the creation of nanoscale dielectric Mie-type resonators in the IR,[Reference Staude and Schilling38, Reference Ginn, Brener, Peters, Wendt, Stevens, Hines, Basilio, Warne, Ihlefeld, Clem and Sinclair39] for instance enabling Huygens mode-based devices[Reference Howes, Wang, Kravchenko and Valentine40] or perfect absorbing coatings.[Reference Li and Valentine41]
As the angle of the incident light is difficult to vary in our microscope-based setup, we cannot systematically plot out the dispersion curve for a given flake as the in-plane momentum cannot be controlled. We note that with more advanced objective designs a variable incidence angle could potentially be realized. Instead, we can study the dispersion of each mode using different thicknesses of boron nitride. Unlike in conventional polaritonic systems, where the mode frequency is relatively insensitive to film thickness, as mentioned above, hyperbolic modes are extremely sensitive to such changes. This is because each HPhP in the spectrum can be considered an “etalon-like” mode since hyperbolic polaritons propagate within the bulk material at a distinct, frequency-dependent propagation angle.[Reference Poddubny, Iorsh, Belov and Kivshar3, Reference Giles, Dai, Glembocki, Kretinin, Sun, Ellis, Tischler, Taniguchi, Watanabe, Fogler, Novoselov, Basov and Caldwell42, Reference Ishii, Kildishev, Narimanov, Shalaev and Drachev43] However, the etalon modes are dictated by the highly compressed HPhP wavelength rather than the free-space value.[Reference Dai, Fei, Ma, Rodin, Wagner, McLeod, Liu, Gannett, Regan, Thiemens, Dominguez, Castro Neto, Zettl, Keilmann, Jarillo-Herrero, Fogler and Basov7] Therefore, by changing the thickness of the hBN flake, we can also tune the modal spectrum [Figs. 3(d)–3(f)], as has been shown in earlier work.[Reference Dai, Fei, Ma, Rodin, Wagner, McLeod, Liu, Gannett, Regan, Thiemens, Dominguez, Castro Neto, Zettl, Keilmann, Jarillo-Herrero, Fogler and Basov7] To demonstrate this, we measure a series of different thicknesses of hBN flakes in the Type I HPhP [p-pol., Fig. 3(a)], dielectric [s-pol., Fig. 3(b)], and II HPhP regimes [p-pol., Fig. 3(c)]. We do not include thickness varying data for s-pol. in the Type I region as only absorption from the SiO2 substrate was observed. All the modes discussed above were observed to continuously tune as the thickness is increased, with the thickness of the film also determining the number of modes observable in experiments. This is consistent with an etalon-like behavior of both hyperbolic and dielectric modes in the hBN films. Because of this, it is also possible to use this spectral response to extract the corresponding dielectric function of these materials using variable thickness ATR spectroscopy. We subsequently fit the peak positions in Figs. 3(a)–3(c), and compare the peak positions to a numerical model in Figs. 3(d)–(f). The data in Fig. 3(a) overlap with an absorption band in SiO2 [as seen in Fig. 2(a)], so an additional peak was used in fitting these spectra, allowing us to distinguish between absorption in the substrate and in hBN. The peak positions observed in experiments provide good quantitative agreement with our calculated results. Our numerical results indicate that 5 nm films should show absorption as high as 60% making the properties of ultra-thin films measurable, even in the presence of substrate absorption. While the polaritonic modes in hBN are extremely sensitive to both thickness and incident angle, the dielectric modes are weakly dependent on incidence angle. This provides a useful approach to calibrating the correct incidence angle to use for a given ATR objective prism.
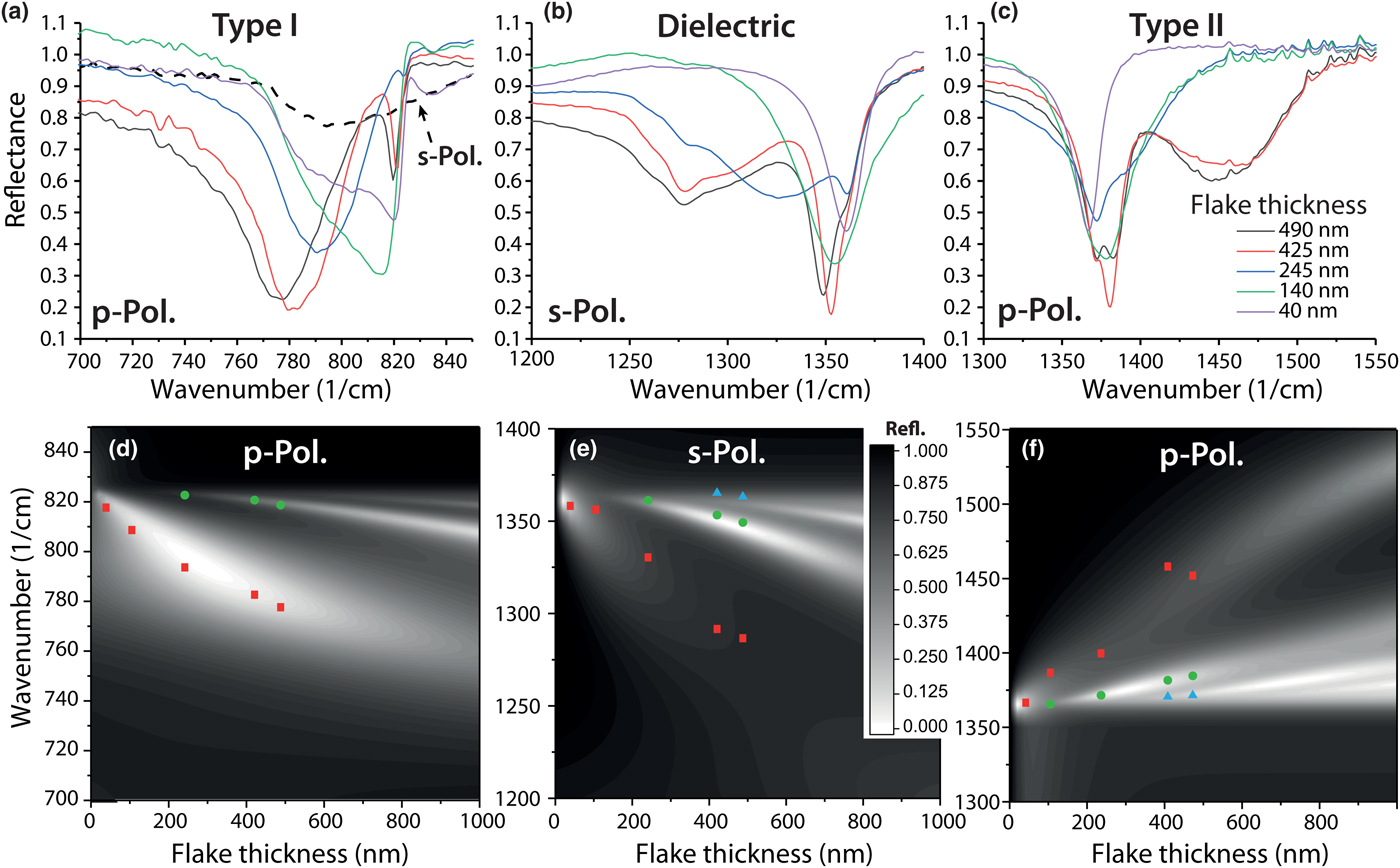
Figure 3. Thickness dependence of ATR modes. (a)–(c) Experimentally measured reflectance spectra of various thicknesses of natural hBN flakes within the (a) lower reststrahlen (p-polarized), anisotropic dielectric (s-polarized), and (c) upper reststrahlen (p-polarized) bands. Contour plots of the simulated reflectance spectra for a range of hBN thicknesses are provided in (d)–(f) for the same spectral regions as in (a)–(c), respectively. As the thickness increases, the modes tune in frequency and the number of resolvable modes increases, mirroring the dispersion of Fig. 1(b). Symbols in (d)–(f) correspond to the position of the peaks extracted from the experimental data presented in (a)–(c). Red squares represent 1st order modes, green circles 2nd order, and cyan triangles 3rd order.
To illustrate the potential of this technique for distinguishing different materials, determining their hyperbolic properties and the potential for extracting the IR dielectric function, we compare hBN with three different isotopic purities of boron: 20% 10B/80% 11B (naturally abundant), ~99% 10B, and ~99% 11B. In Fig. 4(a), we show an ATR reflectance spectrum for three such flakes with similar thicknesses. Due to the shifting of the TO phonon energy with isotopic concentration,[Reference Giles, Dai, Vurgaftman, Hoffman, Liu, Lindsay, Ellis, Assefa, Chatzakis, Reinecke, Tischler, Fogler, Edgar, Basov and Caldwell20] the resonances of the 11B- and 10B-enriched hBN, red and blue shifts with respect to natural hBN, respectively. We also note a reduction in the resonance linewidth that is due to reduced phonon scattering in isotopically enriched materials. This result illustrates that the ATR approach developed in this paper can be used to launch and measure polaritons in different materials with different isotopic concentrations. In principle, by implementing a least-squares fitting program and considering several thicknesses of hBN flakes, it would be possible to extract the dielectric parameters of the material studied. However, we note from our transfer matrix calculations in Figs. 3(d) and 3(e) that when the thickness of the hBN films tends to zero, the resonance in the ATR spectra becomes located at the TO phonon frequency and strongly absorbing. The significant absorption in thin films of hBN is attributed to the high-photonic density of states in a hyperbolic material. By fitting the calculated absorption line [shown in Fig. 4(b), inset] with a Lorentzian lineshape, we can extract the full-width at half-maximum (Γ), and plot this as a function of film thickness [Fig. 4(b)]. We observe that Γ increases linearly with thickness, and by extrapolating down to zero thickness we can infer the damping constant of the hBN film. The damping constant can be approximated at zero thickness because a polariton absorption linewidth is a combination of both radiative and material losses[Reference Raether25]—and as the film thickness tends to zero, light cannot couple to the hBN—resulting in a linewidth that tends to the intrinsic material loss. This provides a relatively simple approach to estimating the damping constant in Type II hyperbolic thin films.
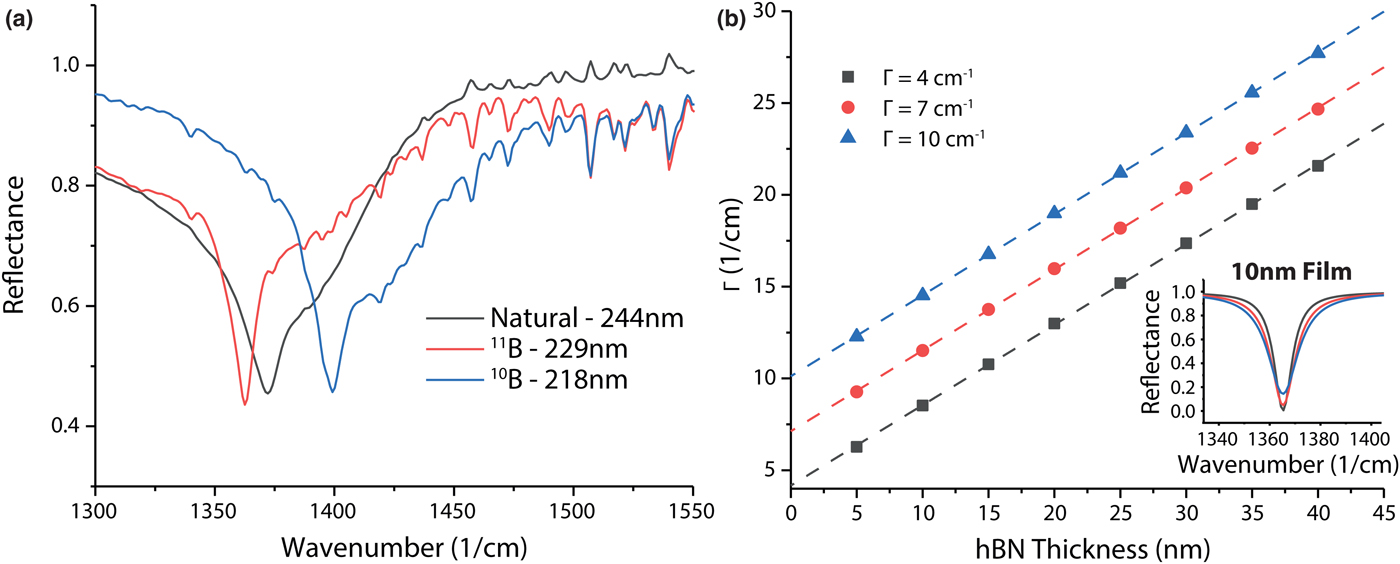
Figure 4. Identification and measurement of isotopically enriched materials using ATR micro-spectroscopy. (a) Measurements of three flakes of hBN with different isotopic purities, showing the spectral shift in the phonon polariton associated with a change in the TO phonon frequency. Corresponding thicknesses are provided in the legend. (b) Dependence of the full-width at half-maximum (Γ) of the reflection dip in the ATR spectra presented in (a), demonstrating that as the film tends to zero thickness the width of the resonance is approximately equal to the damping constant of the hBN.
In conclusion, we have proposed and demonstrated the ability to implement ATR micro-spectroscopy as a means for launching and probing hyperbolic polaritons and dielectric resonances in 2D materials. This approach relies on both careful definition of the incident angle and polarization state. Using this method, we measured three distinct HPhPs in the upper, and two in the lower reststrahlen band of hBN, as confirmed by comparisons with numerical models. Furthermore, we observed highly anisotropy, extreme-index dielectric resonances that have not been detected previously. Subsequently, by measuring a range of flakes with different thicknesses, we were able to show the dispersing nature of hBN polaritons and that our technique can distinguish flakes of different materials, demonstrated here for varying isotopic purity hBN. Finally, we used electromagnetic simulations to show that this approach could be used to estimate the dielectric properties of hBN flakes. While this technique has limitations, most notably the single-incident angle, the broad spectral range allows flexible, simple investigations of a range of different materials of varying size, shape, or polariton frequencies. This makes this technique the only means of providing quick, high throughput measurements of a range of different potential hyperbolic materials.
Acknowledgments
Support for J.D.C., J.R.N., and T.G.F. was provided by the Office of Naval Research through grant number N000141812107 and through funds administered by the US Naval Research Laboratory through the Nanoscience Institute. The initial efforts of this work were funded through the NRL Long-Term Training program. T.T. and T.W.W.M. acknowledge support from the Deutsche Forschungsgemeinschaft (DFG) within SPP-1327 “Sub-100 nm structures for optical and biomedical applications” and the Ministry of Innovation, Science, Research and Technology of the German State of North Rhine-Westphalia. Support for J.H.E. and S.L. provided from the Materials Engineering and Processing program of the National Science Foundation, award number CMMI 1538127 is greatly appreciated.


