


Introduction
Outbreaks of food- and water-borne bacterial pathogens pose a serious threat to human health. A recent report from the Centers for Disease Control and Prevention (CDC) estimates that 48 million illnesses, 128,000 hospitalizations, and 3000 deaths are caused by food-borne pathogens (such as Salmonella, Campylobacter spp., and Escherichia coli) each year in the USA.[1] In fact, bacteria-related infectious diseases are responsible for one-third of global mortality every year. In particular, E. coli, a large and common group of gram-negative bacteria, are a major cause for infectious disease outbreaks due to their ability to produce Shiga-like toxins or verotoxins, which can result in serious symptoms including haemorrhagic colitis, peritonitis, bloody diarrhoea and haemolytic-uremic syndrome.[Reference Su, Ma, Shang, Liu, Yin and Ai2] In view of the low infection dose (10–100 cells), the US EPA regulation requires that no pathogens are allowed in drinking water. In this regard, developing facile, rapid, accurate, sensitive, and real-time methods for detection of pathogenic bacteria remains a challenging and important issue in the fields of public health, clinical diagnosis, environmental monitoring, and food safety.
Bacterial detection is traditionally based on microbiological methods, which can provide reliable results, but the requirement for a pre-enrichment step, selective enrichment procedures, and subsequent biochemical analysis makes these methods labor-intensive and time-consuming, as the entire process can take several days. Nucleic acid amplification-based genetic detection methods, such as the widely used polymerase chain reaction (PCR) method, allow for more sensitive detection of bacteria in a much reduced time.[Reference Belgrader, Benett, Hadley, Richards, Stratton, Mariella and Milanovich3] However, such methods do come with disadvantages with respect to laborious sample pre-purification, DNA extraction, and enzymatic amplification. Other common tools for analysis of bacteria are expanded immunology-based methods (e.g. enzyme-linked immunosorbent assays) that couple with various signal transduction principles (e.g. amperometric, potentiometric, piezoelectric, impedimetric and optical-based sensors).[Reference Ivnitski, Abdel-Hamid, Atanasov and Wilkins4] However, these methods are associated with drawbacks that include relatively complex procedures, lack of specificity and stability, and low detection sensitivity. In more recent years, a number of novel techniques have been developed for bacterial detection; these include surface-enhanced Raman spectroscopy (SERS),[Reference Jarvis and Goodacre5] surface plasmon resonance (SPR),[Reference Oh, Lee, Chun, Bae, Lee and Choi6] microchip electrophoresis,[Reference Wang, Cheng, Ge, Wang, Wang, He and Fang7] and mass spectrometry.[Reference Nicolaou, Xu and Goodacre8] These techniques offer excellent performance but are expensive and time-consuming, and generally are not amenable to testing in the field.
Recent advances in nanoscience and nanotechnology have enabled the rational design of nanomaterial-assisted biosensors for detection of pathogenic bacteria that take advantage of some unique physical and chemical properties of nanomaterials to achieve high sensitivity, low cost, and short analysis times.[Reference Sanvicens, Pastells, Pascual and Marco9, Reference Ray, Khan, Singh, Senapati and Fan10] For example, nanostructured porous SiO2-based interferometric sensors,[Reference Massad-Ivanir, Shtenberg, Zeidman and Segal11, Reference Massad-Ivanir, Shtenberg, Tzur, Krepker and Segal12] quantum dot-based fluorescent biosensors,[Reference Hahn, Tabb and Krauss13, Reference Edgar, McKinstry, Hwang, Oppenheim, Fekete, Giulian, Merril, Nagashima and Adhya14] noble metal nanomaterial-based surface plasmon (e.g. SPR,[Reference Wang and Irudayaraj15, Reference Fu, Park and Zhao16] light scattering,[Reference Singh, Senapati, Wang, Griffin, Neely, Candice, Naylor, Varisli, Kalluri and Ray17, Reference Xu, Chen, Wei, Xia, Liu and Li18] surface-enhanced Raman scattering[Reference Premasiri, Moir, Klempner, Krieger, Jones and Ziegler19, Reference Kuo, Chang, Chang and Yeh20]) enabled biosensors, magnetic nanoparticle-based sensing platforms,[Reference Kell, Stewart, Ryan, Peytavi, Boissinot, Huletsky, Bergeron and Simard21–Reference Chung, Reiner, Budin, Min, Liong, Issadore, Lee and Weissleder24] and carbon nanomaterial-based electronic sensors,[Reference Zelada-Guillén, Riu, Düzgün and Rius25, Reference Mannoor, Tao, Clayton, Sengupta, Kaplan, Naik, Verma, Omenetto and McAlpine26] have been integrated with antibodies, enzymes, and aptamers as recognition elements to produce new biosensor platforms.
Most of the detection strategies outlined above require the creation of a sensing interface through covalently conjugating biorecognition elements onto the nanomaterial surface using wet-chemical methods, such as carbodiimide-mediated coupling[Reference Sapsford, Algar, Berti, Gemmill, Casey, Oh, Stewart and Medintz27] or chemisorption of thiolated species.[Reference Algar, Prasuhn, Stewart, Jennings, Blanco-Canosa, Dawson and Medintz28] The requirement for surface functionalization or modification makes these types of assays somewhat expensive, time-consuming, labour-intensive, irreproducible and difficult to scale for manufacturing. Modification and coupling may also interfere with the activity and affinity of bio-recognition elements toward their targets, often resulting from the uncontrolled display of these elements on nanomaterials. For example, anchoring antibodies with functional groups can make them adopt orientations that are not suitable for antigen binding on the nanomaterial surface.[Reference Soukka, Härmä, Paukkunen and Lövgren29, Reference Mann, Alava, Craighead and Dichtel30]
To overcome these limitations, some recent efforts have focused on the development of non-covalent functionalization of nanomaterial-assisted biosensors, and in particular on the non-covalent binding of biomolecules to graphene surfaces. Interestingly, several recent studies have demonstrated that non-covalent binding to graphene surfaces does not significantly affect the binding activity of biorecognition elements such as antibodies, aptamers, DNAzymes.[Reference Mannoor, Tao, Clayton, Sengupta, Kaplan, Naik, Verma, Omenetto and McAlpine26, Reference Chen, Zhang, Zhou, Xiang, Ji, Zheng, He and Wang31–Reference Zhao, Kong, Zhang, Meng, Liu, Tan, Shen and Yu33] For example, a recent study used self-assembly of antimicrobial peptides to create a wireless graphene nanosensor for extremely sensitive detection of pathogenic bacteria,[Reference Mannoor, Tao, Clayton, Sengupta, Kaplan, Naik, Verma, Omenetto and McAlpine26] while aptamers bound to graphene were shown to be selective for their cognate protein targets.[Reference Chen, Zhang, Zhou, Xiang, Ji, Zheng, He and Wang31] Unfortunately, peptide-based biosensors show poor specificity due to the semi-selective nature of antimicrobial peptides, while pathogen-specific aptamers are not widely available. Therefore, engineering bio/nano-bacteria sensing platforms with high affinity and specificity based on non-covalent attachment of bio-recognition elements on the surface of nanomaterials remains a great challenge.
Recently, our group has shown that RNA-cleaving DNAzymes that are activated by a specific pathogen can be isolated from random-sequence DNA libraries using in vitro selection.[Reference Ali, Aguirre, Lazim and Li34–Reference Morrison, Rothenbroker and Li38] Such DNAzymes can be derived to specifically recognize intended species or strains of pathogenic bacteria. Because this approach uses an extraordinarily large random-sequence pool containing as many as ~1016 different sequence variations, in theory, it can be used to obtain highly specific DNAzymes for any given bacterium of interest. For this reason, this method represents a very attractive option for generating recognition elements for highly selective bacterial pathogen detection. On the other hand, two-dimensional graphene-based materials offer great potential as excellent signal transducers in engineering biosensors.[Reference Chen, Feng and Li39–Reference Feng, Wu and Qu41] In particular, the sp2-conjugated domains of graphene materials allow the direct interfacing of nucleic acid-based biorecognition moieties through non-covalent π–stacking interactions,[Reference Varghese, Mogera, Govindaraj, Das, Maiti, Sood and Rao42] thus laying a powerful foundation for the design of nucleic acid-based sensing platforms.[Reference Morales-Narváez and Merkoçi43, Reference Kochmann, Hirsch and Wolfbeis44]
The objective of this study was to evaluate and optimize a biosensing platform that takes advantage of the ability of graphene to adsorb DNA non-covalently as well as the ability of man-made DNAzymes to achieve highly specific recognition of bacterial pathogens. More specifically, we describe a fluorescent biosensor that functions by direct interfacing of colloidal graphene with an E. coli-responsive RNA-cleaving DNAzyme for real-time, sensitive and highly selective detection of E. coli as the model pathogen. The featured signaling mechanism should be general and can be applied to develop “mix-and-read” type assays for the detection of food-borne and medically important bacterial pathogens.
Materials and methods
Chemicals and reagents
T4 DNA ligase, T4 polynucleotide kinase (PNK), and adenosine 5′-triphosphate (ATP) were purchased from MBI Fermentas. Chemicals and solvents were purchased from Sigma-Aldrich and used without further purification. Water was purified with a Milli-Q Synthesis A10 water purification system. All modified and unmodified DNA oligonucleotides were obtained from Integrated DNA Technologies (IDT), and purified by standard 10% denaturing (8 M urea) polyacrylamide gel electrophoresis (PAGE). The sequences of the DNA molecules were as follows:
RFS1: CACGGATCCT GACAAGGATG TGTGCGTTGT CGAGACCTGC GACCGGAACA CTACACTGTG TGGGATGGAT TTCTTTACAG TTGTGTGCAG CTCCGTCCG (5′→3′)
RFS2: CACGCTGTAC GGATGGAGTC GCGAGCCTGC GACCGGAAAT GAAAGATCTT TCGCGTTTTG CTCATGCGAT GGATTTTTTA CAGTGGGCAG CTCCGTCCG (5′→3′)
FS1: ACTCTTCCTA GCTrA TGGTTC GATCAAGA-FAM (5′→3′)
RFT1: CTAGGAAGAG TCGGAGCTG (5′→3′)
Fluorescence (FL) measurements
Time-dependent FL measurements were performed for samples present in a 1 cm path length cuvette using a Cary Eclipse FL spectrophotometer (Varian) with an excitation wavelength of 494 nm and an emission wavelength of 518 nm. The bandpasses for excitation and emission were set at 5 nm/10 nm. Photomultiplier tube voltage was set at 600 V. The fluorescent images of gels were obtained using a Typhoon 9200 variable mode imager (GE Healthcare) and analyzed by ImageQuant software (Molecular Dynamics).
Preparation of DNAzymes
DNA phosphorylation was done by incubating 200 pmol of FS1 with 20 units of PNK at 37 °C for 30 min in a 100 µL reaction mixture containing 50 mM Tris-HCl (pH 7.6 at 25 °C), 10 mM MgCl2, 5 mM DTT, 0.1 mM spermidine and 1 mM ATP. The reaction was stopped by heating the mixture at 90 °C for 5 min. 2 µL of RFS1 (100 µM) and RFT1 (100 µM) were then added to the solution and the mixture was heated to 90 °C for 40 s and cooled to room temperature for 10 min. Finally, 10 units of T4 DNA ligase were added for DNA ligation at 25 °C for 2 h. The ligation mixture (150 µL) contained 40 mM Tris-HCl (pH 7.6 at 25 °C), 10 mM MgCl2, 10 mM DTT and 0.5 mM ATP. The ligated products were concentrated by standard ethanol precipitation and further purified by 10% denaturing PAGE (dPAGE).
Bacterial sample preparation
E. coli K12 cells were grown overnight in 6 mL of Luria broth (LB) at 37 °C with constant shaking. Following OD600 measurements, the bacterial cultures were serially diluted by107-fold with LB, and plated on a LB agar plate using the spread plate method. After incubation at 37 °C for 12 h, E. coli K12 colonies on the plate were counted to determine the number of colony forming units per milliliter (CFU/mL) in the original bacteria cultures. Cells in the sample were then removed by centrifugation at 5000 g for 10 min at 4 °C. The supernatant or crude extracellular mixture (CEM) was aliquoted and stored at −80 °C. The stock CEM samples corresponding to 104 to 107 CFU/mL were prepared by the dilution of the original supernatant. CEM samples from other bacteria were prepared in a similar manner. Another sample type was a crude intracellular mixture (CIM), which was made by first ultrasonically treating cells for 10 min, followed by centrifugation as mentioned above. The CEM and CIM samples were further treated using a 50 K Nanosep filter (Pall Corporation), with the filtrates being used for assays.
Procedure for bacterial detection assay
In a typical assay, 50 µL of reaction buffer (1 × RB, which contained 50 mM HEPES, pH 7.5, 150 mM NaCl, 15 mM MgCl2), 10 µL of RFD-EC (4.2 µM) and 30 µL of colloidal graphene solution (100 µg/mL) were first mixed in a micro-centrifuge tube at 25 °C. After 20 min incubation, the mixture was transferred to a quartz cuvette. In order to reduce the nonspecific binding sites on the graphene surface, 10 µL of 2% (w/w) BSA solution was added and incubated for 10 min. Subsequently, 40 µL of 2 × RB and 10 µL of CEM with different dilutions (in 1 × RB) were added to perform time-dependent FL measurements at λex /λem = 494/518 nm.
Detection of E. coli in blood samples
Freshly cultured E. coli K12 cells with different dilutions were first spiked in 1 mL of a human blood sample purchased from Innovative Research Inc. Then the sample was centrifuged at 13,000 g for 10 min at 4 °C to remove the plasma. The obtained cell pellet was suspended in 500 µL of 1 × RB, sonicated for 1 min, put on the ice for 5 min, and sonicated for another 2 min to produce CIM. The resultant suspension was then centrifuged at 13,000 g for 15 min. 10 µL of the supernatant (CIM in 1 × RB) was then added to the RFD-EC/graphene mixture to perform time-dependent FL measurements at λex /λem = 494/518 nm.
Single live cell detection
E. coli K12 cells were first cultured in LB overnight at 37 °C under continuous shaking. The bacteria were then mixed with 30% glycerol and were serially diluted in tenfold intervals six times. The number of living cells was determined by the microbial plate counting method. It was estimated that the first stock with a final dilution of 107-fold contained an average of 60 cells per 100 µL. From this stock, bacterial stock with 6 cells per 100 µL was prepared by tenfold dilution with LB containing 15% glycerol. Finally, CIM samples were prepared as follows: (1) incubating 100 µL of the above stock (6 cells/100 µL) with 6 mL of LB containing 15% glycerol; (2) growing at 37 °C with shaking for different periods of time; (3) ultrasonically treating the culture and removing the cells by centrifugation.
Results
Principle of graphene-DNAzyme-based fluorescent biosensor
The working principle and key functionalities of the biosensor are illustrated in Fig. 1. The sensing system represents a combination of two main units that self-assemble into a hybrid biosensor. The first unit is RFD-EC, a 125-nucleotide (nt) DNAzyme that functions as both the recognition element for E. coli and the FL producer. The second unit is graphene, which is employed as a transducer that converts the E. coli-DNAzyme recognition event into a measurable signal. The self-assembly occurs by means of non-covalent adsorption of RFD-EC onto the graphene surface as a result of π-π stacking interactions.[Reference Varghese, Mogera, Govindaraj, Das, Maiti, Sood and Rao42] The adsorption leads to low FL due to the excellent quenching ability of graphene.[Reference Morales-Narváez and Merkoçi43–Reference Liu, Zhao, Quan, Chen and Fan47] With the introduction of an E. coli sample, the target for the DNAzyme competes with the graphene surface to bind RFD-EC due to the specific DNAzyme-target interaction. The released RFD-EC catalyzes the cleavage of the RNA linkage to produce two shorter DNA strands including a 14 nt fluorophore-labeled strand, which can disturb the original graphene–DNAzyme interaction, thereby inducing the cleaved RFD-EC strand to be separated from the graphene and in turn producing a dramatic increase in FL. In this way, the target recognition event is efficiently converted into a measurable signal.
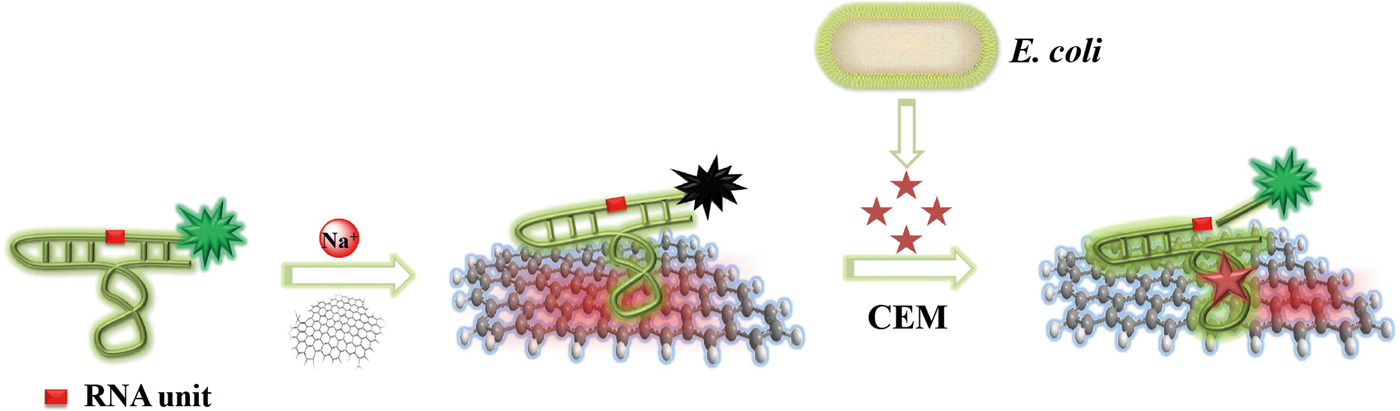
Figure 1. Schematic illustration of the fluorogenic biointerfaced sensing platform for E. coli detection based on a self-assembled graphene-DNAzyme complex.
Functionalization of graphene with DNAzyme
As mentioned above, the key feature of the sensing system was the non-covalent attachment of the DNAzyme RFD-EC to the graphene surface under controlled conditions. A kinetics study was carried out to record the time-dependent FL changes of RFD-EC after its exposure to the graphene colloids in the RB (Fig. S1A). Note that the graphene colloids were stable against irreversible coagulation in 1 × RB. We observed that the FL of the DNAzyme/graphene mixture was gradually reduced with time. A similar result was also obtained for RFD-RS, the inactive DNAzyme control with a mutated sequence (Fig. S1B). The FL reduction was found to be dependent on the graphene concentration (Fig. S2). A reduction in FL intensity of 91.5% and 99.6% was reached in 10 and 30 min, respectively, in the presence of 30 µg/mL graphene. It is well known that salt concentration can determine the binding affinity and loading capacity of soft DNA molecules on graphene or Au nanoparticle surfaces, where higher salt concentrations often give rise to more DNA adsorption.[Reference Liu48] For a large DNA molecule with a well-defined (and relatively rigid) structure such as RFD-EC, we speculate that a salt like NaCl can screen electrostatic repulsion between the negatively charged graphene and the negatively charged DNAzyme, which might facilitate the exposure of more DNA bases to the graphene surface for stronger adsorption. Furthermore, according to the classical Derjaguin-Landau-Verwey-Overbeek theory,[Reference Liu, Zhao, Chen, Yu and Quan49] salt can modulate the surface or edge charge density of graphene colloids. Based on these considerations, a series of fluorescence assays were carried out to record the time-dependent quenching of RFD-EC at a fixed DNA concentration (280 nM) but with varying concentrations of graphene and NaCl in addition to 50 mM PBS (pH 7.6) (Fig. S3). Remarkably, it was observed that the FL reduction rate and maximal quenching were dramatically improved upon increasing the NaCl concentration from 0 mM to 300 mM (Fig. S4). At a graphene concentration of 20 µg/mL, the maximal quenching was increased from 41.4% in the absence of NaCl to 80.0% in the presence of 300 mM NaCl. The corresponding quenching rate also increased from 0.27/min to 0.70/min. Taken together, colloidal graphene can indeed act as a binding scaffold for the relatively large DNAzyme molecule and higher salt concentrations lead to stronger DNAzyme/graphene binding.
Validation of the assay
The self-assembled graphene-DNAzyme complex (made of 280 nM RCD-EC and 30 µg/mL graphene) was found to be a highly stable system, as no FL increase was seen for at least 2 hours (Fig. S5A). This system was then examined for response to E. coli using time-dependent FL measurements. As shown in Fig. 2(a), an immediate decrease of the DNAzyme FL occurred in the presence of graphene. However, when the E. coli sample (which contained the target for DNAzyme activation) was added, the FL intensity gradually recovered, suggesting that this target can compete successfully with graphene for RFD-EC binding. The binding event led to the cleavage of RFD-EC and the subsequent detachment of cleaved products from graphene surface, leading to over a 30-fold FL enhancement after 30 min [Fig. 2(b)]. In sharp contrast, only a very small change in FL was observed for the inactive DNAzyme control RFD-RS upon target addition (Fig. S5B), which might be ascribed to a small amount of non-specific desorption of RFD-RS from the graphene surface by the complex biologic sample.
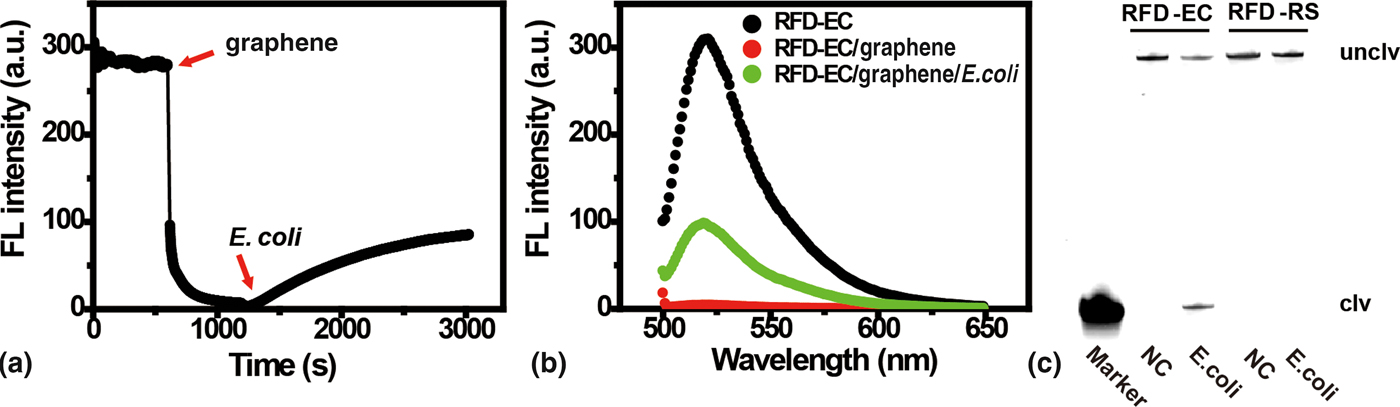
Figure 2. (A) The kinetic response of RFD-EC to sequential addition of graphene and a target-containing sample prepared from 5 × 10⁷ cells. λex/λem = 494/518 nm. (B) Fluorescence emission spectra of solutions containing RFD-EC only, RFD-EC mixed with graphene, and RFD-EC mixed first with graphene and then with the target-containing sample. [RFD-EC] = 280 nM; [graphene] = 30 µg/mL. λex = 494 nm. (C) 10% dPAGE analysis of the cleavage reaction mixtures of RFD-EC and RFD-RS (inactive DNAzyme control) after incubation with the target-containing sample. NC, negative control.
To verify that the above FL response indeed originated from the cleavage reaction of RFD-EC, the cleavage mixture was analyzed by 10% denaturing polyacrylamide gel electrophoresis. As shown in Fig. 2(c), when the graphene/RFD-EC complex was treated with the bacterial sample, the fluorescently labeled RFD-EC was indeed cleaved, producing the expected cleavage product (the DNA band in the lane labeled as “Marker”, which was obtained from treatment of RFD-EC with 0.25 M NaOH at 90 °C for 20 min).[Reference Mei, Liu, Brennan and Li50] In contrast, no cleavage band was observed for RFD-RS treated with E. coli or for RFD-EC without treatment with E. coli. Collectively, these results clearly indicate that the target-induced DNAzyme cleavage, rather than simple DNAzyme displacement from graphene, is responsible for the observed FL enhancement, and that the short fluorophore-labeled DNA fragment is unable to re-adsorb to the graphene surface after cleavage.
Assay performance
To assess the performance and sensitivity of the biosensor for the detection of E. coli, we measured the time-dependent FL of the sensor upon addition of target-containing samples prepared from varying concentrations of E. coli. As shown in Fig. 3, the signal increased when the concentration of E. coli cells was increased from 105 to 107 CFU/mL. The system afforded a limit of detection of 105 CFU/mL. The selectivity of the sensor for E. coli was also tested against seven gram-negative bacteria and 4 gram-positive bacteria. These control bacteria were not able to induce a significant FL increase (Fig. S6). These results demonstrate the high specificity of the biosensor.
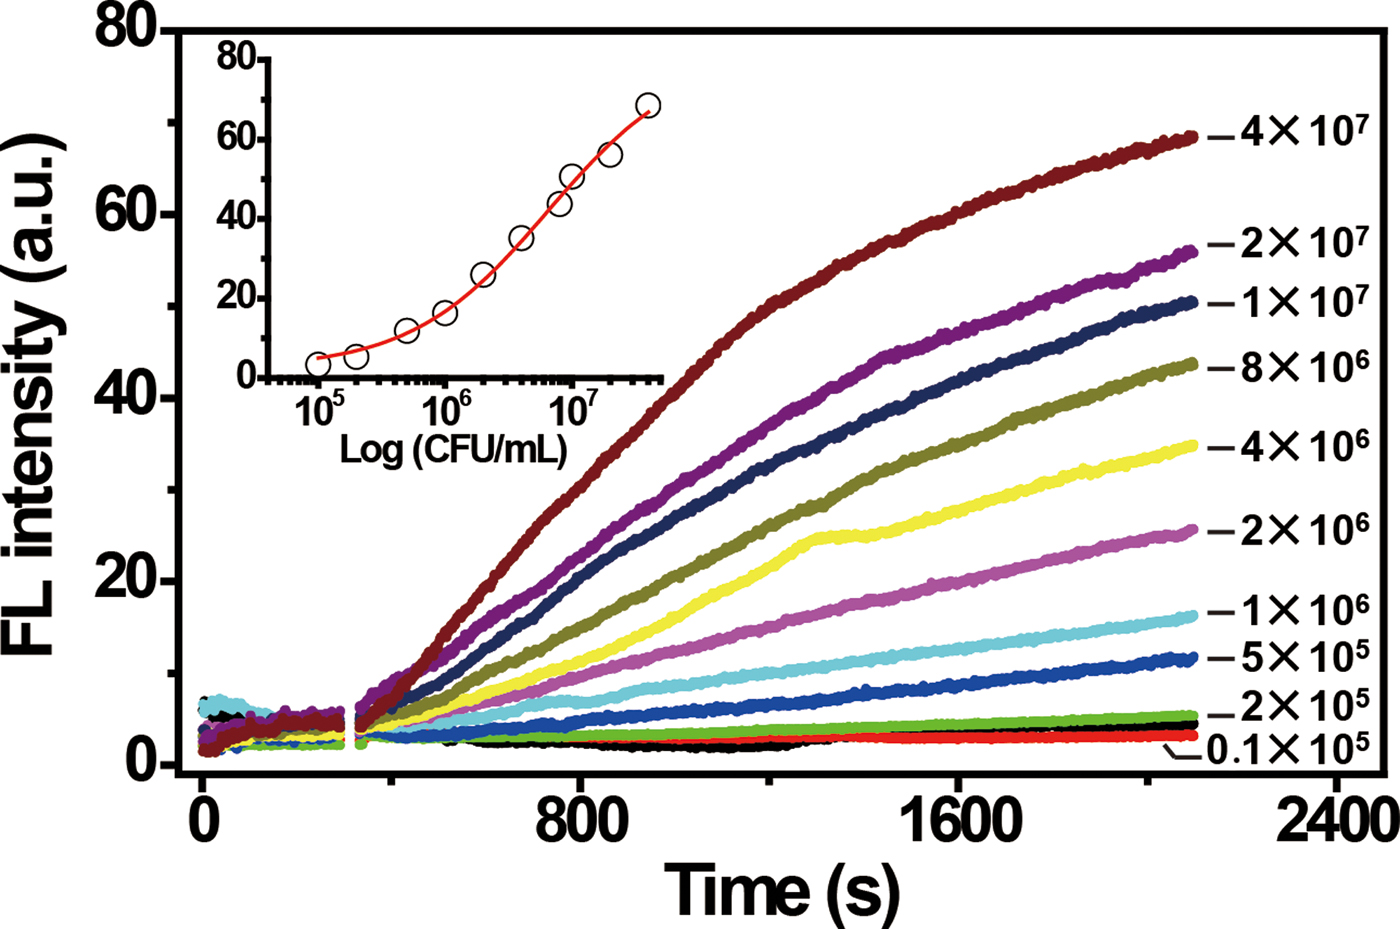
Figure 3. Fluorescence response of RFD-EC/graphene sensor to target-containing samples prepared from varying concentrations of E. coli. The inset represents the fluorescence readings at 30 min versus cell concentration. [RFD-EC] = 280 nM; [graphene] = 30 µg/mL. λex/λem = 494/518 nm.
Our previous work has demonstrated that the cleavage activity of RFD-EC was caused by an unknown protein target that exists extracellularly.[Reference Ali, Aguirre, Lazim and Li34] In the experiments above, we used the CEM – the supernatant collected from cell culture after the cells were removed by centrifugation – as the target-containing sample. We have also shown previously that this target also exists inside E. coli cells at higher concentrations than is present in CEM.[Reference Aguirre, Ali, Salena and Li51] Therefore, we also tested target-containing samples prepared from lysed cells, to determine if the detection sensitivity could be significantly improved. This type of sample was named “crude intracellular mixture (CIM)”. As shown in Fig. S7, the use of CIM resulted in a detection limit of 104 CFU/mL, a tenfold improvement over the use of the CEM sample. Note that the detection limit achieved with the RFD-EC/graphene sensor was comparable to, or even better than, that of some reported optical and magnetic transduction methods.[Reference Massad-Ivanir, Shtenberg, Tzur, Krepker and Segal12, Reference Hahn, Tabb and Krauss13, Reference Ravindranath, Mauer, Deb-Roy and Irudayaraj23, Reference Jarvis and Goodacre5Reference Su, Ma, Shang, Liu, Yin and Ai2–Reference Jarvis and Goodacre5Reference Ivnitski, Abdel-Hamid, Atanasov and Wilkins4] Considering the DNAzyme-based cleavage reaction liberates a single-stranded DNA output, it is also possible to combine cleavage with DNA amplification techniques, such as the isothermal “rolling circle amplification” method to further improve the detection sensitivity,[Reference Jarvis and Goodacre5Reference Jarvis and Goodacre5–Reference Liu, Yin, McConnell, Chang, Brennan and Li60] which could lead to a detection sensitivity comparable with those obtained with electrochemical biosensors.[Reference Zelada-Guillén, Riu, Düzgün and Rius25, Reference Mannoor, Tao, Clayton, Sengupta, Kaplan, Naik, Verma, Omenetto and McAlpine26, Reference Oh, Lee, Chun, Bae, Lee and Choi61–Reference Oh, Lee, Chun, Bae, Lee and Choi6Reference Belgrader, Benett, Hadley, Richards, Stratton, Mariella and Milanovich3]
We also examined the possibility of applying the sensor to detect E. coli in complex biologic samples. For this purpose, we tested the capability of the sensor to detect E. coli spiked into human blood samples (Fig. S8) that were subsequently processed to produce CIM products. We found that the sensor was still able to detect E. coli in this complex matrix with a detection sensitivity of 105 CFU/mL.
We then tested the incorporation of a cell-culturing step as a way to detect lower amounts of E. coli cells, given the fact that live E. coli cells would grow and thus produce more targets for DNAzyme activation. One single colony of E. coli grown on a LB agar plate was placed in 6 mL of Lysogeny broth (LB) and grown for up to 24 h. At a specific time point, an aliquot of the bacterial solution was taken to prepare CIM as the target-containing solution, which was then combined with the graphene-DNAzyme complex for FL detection. As shown in Fig. S9, a detectable signal was obtained following 4 h of culturing, and the FL increase became more pronounced when the culturing time was extended from 4 to 16 h. However, culturing times longer than 16 h did not yield an additional signal increase, suggesting that E. coli cells reached a steady target concentration during the stationary phase of the growth. Taken together, these results implied that, when combined with a cell-culturing step, the sensor was able to detect very low amounts of E. coli in a single colony.
Single cell detection
Ultrasensitive detection, especially single cell detection, is often required in order to identify a deadly pathogenic bacterium at the earliest stage. As we have demonstrated above, when a cell culturing step is included, the DNAzyme/graphene sensing system is capable of detecting a small amount of E. coli represented by a single colony. We were thus interested in examining whether the sensing system was capable of detecting a single E. coli cell when a cell-culturing step was included. To examine this possibility, we prepared an E. coli stock at 6 cells/100 µL, and then allowed these cells to grow over time. At a specific time point, an aliquot of culturing solution was taken to prepare CIM as the target-containing solution, which was then combined with the graphene-DNAzyme complex for FL detection. As shown in Fig. 4, a fluorescence increase was not detected for E. coli samples that were cultured for 2–8 h. However, a significant fluorescence increase was produced when the culturing time was increased to 10 h or longer. This experiment indicates that when combined with a culturing step, the DNAzyme/graphene sensor is indeed capable of achieving single-cell detection. However, a culturing time of 10 h was required in order to generate enough E. coli cells (and thus enough targets) to produce a reliable response in the DNAzyme/graphene sensor. It should be noted that incorporation of a culturing step is a common practice for single-cell detection.[Reference Hossain, Ozimok, Sicard, Aguirre, Ali, Li and Brennan64] Even so, this detection time compares favourably to that needed for conventional methods such as the plate counting method (2–3 days) or traditional PCR (couple hours).[Reference Lazcka, Del Campo and Munoz65, Reference Postollec, Falentin, Pavan, Combrisson and Sohier66]
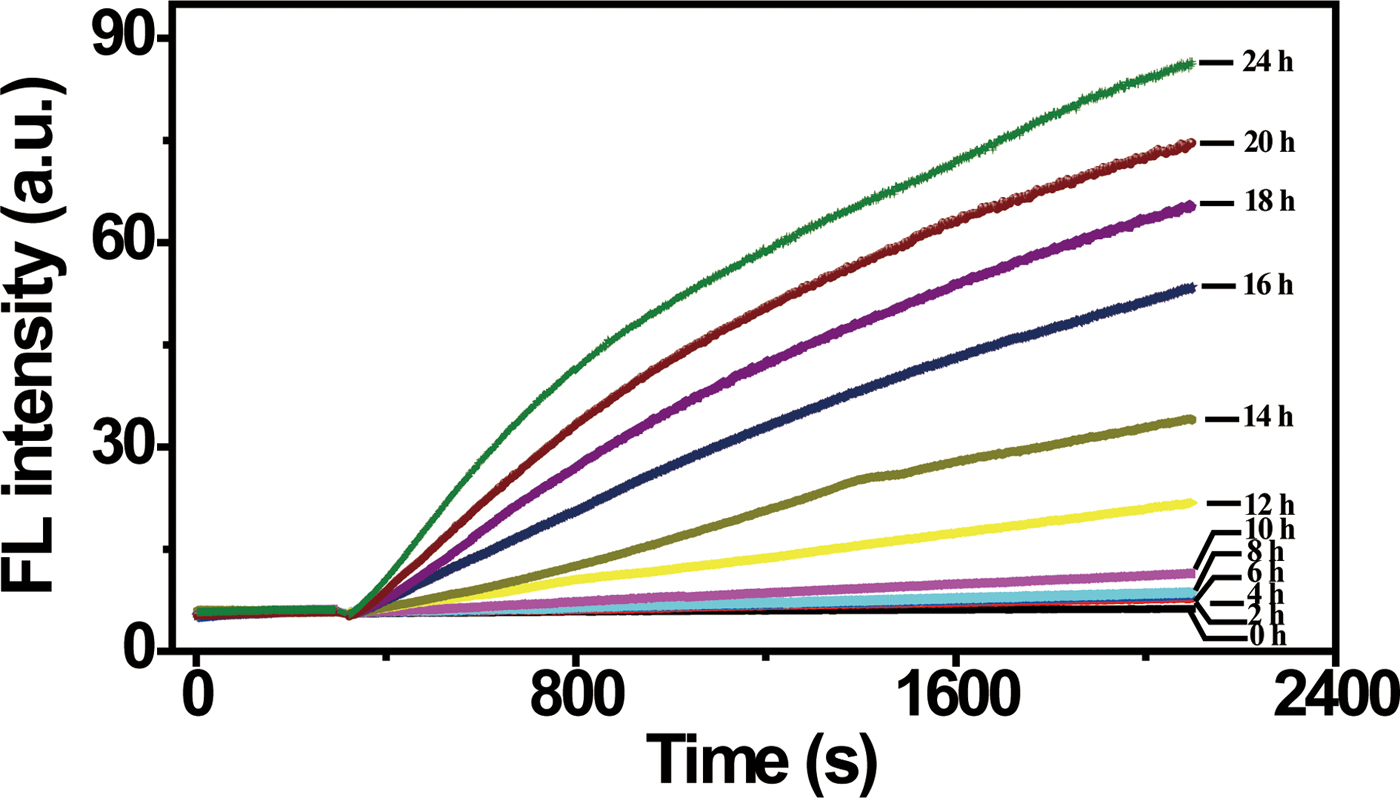
Figure 4. Single cell detection. Fluorescence response to target-containing samples prepared from cells obtained after culturing a single cell for increasing times. [RFD-EC] = 280 nM; [graphene] = 30 µg/mL. λex/λem = 494/518 nm.
Discussion and outlook
We have described a bacterial detection system made of a bacteria-responsive RNA-cleaving DNAzyme that is non-covalently adsorbed onto the surface of graphene. This system possesses several meritorious properties, including high sensitivity linked to the enzymatic activity of the RNA-cleaving DNAzyme as well as the excellent DNA binding and fluorescence-quenching of graphene, the superb selectivity rendered by the artificially engineered DNAzyme, and the ability to achieve single cell detection via the incorporation of a relatively short bacterial pre-enrichment step. This work demonstrates new opportunities for sensitively detecting pathogenic bacteria that could have applications in areas including food safety, diagnosis of infectious diseases and environmental monitoring. Furthermore, the strategy of direct interfacing of graphene with an RNA-cleaving DNAzyme represents a general method for the design of simple, “mix-and-read” type assays for any given bacterium of interest, so long as a bacterium-specific RNA-cleaving DNAzyme can be engineered. Future work will be directed toward devising strategies that can further improve the detection sensitivity through the use of signal amplification technologies as well as simplifying the assay procedure through engineering of even simpler sensor systems, such as paper devices printed with the DNAzyme/graphene sensing material.
Supplementary material
The supplementary material for this article can be found at https://doi.org/10.1557/mrc.2018.97
Acknowledgments
Funding for this work was provided by Natural Sciences and Engineering Council of Canada Discovery Grants (J.D.B. and Y.L.), the Canada Foundation for Innovation and the Ontario Ministry for Research and Innovation. Part of the work was conducted at the McMaster Biointerfaces Institute. J.D.B. holds the Canada Research Chair in Bioanalytical Chemistry and Biointerfaces.


