


Introduction
Fiber-reinforced polymers (FRPs) are among the most widely produced categories of composite materials.Reference Chung1 Initially developed decades ago for the aerospace industry, these composites have spread to a wide range of applications, including automobiles, shipbuilding, circuit boards, construction materials, and household equipment (Figure 1). Because of their high stiffness, strength, and fatigue resistance, as well as their low density and ease of shaping, FRPs provide attractive alternatives to steel and nonferrous metals in structural applications.Reference Netravali and Chabba3 Recently, researchers have also explored bio-based FRPs, in which either the polymer matrix or the reinforcement fibers, or both, come from renewable resources.Reference Vilaplana, Strömberg and Karlsson4
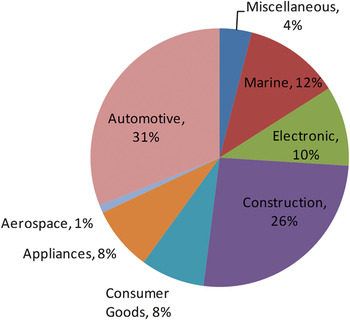
Figure 1. Market share distribution of fiber-reinforced polymers (FRPs) by application.Reference Anandjiwala and Blouw2
This article discusses the environmental impacts of transitioning from conventional materials to FRPs, as determined by life-cycle assessment (LCA). The net change depends on many processes throughout the life cycle of an envisaged application, including energy and mass flows as well as emissions and waste (Figure 2). Because FRP components are often lighter than their traditional counterparts, it is important to compare their impacts on a functionally equivalent basis.

Figure 2. Generic life-cycle phases of a composite component. Each phase might require resource inputs and might create other impacts.
Traditional and bio-based fiber-reinforced polymers
Fiber materials
The best-established FRPs are glass-fiber-reinforced polymers (GFRPs), which are used in a variety of products, including printed circuit boards, tanks and pipes, car body panels, and wind turbine blades. The high melting temperature of glass (glass-fiber production occurs at ∼1550°C) makes energy intensity the major environmental issue.Reference Kellenberger, Althaus, Jungbluth, Kunniger, Lehmann and Thalmann5
Carbon-fiber-reinforced polymers (CFRPs) use carbon fibers that require considerable energy to produce, because they are made by pyrolysis at 1000–1400°C for high-modulus fibers or at 1800–2000°C for high-strength fibers.Reference Subic, Mouritz and Troynikov6 The energy expenditure has decreased, however, as production methods have evolved.Reference Takahashi, Zushi, Suzuki, Nagai, Kageyama and Yoshinari7–9
One promising class of carbon fibers, carbon nanofibers, requires more energy to produce, depending on the feedstock and other details, and generally gives low yields of 15–50%.Reference Khanna, Bakshi and Lee10 A major concern for nanofibers is their potential human toxicity and ecotoxicity. Although they are probably less harmful in a matrix, free particles in the nanometer size range raise health and environmental concerns because of their large surface-area-to-mass ratios and their ability to penetrate biological cells.Reference Dowling, Clift, Grobert, Hutton, Oliver, O’Neill, Pethica, Pidgeon, Porritt and Ryan11 Carbon nanofibers could hence exhibit toxic properties similar to those of asbestos, but because of a lack of data, this effect has not yet been taken into account in LCA studies.
Natural-fiber-reinforced polymers (NFRPs), which incorporate animal-, mineral-, and plant-based fibers, can be used as reinforcements in composites. Little information is available on animal- and mineral-based fibers, but properties of plant-based fibers and composites reinforced with such fibers are well-documented.Reference John and Thomas12–Reference Wambua, Ivens and Verpoest14 In general, the tensile strength and Young’s modulus of widely used plant-based fibers (e.g., hemp, flax fibers) are lower than those of commonly used glass fibers. However, because their density (∼1.4 g/cm3) is less than that of glass fibers (∼2.5 g/cm3), plant-based fibers have a higher specific strength and modulus, making them attractive when weight reduction is critical.14
Matrix materials
Matrix materials for FRPs conventionally include thermosets, such as epoxy, unsaturated polyester, and phenolic resins, but thermoplastic matrix materials are also used for processing and recyclability reasons. Energy consumption occurs during the many synthesis steps, involving first extraction of mineral oil, then separation and refining, and finally characterization and polymerization.
Common bio-based matrix materials include modified starch,Reference Liu, Xie, Yu, Chen and Li15, Reference Avérous and Halley16 bio-based polyester [e.g., poly(lactic acid) (PLA)Reference Mohanty, Misra and Drzal17, Reference Van de Velde and Kiekens18], microbial synthesis polymers [e.g., polyhydroxyalkanoates (PHAs)Reference Mohanty, Misra and Drzal17, Reference Van de Velde and Kiekens18], and polymers synthesized from functionalized vegetable oil [e.g., epoxidized linseed oil (ELO)Reference Ronda, Lligadas, Galià and Cádiz19–Reference Czub26].
Comparing materials using life-cycle assessment
LCA evaluates potential environmental costs or benefits for a particular application, quantifying the many tradeoffs between different life phases. This article explores three impact measures. First, cumulative energy demand (CED) can be an effective screening indicator for overall environmental impact, because energy consumption, especially fossil-fuel consumption, is a major driver for several environmental impact categories.Reference Huijbregts, Rombouts, Hellweg, Frischknecht, Hendriks, van de Meent, Ragas, Reijnders and Struijs27 Second, greenhouse-gas (GHG) emissions and the climate change to which they contribute are among the most significant environmental issues.28 The units for measuring greenhouse gas emissions are CO2 equivalents (CO2e), which account for the different global-warming potentials of different gases. The third assessment measure, used when sufficient data are available, consists of aggregate environmental impact scores, expressed in ecopoints. Unless stated otherwise, the ecopoint values discussed in this article were calculated using the impact-assessment method ReCiPeReference Goedkoop, Heijungs, Huijbregts, De Schryver, Struijs and van Zelm29 and are given in milli-ecopoints (mPt).
A per-kilogram basis provides a clear picture of the environmental intensity of raw materials production, but would inappropriately penalize the lighter polymer composites in components where stiffness, strength, or both determine the amount of material used. Instead, other indicators (see online supplementary materials) have been proposed that yield minimum weight or minimum environmental impact under constraints such as equal stiffness,Reference Song, Youn and Gutowski30–Reference Suzuki, Odai, Hukui and Takahashi33 equal strength,Reference Suzuki, Odai, Hukui and Takahashi33, Reference Puri, Compston and Pantano34 equal weight and geometry,Reference Diener and Siehler35, Reference De Vegt and Haije36 or metrics based on measurements on specific components.Reference Luz, Caldeira-Pires and Ferrão37–Reference Wötzel, Wirth and Flake39
Materials impacts at different life-cycle phases
Production phase
Table I lists CED values, GHG emissions, and ecopoints associated with production of several matrix and fiber materials, as well as manufacturing methods for composites. In some cases, different production methods show widely varying environmental impacts. For example, making the PHA matrix material poly(β-hydroxybutyrate) (PHB) by fermentation releases energy, with a negative CED of –22.7 MJ/kg and GHG emissions of –3.1 (kg of CO2e)/kg, whereas PHB obtained from corn starch has a large positive CED (38.6 MJ/kg) but essentially zero GHG emissions.Reference Pietrini, Roes, Patel and Chiellini40
Table I. Cumulative energy demand (CED), greenhouse-gas (GHG) emissions, and ecopoints for various materials and production processes.

NA, not available.
Table II provides an overview of LCA studies on production-phase environmental impacts of different products made of composites, compared to their counterparts based on traditional materials. The values of CED and GHG emissions for matrixes and reinforcements in Table II do not fully agree with those in Table I because they were derived from different sources. Nevertheless, the trends are the same. Both GFRPs and CFRPs have been proposed as replacements for steel and aluminum in structural components. However, whereas GFRPs show consistently lower production-phase CED values and GHG emissions than either steel or aluminum, CFRPs generally score significantly worse than the metals.
Table II. Summary of life-cycle assessment (LCA) studies for fiber-reinforced polymers (FRPs) in the production phase.

NA, not available.
Acronyms: ABS, poly(acrylonitrile butadiene styrene); CF, carbon fiber; CFRP, carbon-fiber-reinforced polymer; CNF, carbon nanofiber; EP, epoxy; GF, glass fiber; PES, polyester; PET, poly(ethylene terephthalate); PP, polypropylene.
a Energy for maintenance not included because of high estimated uncertainty. S235J0 or S355J0 for structural steel, X2CrNi18-11 or X2CrNiM018-14-3 for stainless steel, AlMgSi1,0F31 for aluminum, B35 for concrete.
b 50% content of recycled polypropylene
c Closure panels of a midsize passenger car consisting of four doors, hood, and deck lid; 11% content of recycled aluminum.
d STAM735H for steel, modified 6061-T8 for aluminum.
e CFRP contains polyacrylonitrile- and lignin-based carbon fibers obtained by sheet molding or powdering manufacturing methods.
Use phase
In the use phase, the impact of composite products is typically indirect. For example, FRPs are more durable than many traditional materials, such as steel and concrete, because they resist corrosion and fatigue better.Reference Chung1 According to a study performed by the Rotterdam city government, bridges made from CFRPs or GFRPs need no additional resources for maintenance. In contrast, for concrete or steel bridges, 5% of the initial materials for construction generally have to be replaced after 50 years.57 However, no quantitative data on the environmental impact of the maintenance of FPR components could be found in the literature.
In dynamic systems, such as vehicles, FRPs are used to achieve lightweight structures, thus reducing fuel consumption and related environmental impacts. Consequently, transportation systems are their major application, with automotive, aerospace, and marine uses representing 44% of total FRP consumption (see Figure 1). GFRPs are already used for decorative, nonstructural, and semistructural parts in cars,Reference Codd58, Reference Das59 railway vehicles,Reference Batchelor60 ships,Reference Noury, Hayman, McGeorge and Weitzenböck61 and aircraft.Reference Gay62
Substituting natural fibers for glass fibers in automotive applications has also drawn significant interest.Reference Dahlke, Larbig, Scherzer and Poltrock63–Reference Mangino, Carruthers and Pitarresi70 Compared to similar combinations based on glass fibers, NFRPs have lower costs, weights, and environmental impacts for functionally equivalent solutions including door panels, car interiors, package trays, and rear shelves.Reference Svennerstedt71 Shifting from glass to natural fibers has been reported to save 22–27% in weight.Reference Joshi, Drzal, Mohanty and Arora72
For structural parts in vehicles, which are currently made from steel or aluminum, CFRPs (e.g., carbon-fiber-reinforced epoxy or polypropylene) have been proposed as substitutes, because CFRPs can satisfy severe structural requirements while providing significant weight reductions.Reference Codd58 Examples include the early “body-in-white” (BIW) stage of automobile manufacturing (consisting of the unpainted sheet metal frame of the vehicle),Reference Stodolsky, Vyas and Cuenca73–Reference Lovins and Cramer76 railway carriage structures,Reference Castellan, Blanc, Ferrier, Caber, Wakeman, Manson, Emery, Han, Hong and Jolliet77 vertical stabilizers and fin boxes in aircraft,Reference Souris78 and ship hulls.Reference Olofsson, Arnestad, Lönnö, Hedlund-Åström, Jansson and Hjortberg79, Reference Stenius, Rosén and Kuttenkeuler80 Weight reductions of 50–70% can be anticipated if CFRPs are used in place of conventional, metal-based components.
In addition to such primary weight savings, secondary weight savings, known as mass decompounding, are also expected. For example, a lightweight body requires a lighter chassis, lighter brakes, a less powerful power train, and so on. Secondary savings of an additional 0.5–1.5 kg per kilogram of primary savings have been reported.Reference Das8, Reference Codd58, Reference Malen and Reddy81, Reference Moore82
Fuel consumption of a vehicle is determined by many factors (e.g., weight, shape, and route characteristics) and is therefore hard to estimate absolutely. However, other factors being equal, fuel consumption is proportional to vehicle mass for cars,Reference Bertram, Buxmann and Furrer83 trains,Reference Castellan, Blanc, Ferrier, Caber, Wakeman, Manson, Emery, Han, Hong and Jolliet77 and aircraft.Reference Scelsi, Bonner, Hodzic, Souris, Wilson, Scaife and Ridgway84 For ships, the energy consumption is proportional to weight to the power of 2/3 within a specific velocity range.Reference Helms and Lambrecht85 The energy savings induced by a certain amount of weight reduction by FRPs for a specific type of vehicle are more robust and widely adopted in LCA studies
Table III lists changes in CED values and GHG emissions during the use phase of a vehicle that can be obtained by using composites in place of traditional materials. CFRPs generally show dramatic energy savings compared to steel, aluminum, and even GFRPs, by virtue of the significant weight savings they make possible. NFRPs, such as bagasse/polypropylene (PP) and china reed/PP, contribute to further weight reductions and energy savings compared to GFRPs. A crucial assumption is that the useful life of NFRPs will be the same as or comparable to that of traditional composites, but in fact little is known about the long-term durability of these materials, which is mostly determined by the moisture level in the composite.Reference Svennerstedt71 A systematic, quantitative analysis of the useful life of bio-based composites has not yet been performed.
Table III. Changes in cumulative energy demand (CED) and greenhouse-gas (GHG) emissions during the use phase for different material combinations.

NA, not available.
Acronyms: CF, carbon fiber; EP, epoxy; GF, glass fiber; PES, polyester; PET, poly(ethylene terephthalate); PP, polypropylene.
a Closure panels of a midsized passenger car consisting of four doors, hood, and deck lid.
End-of-life phase
Different end-of-life (EOL) scenarios lead to different impacts. Table IV provides an overview of CED values and GHG emissions for different EOL options. Recycling methods in Table IV include mechanical recycling for sheet-molding-compound composites and glass-mat-reinforced thermoplastics (GMTs), thermal treatment for CFRPs to recover carbon fibers, and remelting and recasting of steel and aluminum. Because the secondary use of the recycled materials is not clear, the environmental credits from recycling are not included in this table.
Table IV. Environmental impacts of different types of composites under different end-of-life scenarios.

NA, not available.
Acronyms: SMC, sheet-molding-compound composites (e.g., glass-fiber-reinforced polyester resins); GMT, glass-mat-reinforced thermoplastics (e.g., glass-fiber-mat-reinforced polypropylene).
Landfills once were the common disposal approach for composite components. However, landfilling requires large areas of land and does not allow for the recovery of the embodied energy of composites. Furthermore, waste typically must still undergo pretreatment to reduce its volume and hazardous effects before being landfilled.91
In most cases, FRPs are incinerated, for instance, in cement kilns, to recover embodied energy. A model for calculating the energy recovery from incineration of CFRPs was derived assuming complete conversion of carbon fibers and the polymer matrix into CO2, H2O, and N2O by means of the modified Dulong formula:Reference Tchobanoglous, Theisen and Vigil92
(1)
where TE, the total energy, is expressed in kilojoules per kilogram and C, H, O, S, and N are the weight fractions, in percentages, of the corresponding elements. Glass-fiber-reinforced composites can also be incinerated, but the incombustible glass fibers hinder the incineration, consuming ∼1.7 MJ per kilogram of glass-fiber content.Reference Shen and Patel53
Through incineration, for example, burning composite scrap in cement kilns, one can not only recover the embodied energy, but incorporate the incombustible parts, such as glass fibers or mineral fillers, into cement production.Reference Pickering93 Incineration is also a logical way to dispose of NFRPs. Unlike glass fibers, natural fibers are combustible and therefore contribute to a higher heating value of components for incineration.
The four main recycling methods for FRPsReference Pimenta and Pinho94 are mechanical recycling, pyrolysis, fluidized-bed processing, and chemical treatment. Mechanical recycling is used for both GFRPsReference Pickering93 and CFRPsReference Takahashi, Matsutsuka, Okazumi, Uzawa, Ohsawa, Yamaguchi and Kitano95 but is mainly applied to GFRPs. It does not recover individual fibers. Instead, mechanical recycling is performed at the composite levelReference Pimenta and Pinho94 and involves shredding, crushing, or milling FRPs and then separating the crushed pieces into fiber-rich and resin-rich fractions. These fractions are incorporated into new composites as fillers or reinforcements or used directly in the construction industry.Reference Pickering93
The mechanical properties of FRPs containing recyclates can be severely affected. Depending on the content of recyclates (5–70% by weight), flexural-strength reductions of 10–54% have been recorded.Reference Derosa, Telfeyan and Mayes96–Reference Palmer98 As a result of these degraded mechanical properties, FRP recyclates are usually used in low-end applications such as construction fillers, which is best considered downcycling.
Other recycling methods, such as pyrolysis,Reference Pickering93, Reference Meyer, Schulte and Grove-Nielsen99, Reference Gañan, González, González-García, Cuerda-Correa and Macías-García100 the fluidized-bed process,Reference Pickering93, Reference Pimenta and Pinho94 and chemical processing,Reference Pimenta and Pinho94, Reference Dang, Kubouchi, Sembokuya and Tsuda101 aim to reclaim individual fibers in CFRPs or GFRPs. The mechanical properties of carbon fibers can be retained at relatively high levels after pyrolysisReference Meyer, Schulte and Grove-Nielsen99, Reference Lee, Kim, Pruitichaiwiboon, Kim, Lee and Ju102–Reference Heil, Hall, Litzenberger, Clearfield, Cuomo, George and Carberry104 and chemical recycling.Reference Lee, Kim, Pruitichaiwiboon, Kim, Lee and Ju102 Glass fibers recycled by pyrolysis suffer a significant reduction in tensile strength as the pyrolysis temperature increases from 650°C to 800°C.Reference Cunliffe, Jones and Williams105 In the fluidized-bed process, glass fibers suffer a 50–90% reduction in strength, depending on processing temperature.Reference Pickering93 The tensile strength of recycled carbon fibers also decreases sharply (by 20–34%), whereas the elastic modulus remains stable.Reference Jiang, Pickering, Walker, Wong and Rudd106, Reference Wong, Pickering, Turner and Warrior107
From an environmental perspective, pyrolysis generally consumes 2.8 MJ of energy per kilogram, while providing liquefied petroleum gas (∼2 MJ/kg), heating fuel oil (9.2 MJ/kg), and composite fillers (∼10.6 MJ/kg). Thus, compared to EOL scenarios without recycling, a net energy retrieval of approximately 19 MJ/kg can be achieved.Reference Song, Youn and Gutowski30
NFRP composites are recycled through multiple mechanical and thermal reprocessing proceduresReference Srebrenkoska, Gaceva, Avella, Errico and Gentile108–Reference Bourmaud and Baley110 and generally retain their mechanical properties. For example, after seven cycles, the tensile modulus and tensile strength for a sisal fiber/PP NFRP were found to drop by only 10.1% and 17.2%, respectively, in contrast to 40.1% and 52.5% losses in a glass fiber/PP GFRP.Reference Bourmaud and Baley110 However, the process temperatures cannot exceed 200°C during NFRP recycling without degradation of the structural properties.Reference Marsh111, Reference La Mantia and Morreale112 This might make recycling of NFRPs impractical for matrixes that require high temperatures, for instance, to achieve remelting.
A seemingly attractive way to dispose of bio-based composite waste is biodegradation (anaerobic digestion or composting). Biodegradation mechanisms for typical bio-based composites, including natural-fiber-reinforced starch-based composites,Reference Singh, Pandey, Rutot, Degée and Dubois113, Reference di Franco, Cyras, Busalmen, Ruseckaite and Vázquez114 natural-fiber-reinforced PLA,Reference Plackett, Løgstrup Andersen, Batsberg Pedersen and Nielsen115, Reference Kumar, Yakubu and Anandjiwala116 PHA-based bio-based composites,Reference Barkoula, Garkhail and Peijs117, Reference Saad and Seliger118 and blends of these polymers,Reference Ohkita and Lee119, Reference Yu, Dean and Li120 have been comprehensively investigated.
An important concern for biodegradation is whether the process itself or its products exhibit ecotoxicity, which can be measured with microorganisms, soil fauna, and terrestrial plants.Reference Kapanen and Itävaara121 Initial studies support ecological safety of biodegradation for starch blends,Reference Jayasekara, Sheridan, Lourbakos, Beh, Christie, Jenkins, Halley, McGlashan and Lonergan122 cellulose-fiber-reinforced starch composite,Reference Rudnik, Milanov, Matuschek and Kettrup123 and lactic-acid-based polymers that do not contain the connecting agent 1,4-butane diisocyanate.Reference Tuominen, Kylmä, Kapanen, Venelampi, Itävaara and Seppälä124 Although quantitative LCA studies of biodegradation are rare, one such study reported that composting and incineration are comparable in terms of GHG emissions, but incineration provides significantly higher nonrenewable energy recovery.Reference Hermann, Debeer, De Wilde, Blok and Patel125
Life-cycle tradeoffs
The preceding sections highlighted potential environmental impacts and benefits related to a switch to composites. However, increases in environmental impacts during one life-cycle phase can be compensated by reductions during another phase. This section illustrates such tradeoffs using three examples.
GFRP versus steel and aluminum in transportation vehicles
Two studiesReference Song, Youn and Gutowski30, Reference Puri, Compston and Pantano34 reported that GFRPs are environmentally beneficial compared to steel for interior panels and doors in automobiles (20% and 59% CED reductions for GF/PES and GF/PP, respectively) in both the production and use phases because of their lower weights. The environmental problem lies in the EOL phase. Mechanical recycling of GFRPs severely damages their intrinsic properties, and the incineration potential of GFRPs is also limited because of their relatively low heating value and high ash content.Reference Song, Youn and Gutowski30
In contrast, making components from aluminum instead of GFRPs results in slightly lighter structures. Even though virgin aluminum consumes more energy during production, it is easily recycled, so that designers can substantially reduce energy demand by using recycled aluminum. In general,Reference Puri, Compston and Pantano34 therefore, aluminum is better for these uses than GFRPs, from a full life-cycle perspective.
CFRP versus steel and aluminum in transportation vehicles
A graphical comparison of the environmental impacts of using CFRPs and steel in automobiles is presented in Figure 3 as an example. Quantitative information on various contributions to the production-phase impact of shifting from steel to CFRPs can be found in Table II. In the EOL stage, incineration of CFRPs will provide energy credits, but the overall EOL ecological impact is still negative (positive ecopoint values) because of CO2, NOx, and SO2 emissions.Reference Duflou, De Moor, Verpoest and Dewulf88 In contrast, steel can be almost 100% recycled, with relatively low energy consumption and without degrading its materials properties, resulting in a comparatively beneficial EOL environmental impact. However, beyond a certain breakeven point in mileage, the environmental benefits of weight reduction in the use stage will overcome the negative impacts of CFRPs in the production and EOL stages.Reference Van Acker, Verpoest, De Moor, Duflou and Dewulf126 In one analysis, the breakeven point was found to be 132,000 km for CFRP versus steel for automotive panels, as shown in Figure 3.Reference Van Acker, Verpoest, De Moor, Duflou and Dewulf126

Figure 3. Total life cycle impact of carbon-fiber reinforced polymer (CFRP) body in white (BIW) compared to conventional steel BIW. The lower weight of the CFRP design and the secondary weight reduction it allows contribute to lower fuel consumption in the use phase that eventually overcomes its greater negative impact in production and end of life. Only the difference in fuel consumption is considered in the use phase for the steel based design.
Such a breakeven point can also be determined for CFRPs compared to aluminum. An LCA comparison found that, if both the production and EOL stages are taken into account, an aluminum-based plane panel contributes fewer ecopoints (2 Pt) than a CFRP panel (10 Pt), because aluminum can also be easily recycled.Reference Scelsi, Bonner, Hodzic, Souris, Wilson, Scaife and Ridgway84 Because of the significant weight reduction, the ecopoint breakeven point for CFRP versus aluminum in aircraft applications is only 70,000 km of flight.Reference Scelsi, Bonner, Hodzic, Souris, Wilson, Scaife and Ridgway84
NFRP versus GFRP in transportation vehicles
Table V compares the CED values of NFRPs and GFRPs during the different life-cycle phases. The EOL scenario for all three listed cases involves incineration with energy recovery. Compared to GFRPs, NFRPs typically provide fewer energy credits in the EOL phase because of the lower equivalent product mass generally required for NFRP-based product designs, resulting in less material to be burned. NFRPs, however, provide favorable CED scores during both the production and use phases, which results in significantly reduced CED values for the total life cycle. The main environmental concerns for NFRPs, particularly biobased polymers/natural fibers, are emissions of nitrogen and phosphorus during cultivation,Reference Miller, Landis and Theis127 large arable-land requirements,Reference Piemonte and Gironi128, Reference Deng, Van Acker, Dewulf, Duflou, Hesselbach and Herrmann129 and ecosystem deterioration.Reference Miller, Landis and Theis127, Reference Deng, Van Acker, Dewulf, Duflou, Hesselbach and Herrmann129 Presently, these impacts are too uncertain to be included in LCA studies,Reference Miller, Landis and Theis127 and more data on the production-phase impacts of NFRPs are needed.
Table V. Comparison of cumulative energy demand (CED) values for natural-fiber-reinforced polymers (NFRPs) and glass-fiber-reinforced polymers (GFRPs).

a Component consists of 820 g of hemp/epoxy (EP) versus 1125 g of poly(acrylonitrile butadiene styrene). Distance of use is 200,000 km.
b Component consists of 20 kg of bagasse/polypropylene (PP) versus 25 kg of glass fiber (GF)/PP. Distance of use is 150,000 km. End-of-life (EOL) phase is 50% recycling and 50% incineration with energy recovery.
Conclusions
Comparison of the environmental performance of FRP composites with that of traditional material solutions at a product level requires a thorough analysis of the complete life cycle of the product. The production of matrix and fiber materials generates considerable environmental impacts, especially because of the energy intensity of carbon fiber production. End-of-life processing creates comparatively less impact and therefore does not dominate environmental tradeoff considerations.
Depending on the application, the environmental payback during the product-use phase can be substantial: In aerospace applications, for example, weight reductions and related energy savings clearly dominate the life-cycle assessment. For applications with less energy-intensive use phases, such as automotive structures, the tradeoff between environmental impacts caused during production and expected savings during use are less obvious and should be studied on a case-by-case basis.
According to the studied environmental impact evaluation criteria and the available data, when bio-based composites can provide the required material properties, they are valid alternatives with a reduced overall impact compared to traditional matrix and fiber materials. However, in terms of both further improving material properties and investigating environmental impacts, there is still significant scope for further research.
Supplementary materials
For supplementary materials for this article, please visit http://dx.doi.org/10.1557/mrs.2012.33.


