


Introduction
Fluorescence microscopy facilitates selective imaging of cellular components at high resolution in fixed and living samples. In particular, fluorescence imaging of genetically encoded reporters has become an important tool to investigate living specimens in various fields, such as cell biology, neuroscience, and developmental biology. Yet, fluorescence microscopy suffers from a number of fundamental constraints that, depending on the experimental conditions, require trade-offs in the acquisition of data. Specifically, the spatial resolution in three dimensions is limited by the laws of physics. Perhaps even more limiting in practice, the ability to observe the sample over long periods with high signal-to-noise ratio is restricted by photo-damage induced by the excitation light. This is exemplified best in developmental biology experiments that require relatively large multi-cellular organisms to be observed at regular intervals over a long period of time. Well-established microscopy methods such as widefield/epi-fluorescence or confocal microscopy fare poorly in such experiments, either because of the lack of three-dimensional (3D) resolution (widefield microscopy) or the extensive photo-damage that they inflict (confocal microscopy).
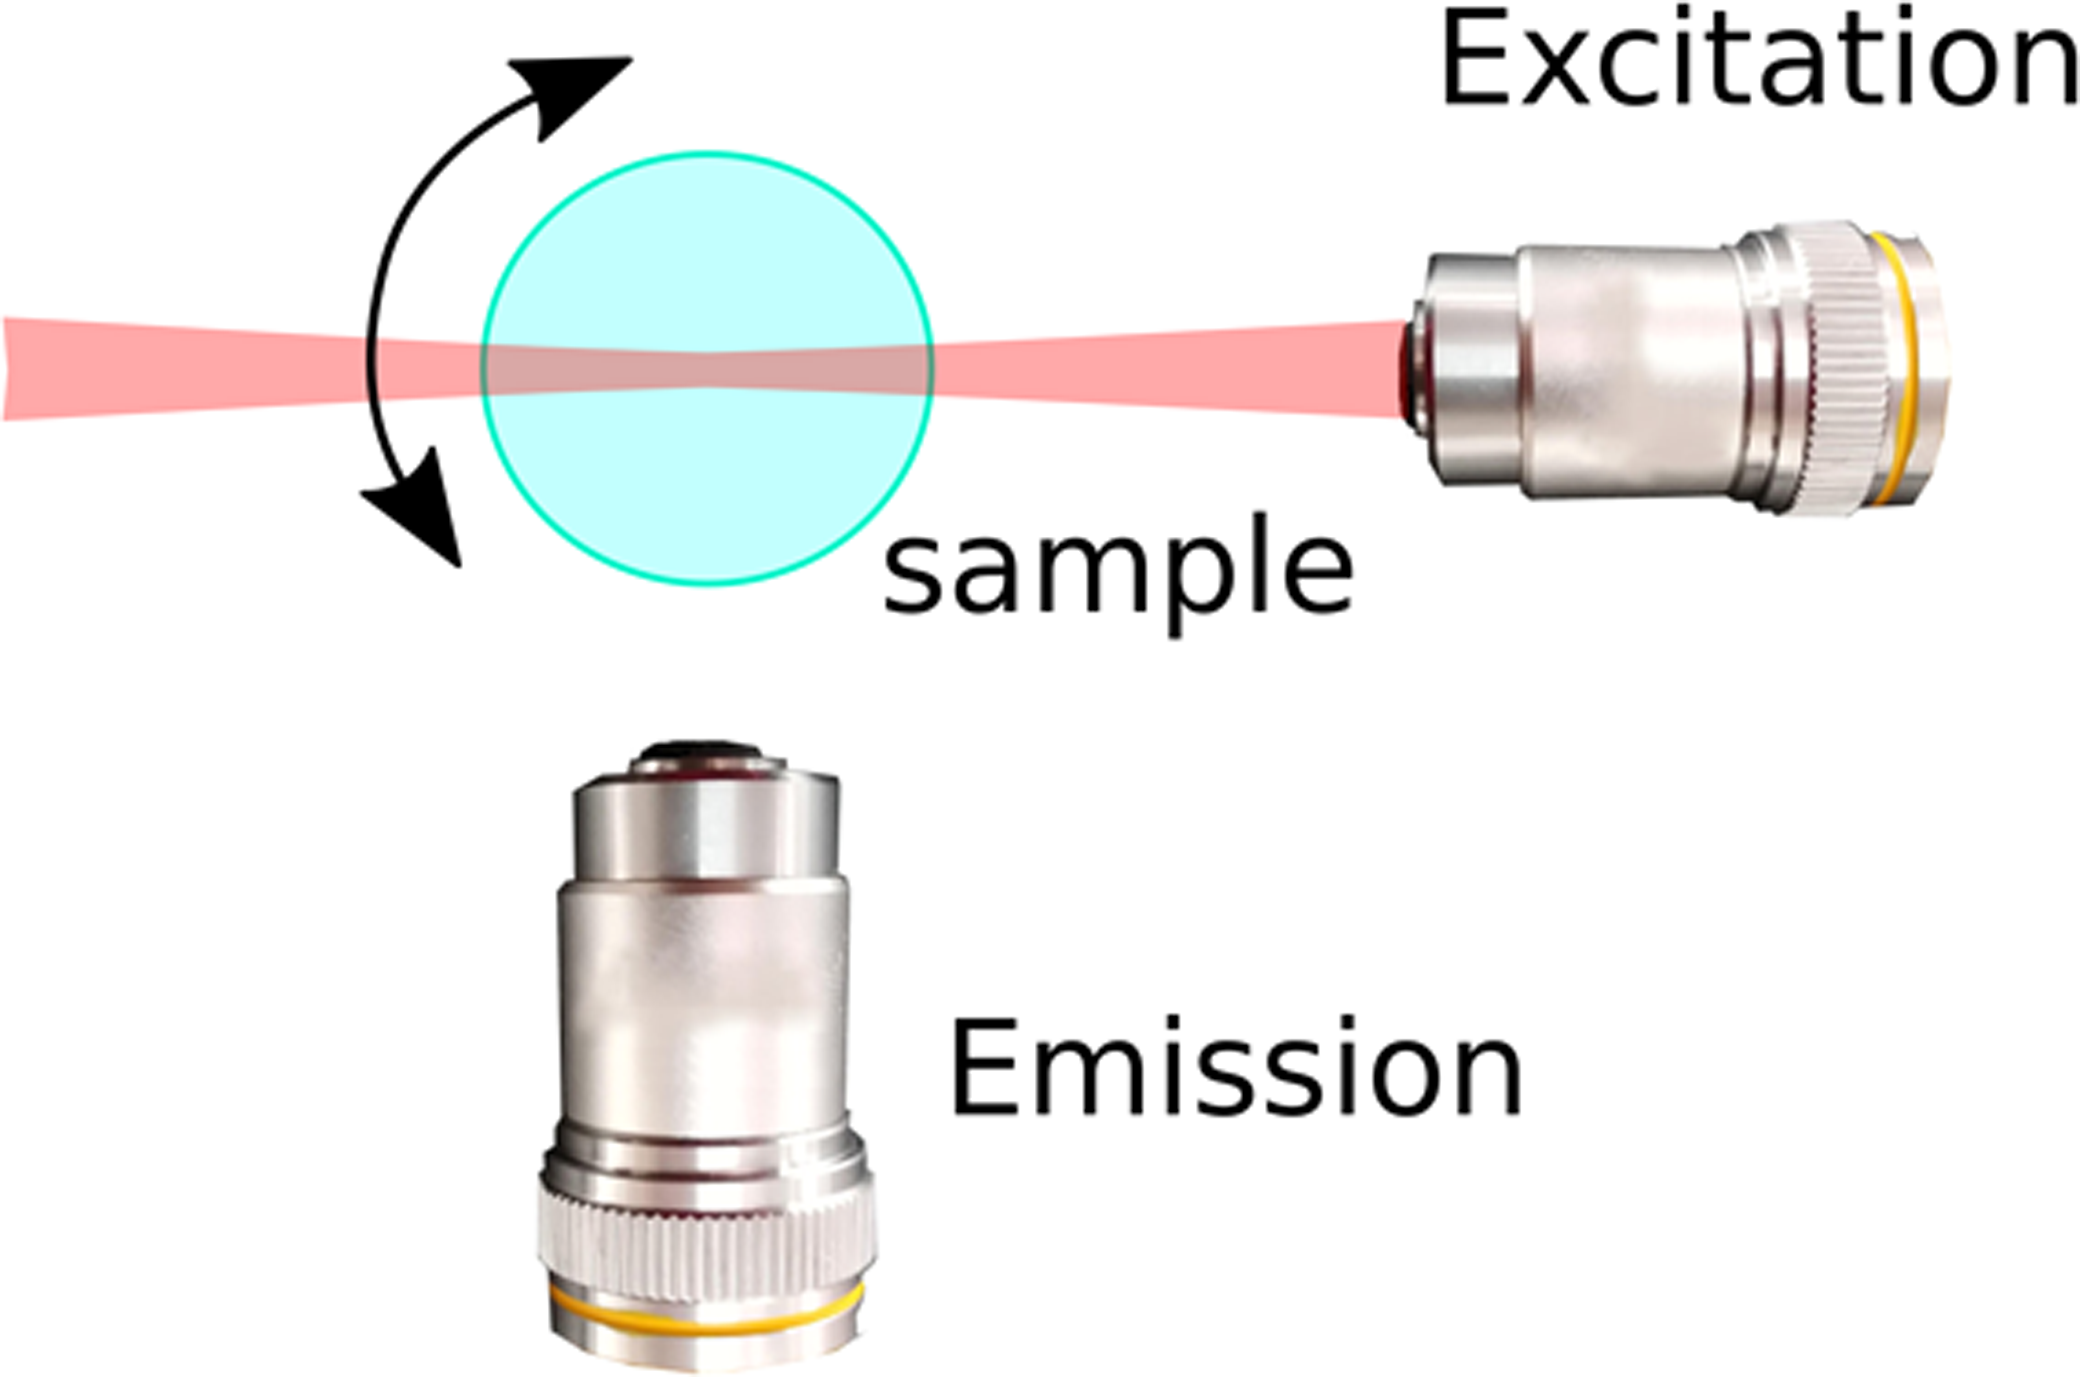
In the last decade, light sheet fluorescence microscopy (LSFM), also referred to as selective plane illumination microscopy (SPIM), has emerged as a technique that provides a near-optimal compromise, providing good spatial resolution in three dimensions while limiting photo-damage, making long-term observation of large specimens feasible [Reference Huisken and Stainier1,Reference Strobl2,Reference Strobl3]. The remarkable performance of LSFM is based on a simple idea: using a thin sheet of light, only the plane of interest in the sample is excited (and hence subjected to photo-damage) and imaged. This is achieved by decoupling the excitation and emission paths of the microscope: the sheet of light is generated by one set of optics, while the image is detected via a separate optical path that is oriented perpendicular to the optical axis of the excitation light (Figure 1A).

Figure 1 LSFM and PSFs. (A) Typical for light sheet fluorescence microscopy is the decoupling of excitation and emission paths. One objective lens generates a thin sheet of light that illuminates the focal plane (excitation), and emitted light is detected via a separate optical path oriented perpendicular to the optical axis of the excitation light. Specific LSFM setups allow rotation of the sample for acquiring views from multiple directions. (B) The PSF changes spatially as a function of the distance from the focus to the excitation objective. Shown are false color coded XZ views of PSFs for a Gaussian light sheet.
This approach to selectively illuminate and image planes in a sample provides for highly efficient 3D imaging at resolutions close to that of a confocal microscope with a much improved signal-to-noise ratio. The success of LSFM quickly led to a flurry of technical developments to address imaging artifacts known to be present in conventional LSFM: photon scattering and sample-dependent photon absorption (leading to stripes and shading) (Figure 2A) [Reference Huisken and Stainier1,Reference Power and Huisken2]. It was quickly realized that the geometry of the setup allowed the sample to be rotated and viewed from different directions (Figure 1A). The different views could then be fused into a single superior image where all parts of the specimen are imaged optimally [Reference Huisken4]. A second development was based on the well-established technique of deconvolution, where knowledge of the optical properties of the imaging system is used to revert the blurring induced by the diffraction-limited optics of the microscope. Deconvolution is critically dependent on the inherent resolution of the data and on the signal-to-noise ratio. Because light-sheet data provide a good compromise in this regard, it is well suited for deconvolution. Thus, deconvolution combined with multi-view reconstruction, allows a significant improvement/restoration of LSFM data [Reference Verveer5].

Figure 2 LSFM artifacts and imaging parameters. (A) Photon scattering and absorption by the sample can be a major issue in LSFM imaging because of the typically large sample sizes that are imaged. The most prominent distortions present in LSFM images are: the blurring process (convolution) where each point in the sample is imaged as a 3D light distribution known as the point spread function (PSF) and Poisson noise, which is dependent on the number of photons recorded. (B) Huygens reads the generic and LSFM-specific image parameters from the acquired data, indicates the reliability of each parameter, and allows editing of them. The parameters are used to automatically calculate a PSF during a deconvolution run.
This article describes these two main restoration methods in some detail, specifically in relation to the Huygens Fusion and Deconvolution Wizard. Finally, two examples are described in which LSFM images are shown to benefit from this deconvolution and multi-view fusion approach.
Materials and Methods
Deconvolution of microscopy images
Image restoration is recognized as an important technique in microscopy because of its ability to compensate for the distortions of the true object that are introduced by the optical imaging process. One of the most important distortion factors is the resolution-limiting effect of diffraction that affects both the excitation and detection beams of the LSFM. Diffraction imposes a hard limit on the range of spatial frequencies that can be transmitted to the image and thereby determines the finest object details that can be resolved. As a consequence, fluorescent light sources within a sample appear as blurred objects in the image. This blurring process, also known as convolution, is a process whereby each point in the sample is imaged as a 3D light distribution known as the point spread function (PSF) (Figure 2A), effectively attenuating the higher spatial frequencies of the object [Reference van der Voort6].
The blurring of the image can to some extent be reversed using inverse filtering techniques, but this will amplify the noise. Noise is another main distortion factor added to the recorded image (Figure 2A), and it generally follows a Poisson distribution as a consequence of recording only a limited number of photons per pixel. Unlike simple inverse filters, iterative restoration methods make use of a maximum likelihood algorithm to account for both blurring and noise [Reference van der Voort6,7]. The basic idea of iterative image restoration (deconvolution) is to determine an estimate of the true object that, after convolution with the PSF, produces a synthetic image that closely matches the measured image. This estimate is computed taking into account the Poisson character of the noise and the optical model of the microscope. The most likely estimate is found in an iterative fashion: starting from a reasonable first estimate, it is adjusted each iteration, improving its likelihood until the gain drops below a preset threshold [Reference van der Voort6].
For effective deconvolution, the PSF must be numerically modeled or experimentally measured. An experimental PSF can be measured directly by imaging a point source such as a sub-resolution bead. In practice somewhat larger, brighter beads are used, and the PSF is determined by a process similar to deconvolution while exploiting the knowledge of the size of the beads, an approach also applied in the Huygens PSF Distiller. Although an experimental PSF potentially yields the “true” PSF of the given microscope setup, the measuring process can be cumbersome, and some distortions are not easily captured. For instance, aberrations that are induced by a mismatch between the refractive indices of the sample and the objective media lead to changes in the PSF as a function of the location of the image focus within the sample (Figure 1B). In such a case, numerical calculation of a spatially varying PSF using an accurate model that includes the aberration process may lead to improved deconvolution results [8].
Deconvolution of LSFM data proceeds, in broad lines, in the same way as other fluorescence imaging techniques such as widefield, confocal, or STED microscopy; however, it requires subtle but important adjustments to the image formation process as reflected in the PSF. The Huygens software allows the use of an experimental PSF, but it is also equipped with sophisticated optical models to calculate the PSF according to the specific type of LSFM used. The image parameters required are usually read from the image metadata and can also be adjusted, if needed (Figure 2B). Two essentially different categories of LSFM are currently in use: either a cylindrical lens used to form a thin light sheet directly, or alternatively a beam of light is scanned through the sample to form a light sheet, illuminating the sample line by line. The Huygens software is able to model both approaches and can numerically calculate various light-sheet shapes: simple Gaussian light sheets generated by low-NA cylindrical lenses, more complicated diffraction patterns generated by a high-NA scanned excitation Bessel beam, and newer developments such as scanning Bessel lattice light sheet microscopy [Reference Chen9]. These models take into account that the light sheet is not uniform as a function of the distance from the illumination objective to the focus point, compensating for the resulting spatial changes in the PSF when deconvolution is applied (Figure 1B). Even modification to the PSF structure from an axial or lateral focus offset can be accounted for by adjusting the corresponding parameters in Huygens (Figure 2B).
Skewing/de-skewing of specific LSFM images
In a few LSFM setups, the excitation and emission axes are oriented at an oblique angle relative to the sample stage (Figure 3). For example, such a setup can be implemented as an add-on module to a standard microscope body. In such systems, the specimen mounted on the stage is scanned horizontally to move the focus through the sample. However, since the scanning does not occur parallel to the optical axis, this leads to a movement in multiple spatial directions. The effect is a shear (skew) in the recorded 3D image stack (Figure 3), thereby complicating deconvolution since the PSF is sheared accordingly. Therefore, the image must first be corrected by shifting all the z-slices back into their correct position (Figure 3). The shift between consecutive z-slices is constant and depends on the step distance of the stage and the objective angle. The Object Stabilizer in Huygens version 18.04 (and later) has been extended with an option to correct for the skewing within a light-sheet image. By entering the step distance and objective angle, the appropriate back-shifts are calculated and applied to each z-slice. After stabilization, the image can be further processed, and deconvolution can be applied as usual.

Figure 3 Skewing and de-skewing of LSFM images. Some LSFM setups have their excitation and emission objectives positioned at an oblique angle relative to the sample stage. The sample mounted on the stage is scanned horizontally to move the focus through the sample (see arrow), which leads to a skew in the recorded 3D image stack and also in the PSF. The Huygens Object Stabilizer option can de-skew all z-slices to their correct position.
Correcting additional imaging defects
Aside from restoring blur and noise within LSFM data using deconvolution, additional image restoration may be needed to correct for other artifacts common to fluorescence microscopy [Reference North10,11]. For example, local charge leakages or dead pixels within the camera chip may result in the presence of hot and cold pixels in images. Also, cross-talk/bleed-through between channels and lens imperfections cause chromatic aberrations that hamper the correct interpretation and analysis of image data. Specific options within the Huygens software, such as the Hot & Cold Pixel Corrector, Chromatic Aberration Corrector, and CrossTalk Corrector, are present to address these types of distortions in light sheet image data.
Huygens Light Sheet Fusion and Deconvolution Wizard
Light sheet fluorescence microscopy is well suited for imaging large specimens from different directions, either by physically rotating the object itself or by detecting and illuminating from different directions (Figure 1A). Such a multi-angle measurement may show specific features more clearly in some of the image stacks than in others. For instance, images from deep layers of the specimen are generally more degraded in quality than images acquired from regions close to the objective because of photon scattering and absorption by the sample material. Thus, by fusing multi-view images into one single image (Figures 1A and 4A), image quality can improve in these regions. Moreover, since the resolution along the optical detection axis of the microscope is typically much worse than in the imaging plane, taking multiple images that are rotated around an axis perpendicular to the detection axis of the microscope can reveal features that are not well resolved in a single stack.

Figure 4 Fusion of multiview LSFM images. (A) Shown is a series of eight images acquired with a Zeiss Z1 Light Sheet microscope at 45° intervals. These different views of a fluorescent Drosophila brain can be loaded, deconvolved, and fused with the Huygens Light Sheet Fusion and Deconvolution Wizard resulting in a restored image (bottom right). (B) Maximum intensity projections (MIPs) of two single raw views (0 and 180 degrees) show high and low expression of NRE-GFP (Notch signaling) in areas in opposite parts of the sample. Arrowheads mark regions of degradation, which are restored by fusing multiple views of the sample. The right MIP shows the fused result of all eight raw views corresponding to the green channel in (A).
To optimally use the information of a multi-angle measurement, the different image stacks should be aligned in three dimensions: they need to be rotated into the same orientation and shifted to obtain a precise overlay. The aligned stacks can then be transformed into a single image stack by combining the pixel intensities. This can be done in a straightforward manner, for instance by taking the average or the maxima of the pixel intensities, or in more sophisticated ways that take the local quality of the image (in terms of their information content) into account. To facilitate the alignment of multi-angle views, small objects such as beads are frequently included in the sample to act as landmarks. Generally, this is not desirable since such beads are often very bright and can obscure dim object features. Furthermore in practice, the inclusion of beads in large samples such as tissue or small living species is a challenging task. The Huygens Light Sheet Fusion and Deconvolution Wizard provides a work-flow to automatically align a set of image stacks without the need to add external markers to the sample. The resulting aligned stacks can then be combined into a single image using several options for combining pixel intensities, ranging from simple averaging to the use of the local image entropy as a quality measure.
An important feature of the Huygens fusion wizard is the integration of the Huygens deconvolution algorithms into the fusion process. By deconvolving the data, the fusion process can be significantly improved because the alignment process is facilitated by the increase in resolution and signal-to-noise ratio of the source images. Furthermore, the registration and deconvolution of the multi-angle views has been optimized for execution on both the central processor and on graphical processors. Thus, the Huygens Light Sheet Fusion and Deconvolution Wizard provides a convenient and fast work-flow to deconvolve and fuse multiple LSFM views into a single high-quality image.
Results
Drosophila brain
The image of the sample was acquired with a Zeiss Light Sheet Z.1 (Carl Zeiss Microscopy, Jena, Germany) and shows a complete adult brain from Drosophila Melanogaster immunostained against GFP (green, Alexa488-coupled secondary antibody) and the protein Bruchpilot (red, Alexa633-coupled secondary antibody). Bruchpilot is a synaptic protein labeling all the neuropiles in the brain. The GFP expression was controlled by Notch signaling (NRE-GFP transgene). The sample was completely rotated around the y-axis to collect eight different stack images (stepsize: 45 degrees), which were saved as raw data in a single Zeiss czi file (Figure 4A).
The Huygens Light Sheet Fusion and Deconvolution Wizard, which starts as a separate window in Huygens (version 18.04.0p4), was used to select the images from the .czi file to fuse, to set the deconvolution and fusion parameters, and finally to perform the fusion operation (Figure 4A). Each of the eight input images was first deconvolved with the Classic Maximum Likelihood Estimation (CMLE) algorithm [7], and the regularization parameter for deconvolution (the signal-to-noise ratio; SNR) was set to 20 and 40 iterations. The Wizard transformed the images, by rotating and shifting and then fused them into the final result. The same fusion procedure was repeated without deconvolution to generate a fused result of the raw multi-view data. Maximum intensity projections (MIPs) of each image were generated to obtain 3D volume information. MIPs of the “0 degrees” and “180 degrees” views show distinct high and low signal in opposite regions in the Drosophila brain (Figure 4B). The low-signal regions, marked by arrowheads, clearly suffer from signal degradation due to light scattering and absorption. By contrast, the fused result of the raw multi-view data shows signal in all regions of the Drosophila brain supporting the advantage of acquiring and fusing multiple LSFM views (Figure 4B and 5).

Figure 5 Fusion and deconvolution of multiview Gaussian-based LSFM images. Eight rotated views of a fluorescent Drosophila brain were imaged with a Zeiss Z1 light sheet microscope. All views were fused in Huygens without and with deconvolution. Maximum intensity projections of both fused results show a rescue of signal in regions where the individual views show a degradation (shown in Figure 4B). The deconvolved and fused result reveals more contrast and object detail in both the NRE-GFP and Bruchpilot channel. Bottom images are magnifications. Scale bars are in micrometers.
If deconvolution and fusion of the raw multi-view data are combined, we notice an improvement of contrast in MIPs of the Drosophila brain. Moreover, additional object detail can be observed in both channels (Figure 5) and in zoomed regions of MIPs of Bruchpilot and single slices of expressed NRE-GFP (Figure 6).

Figure 6 Fusion and deconvolution of multiview Gaussian-based LSFM images. Left images show MIPs of the individual channels for Bruchpilot and NRE-GFPs, which are displayed together in Figure 5. Magnifications of both channels are shown as MIPs and single slices. Again more object detail can be recognized when applying deconvolution during the fusion process. Scale bars are in micrometers.
Breast carcinoma
The second example image was acquired with a dithered, multi Bessel beam Lattice Light Sheet microscope from 3i (Intelligent Imaging Innovations Inc. Denver, CO). The two-channel image shows a single cell of a SUM159 breast carcinoma cell line transiently transfected with an endoplasmic reticulum (ER) marker attached to OX-GFP (Addgene, Cambridge, MA). This probe should display perinuclear sheets of the ER as well as the reticular ER pattern generally observed at the periphery of the cell (Figure 7A–B, and 7A’–B’). The other probe represents a protein that is cytosolic under steady-state conditions but localizes to rings around lipid droplets upon fatty acid loading (Figure 7D–E). The acquired image was skewed during acquisition, and thus it needed to be de-skewed (de-sheared) first before deconvolution could be applied. The de-skewing was performed with the Huygens Object Stabilizer. Deconvolution of both channels was performed with the Good’s Roughness Maximum Likelihood Estimation (GMLE) algorithm [7], which was developed for low-signal data but also has been proven to work efficiently on widefield and LSFM data. Fifty iterations were applied, and the SNR parameter was set to 30. MIPs of the ER marker before and after deconvolution show that deconvolution reveals a more well-defined reticular ER pattern. This observation is supported by intensity profile measurements performed on both single Z slices and MIPs where the signal after deconvolution is at least two times higher than in the non-deconvolved image. Moreover, the full-width at half maximum of the peaks suggests an improvement in object detail about 2 times better (Figure 7C). Figure 7D is the same cell as in Figure 7A but corresponds to the second probe used, which is the cytosolic marker that should mostly localize to rings around lipid droplets. Although some areas within the raw image already hint toward these ring structures, deconvolution gives a much clearer picture and allows the identification of even more ring structures (Figure 7D’and E). Again, line intensity profiles demonstrate an improvement in signal and resolution of more than two times (Figure 7F).

Figure 7 De-skewing and deconvolution of lattice light sheet images. A skewed image of a breast carcinoma cell (cell line SUM159), expressing an ER marker linked to OX-GFP and a cytosolic protein that should mainly localize to lipid droplets, was acquired with a dithered, multi-Bessel beam Lattice Light Sheet system. The image was de-skewed in the Huygens Object Stabilizer. MIPs of the raw and deconvolved endoplasmic reticulum signal (A and B, respectively) and their corresponding magnifications (A’ and B’) show a more well-defined reticular ER pattern in the cell periphery and close to the nucleus after deconvolution. The line in panel A’ indicates the location in the raw and deconvolved image at which an intensity profile was produced (C; raw, undashed; deconvolved, dashed line). Panel D shows a MIP of the marker that localizes to rings around lipid droplets. These rings are difficult to discern in single slices of the raw image (D’), whereas deconvolution makes their appearance much clearer (E). The intensity profiles of a line in D’ show an increase of signal (more than 2 times) and resolution (more than 1.5 times) after deconvolution (F; raw, undashed line; deconvolved, dashed line). Scale bars are in micrometers.
Discussion
Like all fluorescent-based imaging techniques, light sheet microscopy introduces distortions in the image that conceal the true details of the imaged object. The main distortion factors are blurring, noise, scattering, and shading. Blurring and noise can be effectively corrected with Huygens iterative deconvolution using advanced maximum likelihood algorithms [Reference van der Voort6], and scattering and shading artifacts are restored by fusing and aligning multiple light-sheet images acquired from different directions. In this article we presented two different LSFM images that clearly benefited from deconvolution and fusion using the Huygens Light Sheet Fusion and Deconvolution Wizard. This Wizard offers, together with the de-skewing option in the Huygens Object Stabilizer, a unique, fast, and easy-to-use workflow for the restoration of images from a variety of LSFM systems. The processing of LSFM images by Huygens software is efficiently executed on the central processor and graphical processors. Processing poses no limit to file size and dimensions but may demand specific computer hardware. The results show improvements in signal and resolution of about 1.5 times and higher.
Conclusion
This article discusses image restoration from light sheet microscopes. Detailed descriptions are given of the fusion of multi-views of the specimen and of image deconvolution. Examples show improvements in image signal and resolution.
Acknowledgements
The authors from Scientific Volume Imaging b.v. (SVI) would like to thank everyone who helped us in developing the LSFM restoration tools by sharing their valuable LSFM image data. We also would like to thank Daniel Sevilla Sanchez (SVI) for critically reading the manuscript and Dr. Laurent Seugnet (WAKING Team, Centre de Recherche en Neurosciences de Lyon (INSERM U1028, CNRS UMR 5292)) for providing the fluorescent Drosophila brain sample.


