


Introduction
In order to examine cellular localization of a protein of interest with a particular biological structure, it is common to utilize primary antibodies against the protein with subsequent fluorophore conjugated secondary antibody staining and image acquisition with fluorescence microscopy. When the morphology of cellular structures needs to be investigated at high resolution, transmission electron microscopy (TEM) can be used. However, at times there is a need to investigate the same cell or cellular structure with both fluorescence microscopy and TEM to visualize protein localization with high-resolution morphology. This can be achieved by combining fluorescence microscopy with TEM by using correlative light and electron microscopy (CLEM). While there are many high-end CLEM techniques available from a variety of different manufacturers that streamline the process, these often require the purchase of expensive specialized equipment [Reference Timmermans and Otto1,Reference Koistinen2]. We developed an approach to CLEM using only commercially available reagents and standard epi-fluorescence and TEM systems. This makes CLEM universally available to researchers who have access to regular fluorescence microscopes and TEMs, but not the specialized equipment typically used to facilitate CLEM. To address these issues, we developed a method to prepare and fix samples on photo-etched, gridded cover slips stained first with a primary and then a secondary antibody conjugated to both an Alexa fluorophore and 10 nm gold. This allowed observation of identical fields of view in both fluorescence and TEM systems with a single staining procedure.
The model system to which we applied this technique was a monolayer of human fibroblasts infected with an Apicomplexan intracellular parasite Toxoplasma gondii [Reference Tu3]. We were interested in the biology and localization of a T. gondii bradyzoite-specific protein, termed MAG2, that we had identified in proteomic studies of the cyst wall of T. gondii [Reference Weiss and Kim4]. Toxoplasma gondii, an Apicomplexan parasite, can cause significant disease in both immune competent and immunocompromised humans. The predilection of this parasite for the central nervous system causing necrotizing encephalitis and for the eye causing chorioretinitis constitutes its major threat to patients. The development of these diseases is a consequence of the transition of bradyzoites, found within tissue cysts (for example, in the CNS within neurons), into actively replicating tachyzoites. Tissue cysts, therefore, serve as a reservoir for the reactivation of toxoplasmosis when the host becomes immuno-compromised with conditions such as AIDS or organ transplantation, or immune-compromised due to impaired immune responses to the pathogen when the infection has been acquired in utero. Understanding T. gondii developmental biology and formation of the cyst wall will provide the necessary underpinning for control strategies such as vaccine development, as well as the development of therapeutic agents that could eliminate latency and prevent reactivation toxoplasmosis.
Materials and Methods
Bright-field and fluorescence image acquisition
Human fibroblast cells infected with Toxoplasma gondii (Pru strain [Reference Timmermans and Otto1]) were grown on photo-etched cover slips (EMS #72264-23), fixed with 4% buffered paraformaldehyde, and immunolabeled for MAG2 (TgME49_209755) [Reference Weiss and Kim4] using murine monoclonal antibody 20C3 [Reference Weiss and Kim4] as the primary antibody and Alexa 488/10 nm colloidal gold goat anti-mouse IgG (Invitrogen/ Fisher Scientific #A31561) as the secondary antibody. Images were acquired on a DeltaVision Personal Epifluorescence Microscope (Applied Precision–GE Healthcare). One set of images was acquired with a 20× NA 0.3 air objective and another set with a 60× NA 1.42 oil objective, both in phase contrast and green fluorescence (excitation filter 470/40 and emission filter 525/50). At 60×, fluorescent images were acquired as z-stacks (step size of 0.2 µm) and deconvolved using SoftWorx (GE Healthcare) software.
TEM image acquisition
After imaging of Alexa 488 labeled MAG2, the cells were fixed with 2.5% glutaraldehyde in 0.1 M sodium cacodylate buffer for 30 minutes, rinsed with 0.1 M sodium cacodylate buffer, post-fixed with 1% osmium tetroxide in 0.1 M sodium cacodylate for 30 minutes, rinsed with buffer, and then rinsed with water. Cells were then en bloc stained with 2% uranyl acetate (aqueous), dehydrated through a graded series of ethanol (30, 50, 70, 95, 100, 100%), followed by propylene oxide and infiltrated with LX112 epoxy resin (Ladd Research Industries, Burlington, VT). The regions of interest (ROIs) imaged with fluorescence were located using a light microscope, and BEEM capsules were inverted over these areas. Samples were polymerized at 60°C for 60 hours, and blocks were popped off the cover slip. The general region of interest (ROI) was cut out and remounted on a flat BEEM capsule for sectioning. Trimming to the specific ROI was done using a Trimtool 45° (Diatome), and blocks were then serial thin sectioned (70 nm) en face on a Leica UC7 ultramicrotome using a Diatome Ultra 35° knife. Sections were collected on formvar-coated slot grids and stained with uranyl acetate and lead citrate. Imaging was performed on a JEOL 1200EX TEM, and micrographs were recorded using Kodak 4489 film.
Results
Cells were grown on photo-etched, gridded cover slips with alpha-numeric coordinates to facilitate relocating the same cells of interest within a grid. T. gondii cells selected for fluorescent imaging contained toxoplasma vacuoles that were well labeled for MAG2 protein located in the matrix of the toxoplasma cysts [Reference Tu5]. Fluorescence and bright-field (phase contrast) images were acquired on a standard epi-fluorescence microscope. First, images were acquired at low magnification (20× objective) to show an overview of the area of interest, including a number and a letter (see Figure 1A, overlay of bright-field and fluorescent image acquired with a 20× objective with the number 8 and letter M of the etched grid clearly visible). Then, a smaller area of that field of view was imaged again as a z-stack in fluorescence and brightfield (phase contrast) using a 60× objective (this subsection is indicated as the black square in Figure 1A).

Figure 1: Images required for correlation of light and electron microscopy. Phase/fluorescence overlay (A) showing the markings on the etched cover slips and the location of the cell of interest (arrow). Boxed area is shown in (B) as a TEM image; arrowheads indicate alignment of cover glass etching in first serial section. Low-magnification TEM image (C) of the cells, including cell of interest (arrow) in a subsequent serial thin section. Scale bar indicates 20 µm.
Subsequently, the cells were fixed with glutaraldehyde, post-fixed with osmium tetroxide, processed for electron microscopy using a standard protocol, and serially thin-sectioned. Due to the presence of the alpha-numeric grid, we were able to relocate the same cells by using the corresponding 20× magnification fluorescent/bright-field images and the gaps left in the sections from the etching on the cover slips. This is demonstrated in Figure 1B, which shows an early serial section of the fluorescent/bright-field sample shown in1A. Arrow heads in A and B indicate the location of the corner of the etched grid and the bottom of the etched number 8. Once the general area of interest had been identified, we were able to find the cells in subsequent sections in the TEM that corresponded to the cells present in the 20× magnification fluorescent/bright-field image (Figure 1C).
After high-resolution images of cells were acquired on the TEM, we generated overlays of the 60× magnification fluorescence/bright-field images and the TEM images of the same cells (Figure 2). The morphology of the parasites is clearly visible in the bright-field image (Figure 2A) as well as the TEM image (Figure 2C). To align the images, we stacked the images in Adobe Photoshop and used the borders of the parasites in brightfield and TEM as a guide for alignment. The fluorescence image (Figure2B) was passively aligned along with the bright-field image. In addition, we also had to move through the z-dimension of the fluorescence/bright-field z-stack using NIH ImageJ to select a single slice fluorescence/bright-field image that showed the best alignment of the morphologies with the TEM image.


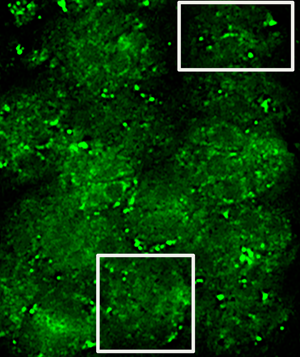
Figure 3: (A) Fluorescence image of vacuole shown in top right box of Figure 2. (B) TEM image of same region. (C) The fluorescence/TEM overlay image shows the alignment of the gold particles and the fluorescent signal. (D) is at higher magnification to show the gold more clearly. Scale bar in panel (C) indicates 500 nm and applies to panels (A–C). Scale bar in panel (D) indicates 250 nm.

Figure 4: (A) Fluorescence image of vacuole shown in the bottom box of Figure 2. (B) TEM image of same region. (C) The fluorescence/TEM overlay image shows the alignment of the gold particles and the fluorescent signal. (D) shows an increased magnification to show the gold more clearly. Scale bar in panel (C) indicates 500 nm and applies to panels (A–C). Scale bar in panel (D) indicates 250 nm.
In order to show the gold labeling more clearly, we selected two areas in Figure 2 (see box for areas of selection) and show these at higher magnification in Figures 3 and 4. Specific gold label could be seen on structures between the parasites. There was no gold outside of the cells and very little within the parasites. The gold label and the fluorescent label correlate well, allowing us to conclude that the electron-dense material between the parasites is the MAG2 protein that is labeled by monoclonal antibody 20C3. Due to the disparity in the section thicknesses, 70 nm physical in TEM and 200 nm optical in fluorescence, there are areas where there is fluorescence but no gold. We observed gold in adjacent serial sections of these areas (data not shown).
As a negative control cells treated without primary antibody showed no fluorescence nor any gold label (Figure 5) even on the electron dense material within the vacuolar space within the parasitophorous vacuole.

Figure 5: TEM images of no primary sample showing electron dense matrix material (arrow) without gold label at low magnification (A) and high magnification (B). Scale bar in (A) indicates 1 µm. Scale bar in (B) indicates 200 nm.
Discussion
This protocol was developed to facilitate CLEM immunolabeling experiments for a large population of researchers that have access to standard light microscopes and TEMs but no highly specialized CLEM hardware that has been developed by a variety of companies over the last few years. The key to this method is the use of a dual-labeled, commercially available secondary antibody, which is conjugated to both an Alexa 488 fluorophore and 10 nm gold. Use of this dual-labeled antibody ensures that any fluorescent signal and gold label observed is due to labeling by the same agent. The other key component of this method is the use of the photo-etched cover glass, which allows the researcher to find the same field of view/ROI in both fluorescence/bright-field images and TEM images, enabling a fast correlation of the two modalities. Although requiring technical expertise in en face thin sectioning and serial sectioning, this method enables the researcher to easily use both fluorescence and immuno-gold labeling to identify an antigen of interest in the specific cell of interest without investing in expensive CLEM technical equipment. Another advantage of the method is that using one labeling protocol reduces time and sample preparation.
Conclusions
In this paper we show that it is possible to conduct CLEM experiments without specialized CLEM hardware simply by taking advantage of commercially available materials, including a double-labeled secondary antibody (Alexa 488 and 10 nm gold) and a photo-etched cover glass.
Acknowledgments
This work was done at the Analytical Imaging Facility of Albert Einstein College of Medicine. The work was supported by a NCI cancer center support grant P30CA013330 and a Shared Instrumentation Grant #1S10OD016214-01A1. Special thanks to Xheni Nishku for Adobe InDesign and Photoshop assistance.


