


Introduction
Recent advances in electron microscopy (EM) technology and instrumentation allow the achievement of high-resolution imaging of biological samples [Reference Kremer1,Reference Titze and Genoud2]. However, optimal preservation of various biological specimens, ranging from bacteria and Drosophila to mammalian tissues, remains challenging. Variations in sample density, lipid content, and other factors can affect penetration efficiency of fixatives and other reagents, which directly impact preservation of cellular ultrastructure. While standard EM protocols have been developed to minimize alteration from the living state of an average sample, these protocols often give rise to artifacts and loss of structure. Centralized EM resources allow scientists to capitalize on the magnifying and resolving power of electron microscopes while relying on the technical competence of specialists for training, equipment maintenance, and guidance in preparatory procedures. Working in a research-driven microscopy core laboratory, we endeavor to understand the specific objectives of each assigned research project, identify suitable instrumentation and protocols that offer best results, and assist in interpretation of the data. Such an approach allows us to work with researchers from a variety of disciplines, including material, chemical, and biological sciences.
Optimal tissue fixation and staining are the most critical steps for obtaining high-quality EM images. Although high-pressure-freezing and freeze-substitution (HPF-FS) methods can best preserve cellular ultrastructure [Reference McDonald3–Reference Studer5], these methods require cumbersome instrumentation and are both time- and labor-intensive. Therefore, chemical fixation remains the preferred method. To improve fixation efficiency, animal tissues may be fixed by vascular perfusion, in which fixative is delivered through the blood vessels, resulting in excellent tissue preservation. This method is particularly useful for highly vascularized tissues, such as brain, liver, kidney, and for oxygen-sensitive tissues such as muscle and components of the central nervous system. The fixed tissues can then be processed and stained to allow for visualization of fine structure. In this article, we address the challenges facing a core EM laboratory where protocol optimization is necessary to obtain desirable results for a wide range of tissues and cells. In the following discussion, we will provide specific examples, illustrating the optimization of fixation and staining steps for mouse skeletal muscle, sciatic nerve, and urothelium, as well as isolated mouse T-cells, and various in vitro cultured cells.
Materials and Methods
Animals
All animal protocols were consistent with guidelines set by the National Institutes of Health and approved by the Institutional Animal Care and Use Committee of the New York University School of Medicine. Female one-week-old conditional SNX31 knockout mice bred at NYU were used.
Reagents and supplies
All chemical reagents used in these studies and their resources are listed below. Paraformaldehyde, glutaraldehyde, osmium tetroxide, uranyl acetate, thiocarbohydrazide (TCH), propylene oxide, 200-proof ethanol, EMbed 812, Durcupan ACM, and BEEM® capsule conical tip (Electron Microscopy Sciences, Hatfield, PA); 200-mesh thin bar grids, silver conductive epoxy (Ted Pella Inc., Redding, CA); Sylgard® 184 and 20 ml glass scintillation vials (Fisher Scientific Company, Hampton, NH).
Perfusion fixation of mouse skeletal muscle and sciatic nerve
Ketamine/xylazine anesthetized mice were fixed by cardiac perfusion with freshly prepared fixative solution containing 4% paraformaldehyde/1% glutaraldehyde in 0.1M phosphate buffer (pH 7.3)[Reference Hayat6]. Perfused mice were covered by a wet paper towel to avoid drying, and in vivo fixation continued for 1 hour after perfusion. Tibialis anterior or diaphragm muscles were dissected and pinned on 60 mm or 35 mm Sylgard® or paraffin wax-lined dishes using insect pins to avoid muscle contraction during sample processing (Figure 1). The muscles continued to be fixed at room temperature for 2 hours by force fixation (~1 ml of fixative solution in a 146 mm Pasteur glass pipette was forced into the tissue, repeating 3–4 times while moving the pipette up and down along the tissue) inside a chemical hood followed by overnight fixation on a low-speed shaker at 4°C. All of the following steps were performed inside a chemical hood at room temperature on a shaker at low speed: muscles were washed with 100 mM Tris (pH 7.2) containing 160 mM sucrose for 30 minutes, 2 times for 30 minutes in iso-osmotic phosphate buffer (150 mM sodium chloride, 5 mM potassium chloride, 10 mM sodium phosphate, pH 7.3) and then force fixed again with osmium tetroxide (1% osmium tetroxide in 140 mM sodium phosphate, pH 7.3) for 1.5 hours. For mouse sciatic nerve, anesthetized mice were fixed via transcardial perfusion with 4% paraformaldehyde/2.5% glutaraldehyde and 0.1M sucrose in 0.1M phosphate buffer (pH 7.4)[Reference Domènech-Estévez7]. Sciatic nerves were collected and fixed in the same fixative at room temperature for 2 hours followed by 4°C overnight and then post-fixed with 1% osmium tetroxide for 2 hours at room temperature.

Figure 1: Homemade Sylgard dish. (A) Sylgard is transparent; (B) Sylgard becomes black after osmification. Insect pins (arrow) were used to anchor isolated muscles on Sylgard.
The muscles and sciatic nerves were washed 3 times for 1 hour in water, en bloc stained with 1% uranyl acetate aqueous solution for 1 hour, dehydrated in a series of ethanol solutions (30%, 50%, 70%, 85%, 95%, 100%, 100%) for 15 minutes each step; then trimmed and transferred muscle samples to glass scintillation vials in 100% ethanol, following by 2 times change of propylene oxide for 30 minutes each. The samples were infiltrated in propylene oxide/resin mix 1:1 for 3 hours, 1:2 overnight, then embedded in EMbed 812, and cured at 60°C for 48–60 hours. Semi-thin sections were cut at 1 μm and stained with 1% toluidine blue to evaluate the quality of sample preservation and orientation of muscle fibers [Reference Friese8–Reference Wang10].
Mitochondria morphology
In vitro cultured intestinal secretin tumor (STC) bone marrow (BM) cells, human leukemia cells MV4-11, STC cells, and human melanoma CHL1 cells (ATCC, Manassas, VA) were fixed in 0.1M sodium cacodylate buffer (pH 7.2) containing 2.5% glutaraldehyde/2% paraformaldehyde for 2 hours and post-fixed with 1% osmium tetroxide and 1% potassium ferrocyanide for 1 hour at 4°C, then en bloc stained in 0.25% aqueous uranyl acetate overnight at 4°C, dehydrated in an ice-cold ethanol series, infiltrated by propylene oxide at room temperature, and embedded in EMbed 812 [Reference Chen11].
Flow-isolated mouse T-cells were collected in BEEM® conical capsule tips at 400 × g for 4 minutes by swinging bucket centrifugation using a 1.5 ml Eppendorf tube as an adaptor. Mouse bladders were dissected and cut into 1 × 1 × 2 mm pieces. Both T-cells and bladder tissues were fixed in 0.1M sodium cacodylate buffer (pH 7.2) containing 2.5% glutaraldehyde/2% paraformaldehyde. For conventional TEM, cells and tissues were post-fixed with 1% osmium tetroxide, en bloc stained with 1% uranyl acetate, and embedded in EMbed 812. As an alternative to osmium tetroxide post-fixation, samples were fixed with the rOTO method (rOTO: reduced osmium-thiocarbohydrazide (TCH)-osmium) to increase cell membrane contrast [Reference Bushong12–Reference Tapia14]. These samples were post-fixed in 1.5% potassium ferrocyanide-reduced 2% osmium tetroxide in 0.1M sodium cacodylate buffer for 1 hour, rinsed in double-distilled H2O (ddH2O), and then treated with 0.1% aqueous TCH for 20 minutes. After further rinsing in ddH2O, cells were treated with 2% aqueous osmium tetroxide for 30 minutes, 1% aqueous uranyl acetate for 1 hour, and lead aspartate for 30 minutes to further enhance membrane contrast. Samples were then dehydrated with an ethanol series as described above, embedded in Durcupan ACM resin, and allowed to polymerize at 60°C for 48–60 hours.
Transmission electron microscopy (TEM)
Ultrathin sections (60–70 nm) were collected on 200-mesh thin-bar grids and stained with uranyl acetate and lead citrate by standard methods. All stained grids were examined with either a Philips CM-12 TEM (FEI; Eindhoven, The Netherlands) with a Gatan (4k × 2.7k) digital camera (Gatan, Inc., Pleasanton, CA) or a Talos 120C TEM (Thermo Fisher Scientific, Waltham, MA) with a Gatan OneView camera.
Serial block-face scanning electron microscopy (SBF-SEM)
The polymerized T-cell or mouse bladder sample blocks were trimmed and mounted on 3View pin stubs using silver conductive epoxy to electrically ground the sample block. The entire surface of the specimen was then sputter-coated with a thin layer of gold/palladium and imaged using a Gatan OnPoint BSE detector in a Zeiss GEMINI 300 VP FE-SEM equipped with a Gatan 3View automatic microtome (Carl Zeiss Microscopy; Oberkochen, Germany). The system was set to cut 50 nm slices for T-cells and 90 nm sections for mouse urothelium. Images were recorded after each round of sectioning from the block face using an SEM beam at 1 keV with a dwell time of 1.0 μs/pixel with a pixel size of 2 nm and an image size of 19 μm × 19 μm for the T-cell sample. For the mouse urothelium sample, images were recorded at 1.2eV with a dwell time of 2.0 μs/pixel with a pixel size of 3 nm and an image size of 28.5 μm × 28.5 μm. Automated data acquisition was performed with Gatan DigitalMicrograph software. A stack of 149 slices of T-cells and 36 slices of urothelium were aligned and assembled using ImageJ. Segmentation and videos were generated by Thermo Fisher Scientific Amira 6.4 software or ORS Dragonfly 4.1.
Results and Discussion
Perfusion fixation is the key to maintain fine ultrastructure of skeletal muscle
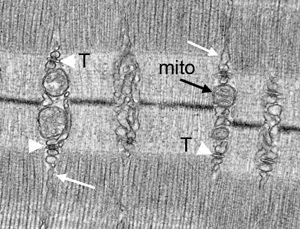
Skeletal muscle is densely packed with protein-rich myofibrils, making it difficult for the fixative to penetrate. Mouse skeletal muscles prepared by perfusion fixation show excellent preservation of their ultrastructure with the following features: (1) relaxation of muscle fibers, which display general organization of muscle, notably alignment of thick filament myosin-containing A-bands, H-bands, thin-filament actin-containing I-bands, M-lines, and Z-lines (Figures 2A–D); (2) mitochondrial structure, so that the outer and inner membranes of cristae in mitochondria should not be swollen, condensed, or otherwise damaged (Figures 2C–D); (3) myofiber orientation, with appropriate orientation of skeletal muscle during sample embedding and sample block trimming, which is crucial for myofiber structural analysis; the sections should be either true cross sections, which is necessary to determine myofiber size (Figure 2E), or true longitudinal sections (Figures 2A–D) in order to follow myofibers to a certain distance; and (4) sarcoplasmic reticulum (SR) and transverse tubule (T-tubule/SR) triads. In skeletal muscle, SR comes into close contact with invaginations of the cell membrane and T-tubules forming triads at A-I junctions. Each triad consists of a central T-tubule flanked by two terminal cisternae of the SR (Figures 2D, 2F). Myofibers are 50–100 μm in diameter and several millimeters to centimeters long, and contain large amounts of internal calcium. The concentration of calcium within the sarcoplasm is regulated by SR. It is necessary to have a highly specialized triad structure to connect sarcolemma with calcium stores and to serve as a secondary messenger to overcome spatial limits.
Insufficient perfusion (Figure 3A) and immersion fixation (Figure 3B) show defective (Figure 3A) or condensed (Figure 3B) mitochondria. In contrast to the well-preserved samples shown in Figure 2, the same samples fixed by immersion fixation (Figure 3B) or inefficient perfusion (Figure 3A) show extensive damage to the SR, T-tubules, and mitochondria (Figures 3A–B). Slow fixation of muscle may result in an action potential, causing immediate calcium release from the SR initiating muscle contraction, which results in moderate distention (Figure 3A) to severe enlargement (Figure 3B) of SR and T-tubules.

Figure 2–3: Comparison of mouse skeletal muscle prepared by perfusion fixation (Figure 2), insufficient perfusion (Figure 3A), and by immersion fixation (Figure 3B). Effective perfusion fixation produces relaxation of muscle fibers (Figures 2A–2D), and the tibialis anterior muscle fibers show clear sarcomeres (S), A-bands (A), H-bands (H), I bands (I), M-lines (M), and Z-lines (Z). Mitochondria cristae are maintained (mito, black arrow), sarcoplasmic reticulum (SR) (white arrow), and T-tubule/SR triads (arrowhead) are well preserved. However, insufficient perfusion and immersion fixation results in contracted muscle fibers (Figure 3), mitochondria show signs of damage (Figure 3A, black arrows) or become condensed (Figure 3B, black arrows), and the SR (white arrows) is distended, ranging from modestly (Figure 3A) to severely enlarged (Figure 3B). Figure 2E is a cross section of muscle fibers fixed by perfusion. Figure 2F shows an enlarged SR triad with the white arrows indicating the SR and the black arrowhead the T-tubule.
The use of an appropriate buffer for the fixative is another important factor for the ultrastructural preservation of biological samples. For example, sodium cacodylate buffer is a popular buffer for animal tissues [6,15], but it can cause changes in membrane permeability and a redistribution of cellular materials along osmotic gradients. Consistent with this [Reference Reith16], we found that phosphate buffer is superior to sodium cacodylate for skeletal muscle tissues. This is also true for the central and peripheral nervous systems, such as mouse sciatic nerve (Figure 4)[Reference Domènech-Estévez7]. The structure of myelinate axons is better preserved by perfusion fixation with phosphate buffer and processed at room temperature (Figure 4A), whereas sodium cacodylate buffer might make myelinated axons shrink and cause morphological change (Figure 4B). Initial room temperature fixation (2 hours) of dissected tissue following perfusion can help fixatives penetrate tissue faster, which might better preserve the ultrastructure (Figures 4A–B), while slow fixation at 4°C might not be sufficient for structural preservation of sciatic nerve (Figures 4C–D).

Figure 4: Buffer and temperature effects on structure preservation of mouse sciatic nerve. (A) and (B) Mouse sciatic nerve was perfusion-fixed and processed by standard protocols with glutaraldehyde/osmium fixation. Myelinated axons (arrows) were preserved better at room temperature with submersion fixation with phosphate buffer (A) after perfusion compared to sodium cacodylate buffer (B). Low-temperature (4°C) submersion fixation damaged myelinated axon structure with both phosphate (C) and sodium cacodylate buffers (D).
Visualization of mitochondria in cells and tissues. The integrity of mitochondria is crucial for maintaining mitochondrial membrane potentials, which drive ATP production and mitochondrial homeostasis. Mitochondrial fusion generates discrete and fragmented mitochondria that can increase production of reactive oxygen species, facilitate mitophagy, accelerate cell proliferation, and mediate apoptosis [Reference Yu17]. Preservation of mitochondrial structure is essential to the quantitative measurement of mitochondrial fusion or fragmented dynamics, which might link to cellular metabolism [Reference Chen11]. Although glutaraldehyde-osmium tetroxide fixation is often used to preserve overall cell morphology [Reference Sabatini18] (Figures 5A, 6A, and 6D), it is not optimal for preserving mitochondria in all cell or tissue types. We found that low-temperature dehydration is very important for maintaining mitochondrial membrane structure during developmental stages in the Drosophila germarium [Reference Hurd, Bratu and McNeil19]. We also noticed that osmium tetroxide reduced by potassium ferricyanide or potassium ferrocyanide can greatly enhance the contrast of mitochondrial membranes in several cultured cell lines (Figures 5B–D) and mouse T-cells (Figure 6B), as well as in vivo mouse urothelium (Figure 6E). Such improved membrane contrast allowed us to discover intramitochondrial lipid droplet (LD) formation in the SNX31-knockout mouse urothelium (Figure 6E). SNX31 is a highly specialized sorting nexin that is specifically associated with the multivesicular bodies (MVB) of terminally differentiated mouse urothelial umbrella cells [Reference Hurd, Bratu and McNeil19].

Figure 5: Reduced osmium enhances membrane contrast of mitochondria in various in vitro cultured cell lines. (A) intestinal secretin tumor (STC) BM cells without potassium ferricyanide during osmification showing reduced contrast of membranes; (B) MV4-11 (human leukemia) cells, (C) CHL1 (human melanoma) cells, and (D) STC cells processed with potassium ferricyanide to reduce the osmium. Note that mitochondrial membranes and cristae can be distinguished clearly.

Figure 6: Different sample preparation methods reveal different mitochondrial appearance in flow-sorted mouse T-cells (A, B, and C), and mouse urothelium (D and E). It is difficult to distinguish mitochondrial cristae in T-cells (A, black arrow), and mitochondrial lipid droplets are hardly recognized (D, white arrows) by conventional glutaraldehyde/osmium fixation method. The rOTO method greatly improved mitochondrial (B and E, black arrows) and lipid droplet membrane appearance (E, black arrows and asterisk). (C) 3D model of mitochondrial distribution in an isolated mouse T-cell.
T-cells are specialized lymphocytes that play a central role in cell-mediated immunity, including antiviral immunity. Recent developments in chimeric antigen receptor (CAR) T-cell immunotherapy have added a new weapon in the fight against cancer. Mitochondria are metabolic organelles that actively transform their ultrastructure as the cells become involved in different phases of antiviral responses and/or cell death, and mitochondrial remodeling is a signaling mechanism that instructs T-cell metabolic programming [Reference Liao20]. Mitochondrial changes in T-cells of cancer models are an important aspect for cancer research. However, quantification of mitochondria in T-cells using conventional glutaraldehyde/osmium tetroxide TEM protocols is technically challenging due to the small size and large nuclear occupancy of the T-cell (Figure 6A). Given the availability of a relatively small number (hundreds to thousands) of flow-sorted mouse T-cells, we found that spinning the cells in a swinging bucket centrifuge allowed the majority of cells to be collected at the tip of a conical BEEM capsule, and the cell pellet did not need to be disturbed during subsequent processing. The sample was then embedded in situ so that the cells were securely preserved at the tip of the BEEM capsule until sectioning. A modified rOTO protocol with additional uranyl acetate and lead aspartate en bloc staining further increased heavy-metal content of the samples [Reference Tapia14,Reference Buck21] such that mitochondrial membrane structure in T-cells was more defined by the enhanced contrast (Figure 6B). This en bloc staining method can also increase sample conductivity during SBF-SEM imaging (Figure 6C) and FIB-SEM imaging (data not shown).
Three-dimensional electron microscopy data
With well-preserved biological samples one can easily achieve high-resolution two-dimensional images using modern TEMs. However, TEM imaging is limited to relatively thin sections. Manual serial section TEM (ssTEM) has been adopted by using 50–70 nm thickness to capture a tissue volume [Reference Seligman22–Reference Harris25], while serial section electron tomography (ssET) reduces the number of sections (section thickness ranging from 50 nm to 1 μm) needed by collecting a tilt series to construct a large volume. However, the disadvantage of ssTEM imaging is that skilled labor-intensive sectioning is involved. Cutting and collecting hundreds of sections, staining and imaging grids, and aligning each individual image to get a full 3D reconstruction of a large volume sample is challenging [Reference White26]. Three-dimensional electron microscopy (3DEM) makes automatic cutting and imaging possible by SBF-SEM or FIB-SEM, which greatly improves throughput and reliability for volume microscopy [Reference Kremer1,Reference Titze and Genoud2]. Depending on the volume and resolution requirements, one can choose the best fit with either SBF-SEM or FIB-SEM for each individual project. We used SBF-SEM to evaluate the architecture of mitochondria in T-cells (Figure 6C) and FIB-SEM to characterize Wolbachia localization in cultured JW18 cells (data not shown).
One major challenge for volume microscopy is data handling. 3DEM generates a large number of images, which need to be translated into a presentable format that involves image segmentation and 3D model generation. Free software such as TrakEM2, ilastick, and IMOD can function at a level that is comparable to commercial software, such as ORS Dragonfly and Amira. However, image analysis is computationally time-intensive, which can present a problem for busy core facility staff. EM images are inherently lower contrast and grayscale, making it challenging to implement machine learning pipelines for automatic segmentation. Even the best machine learning functions of commercially available software cannot achieve 100% accuracy in detection of myelinated axons, one of the most contrasted organelles inside the cell. Segmentation of mitochondria, other cell organelles, and fine ultrastructure must be performed by a combination of machine learning and manual tracing with currently available software. There are several limiting factors that can be mitigated in the processing of 3DEM data, provided the core has access to: (1) a gigabit or faster data transfer system and reliable dedicated server space for image storage; (2) a powerful computer that can handle large data sets and software required for image analysis; (3) experienced scientists to recognize structures of interest; (4) time and patience, as segmentation is a tedious and time-consuming task; and (5) a well-structured billing system that can accurately measure the time-intensive nature of this work. Here we provide an efficient workflow for our 3DEM projects:
1. Experimental design: find the best protocol to fit the experimental purpose;
2. Data generation: with good sample preservation, one can choose different imaging strategies (electron tomography, SBF-SEM, FIB-SEM, or automated tape ultramicrotomy (ATUM-SEM);
3. Data transfer, alignment, and adjustment: the images are collected and stored directly onto a research server via a high-speed fiber transfer system, where they can be aligned and adjusted by core staff;
4. Generate a 3D model: segmentation can be done using a combination of automatic and manual segmentation with ORS Dragonfly or Amira, which can be completed by lab students, postdocs, volunteer undergraduate students, or high school students after proper supervision and training by core staff.
Our goal is to deliver a final product containing meaningful images and significant data to our collaborators and researchers. Given the intensive labor and billing issues involved in segmentation, we believe the most efficient and economical way to achieve successful image analysis in the context of an imaging core facility is to train project-related graduate students or postdocs and recruit volunteer undergraduate or high school students guided by experienced core staff to use commercially available software for segmentation to generate 3D models.
Acknowledgments
We thank NYULH DART leadership Adriana Heguy and Sheenah Mische for their support to the Microscopy Laboratory. The Microscopy Laboratory is supported in part by NIH/NCI P30CA016087. The Zeiss Gemini300 SEM with 3View was purchased with support of NIH/OD S10OD019974. We thank Ruth Lehmann, previous Director of the Skirball Institute and Chairperson of New York University Cell Biology for her unwavering support of the core for the past 15 years; Steve Burden and James Salzer for helpful discussion, and Tung-Tien Sun for critical reading and feedback on our manuscript.


