


Crossref Citations
This article has been cited by the following publications. This list is generated based on data provided by Crossref.
Konopka, John
2019.
Long Element Profile of Layered Coastal Sediments by SEM/EDS.
Microscopy and Microanalysis,
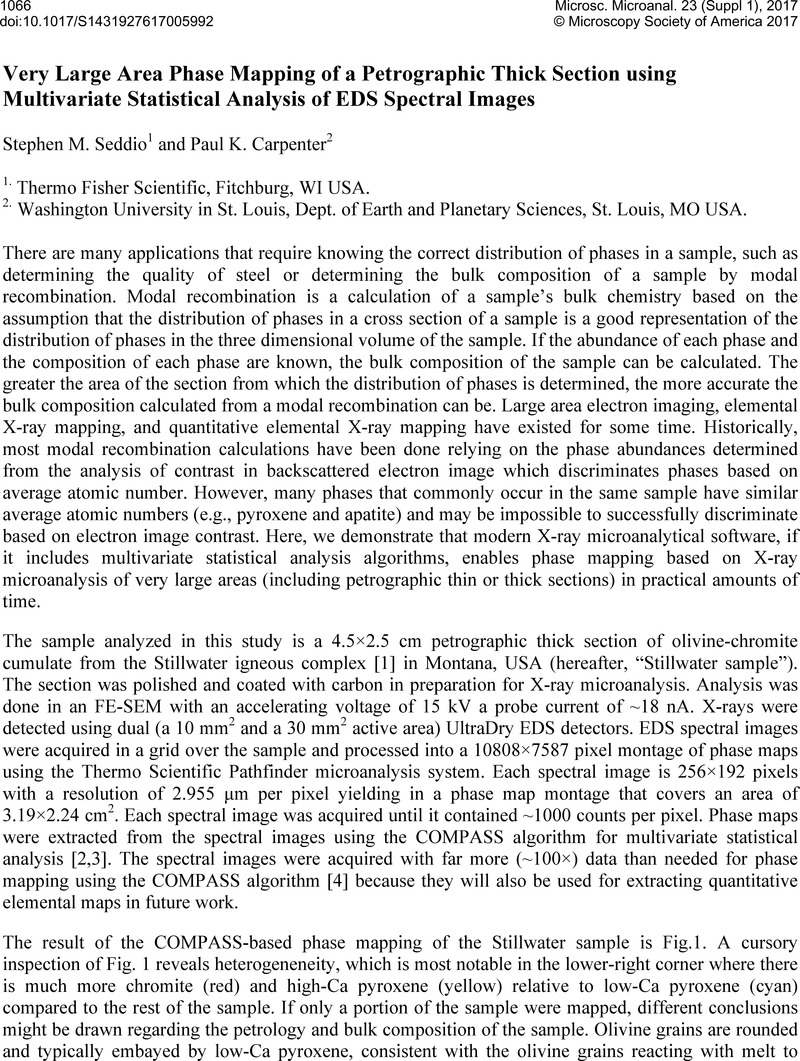
Vol. 25,
Issue. S2,
p.
804.