


Introduction
Most of the functional materials that are currently used in catalysis undergo dynamic changes during operation that can be expressed by alterations of their geometric or electronic states (Hansen et al., Reference Hansen, Wagner, Helveg, Rostrup-Nielsen, Clausen and Topsøe2002; Kalz et al., Reference Kalz, Kraehnert, Dvoyashkin, Dittmeyer, Glaser, Krewer, Reuter and Grunwaldt2017; Kooyman, Reference Kooyman, Frenken and Groot2017). As some of these changes are thought to be stable during operation only, ex situ studies comparing pristine and spent materials alone are not sufficient to provide the complete description of catalysts at work.
Heterogeneous catalysts, for example, are metastable compounds and their active phase is thought to be highly sensitive to the applied chemical potential (Kalz et al., Reference Kalz, Kraehnert, Dvoyashkin, Dittmeyer, Glaser, Krewer, Reuter and Grunwaldt2017). Therefore, slight changes in pressure, reactant concentration or temperature could lead to vastly different outcomes. Only the study of catalysts under defined and industrially relevant working conditions, including the detection of conversion, will give valid insights into the mechanisms at play. Probing catalysts under relevant industrial conditions (temperature, pressure, flows and gas hourly space velocity) is, however, challenging.
In situ techniques, where active catalysts can be studied under working reaction conditions, including the detection of conversion, have been developed successfully for a range of different spatially resolved (Ackermann et al., Reference Ackermann, Pedersen, Hendriksen, Robach, Bobaru, Popa, Quiros, Kim, Hammer, Ferrer and Frenken2005; Hendriksen et al., Reference Hendriksen, Ackermann, van Rijn, Stoltz, Popa, Balmes, Resta, Wermeille, Felici, Ferrer and Frenken2010; Chenna & Crozier, Reference Chenna and Crozier2012; Vendelbo et al., Reference Vendelbo, Elkjær, Falsig, Puspitasari, Dona, Mele, Morana, Nelissen, van Rijn, Creemer, Kooyman and Helveg2014; Kudernatsch et al., Reference Kudernatsch, Peng, Zeuthen, Bai, Merte, Lammich, Besenbacher, Mavrikakis and Wendt2015; Onderwaater et al., Reference Onderwaater, van der Tuijn, Mom, van Spronsen, Roobol, Saedi, Drnec, Isern, Carla, Dufrane, Koehler, Crama, Groot, Felici and Frenken2016), spectroscopic (Knop-Gericke et al., Reference Knop-Gericke, Hävecker, Schedel-Niedrig and Schlögl2000; Topsøe, Reference Topsøe2003; Bañares, Reference Bañares2005; Bukhtiyarov et al., Reference Bukhtiyarov, Nizovskii, Bluhm, Hävecker, Kleimenov, Knop-Gericke and Schlögl2006; Tinnemans et al., Reference Tinnemans, Mesu, Kervinen, Visser, Nijhuis, Beale, Keller, van der Eerden and Weckhuysen2006; Bluhm et al., Reference Bluhm, Hävecker, Knop-Gericke, Kiskinova, Schlögl and Salmeron2007; Salmeron & Schlögl, Reference Salmeron and Schlögl2008; Bentrup, Reference Bentrup2010; Horn et al., Reference Horn, Korup, Geske, Zavyalova, Oprea and Schlögl2010; Gänzler et al., Reference Gänzler, Casapu, Boubnov, Müller, Conrad, Lichtenberg, Frahm and Grunwaldt2015; Velasco-Vélez et al., Reference Velasco-Vélez, Pfeifer, Hävecker, Wang, Centeno, Zurutuza, Algara-Siller, Stotz, Skorupska, Teschner, Kube, Braeuninger-Weimer, Hofmann, Schlögl and Knop-Gericke2016) and diffractive techniques (Beale et al., Reference Beale, Jacques and Weckhuysen2010). Using these in situ techniques, changes in the bulk and surface structures under working conditions can be detected. Such in situ investigations can be called as operando investigations when an unambiguous correlation is established between observed structural, morphological, chemical changes of the system and a clear evidence that the reaction of interest is actually operating.
Many of these operando techniques, however, lack the spatial resolution to correlate structure at the nanoscale and function of the catalysts. Previously, we have shown that quasi in situ transmission electron microscopy (TEM) can be used to successfully study catalysts at various stages of reactions at high resolution, but not during the transitions between these stages (Masliuk et al., Reference Masliuk, Swoboda, Algara-Siller, Schlögl and Lunkenbein2018). Temporally and spatially resolved operando TEM is the only technique to provide high-resolution information about the structure–function relationship under relevant working conditions and to visualize intermediate states at the atomistic level.
However, the investigation of functional materials under operando TEM conditions is far from trivial. TEM investigation under environmental conditions has been attempted since 1934 (Marton, Reference Marton1934, Reference Marton1935; Ruska, Reference Ruska1942; Hashimoto et al., Reference Hashimoto, Naiki, Eto and Fujiwara1968; Boyes & Gai, Reference Boyes and Gai1997). Yet, modern environmental microscopes can still only be operated at pressures up to approximately 25 mbar in the sample region. Microelectromechanical system (MEMS) based gas cell TEM holders have been developed recently to investigate functional materials at elevated pressures (Creemer et al., Reference Creemer, Helveg, Hoveling, Ullmann, Kooyman, Molenbroek, Zandbergen and Sarro2009, Reference Creemer, Santagata, Morana, Mele, Alan, Iervolino, Pandraud and Sarro2011; Allard et al., Reference Allard, Overbury, Bigelow, Katz, Nackashi and Damiano2012; Prasad et al., Reference Prasad, Arya and Khanna2015; Garza et al., Reference Garza, Morsink, Xu, Sholkina, Pivak, Pen, Weperen and Xu2017). MEMS-based nanoreactors allow for pressures up to 14 bar (Creemer et al., Reference Creemer, Santagata, Morana, Mele, Alan, Iervolino, Pandraud and Sarro2011) and temperatures up to 1,300°C (Garza et al., Reference Garza, Morsink, Xu, Sholkina, Pivak, Pen, Weperen and Xu2017). Several in situ TEM studies using MEMS-based nanoreactors have yielded results with different functional materials in various reductive and oxidative environments (Kooyman et al., Reference Kooyman, Hensen, de Jong, Niemantsverdriet and van Veen2001; Hansen et al., Reference Hansen, Wagner, Helveg, Rostrup-Nielsen, Clausen and Topsøe2002; Giorgio et al., Reference Giorgio, Cabié and Henry2008; Vendelbo et al., Reference Vendelbo, Elkjær, Falsig, Puspitasari, Dona, Mele, Morana, Nelissen, van Rijn, Creemer, Kooyman and Helveg2014; Crozier & Hansen, Reference Crozier and Hansen2015; Aouine et al., Reference Aouine, Epicier and Millet2016; Bremmer et al., Reference Bremmer, Zacharaki, Sjåstad, Navarro, Frenken and Kooyman2017; Zou et al., Reference Zou, Li, Zakharov, Stach and Zhou2017; Dembele et al., Reference Dembele, Moldovan, Hirlimann, Harmel, Soulantica, Serp, Chaudret, Gay, Maury, Berliet, Fecant and Ersen2018; Roiban et al., Reference Roiban, Li, Aouine, Tuel, Farrusseng and Epicier2018; Altantzis et al., Reference Altantzis, Lobato, De Backer, Béché, Zhang, Basak, Porcu, Xu, Sánchez-Iglesias, Liz-Marzán, Van Tendeloo, Van Aert and Bals2019; De Vrieze et al., Reference De Vrieze, Bremmer, Aly, Navarro, Thybaut, Kooyman and Saeys2019; Tan et al., Reference Tan, Chee, Baraissov, Jin, Tan and Mirsaidov2019). Although most of these studies are not directly proofing the catalytic function, they still provide valuable information about structural and morphological changes of materials in various gas atmospheres at elevated temperatures. Up to now, there has been only two operando high-resolution visualization studies of catalytic reactions inside the TEM column using MEMS-based nanoreactors (Vendelbo et al., Reference Vendelbo, Elkjær, Falsig, Puspitasari, Dona, Mele, Morana, Nelissen, van Rijn, Creemer, Kooyman and Helveg2014; Tan et al., Reference Tan, Chee, Baraissov, Jin, Tan and Mirsaidov2019).
Here, we present a versatile, homebuilt gas feed and analysis setup that can be directly coupled to a quadrupole mass spectrometer (QMS) for gas analysis, which allows online conversion detection and is compatible with conventional, commercially available MEMS-based gas cell TEM holders. The specifications of the system will be shown to be: a large pressure range, a fast gas exchange, a large available range of flow rates from μL/min to mL/min, exchangeable diameters of the inlet and outlet tubes and a very low detection limit for MS measurements. In addition to the in situ and operando TEM, this system can be used also for other micro- and nanoreactor systems which are not related to microscopy. Aside from giving the technical characteristics of the setup, the functionality of the system will also be shown using CO oxidation over Pt nanoparticles (NPs).
Materials and Methods
Sample Preparation
Pt NPs were prepared in situ by thermal decomposition of tetraammineplatinum (II) nitrate (99.995%, Sigma Aldrich) (Vendelbo et al., Reference Vendelbo, Elkjær, Falsig, Puspitasari, Dona, Mele, Morana, Nelissen, van Rijn, Creemer, Kooyman and Helveg2014). A small amount of the platinum precursor was sonicated in isopropanol (HPLC grade) in order to obtain a high particle dispersion and to avoid large agglomerates during sample deposition by drop-casting. Samples were deposited onto electron transparent Si3N4 windows. Further details can be found in the results section. The sample loading was roughly estimated to be below 1 µg.
TEM Imaging
TEM imaging of the Pt NPs was performed on a Cs-corrected FEI TITAN 80-300 at 300 kV equipped with a GATAN UltraScan 1000XP camera and connected to a QMS, as described in details in the results section. The electron dose rate was kept below 30 e/Å2s at all times, except for the high-resolution imaging of the Pt NPs when the electron dose rate was kept below 1,000 e/Å2s. The dose rate of 30 e/Å2s was found to represent a safe limit in several studies (Taheri et al., Reference Taheri, Stach, Arslan, Crozier, Kabius, LaGrange, Minor, Takeda, Tanase, Wagner and Sharma2016; Wagner & Beleggia, Reference Wagner, Beleggia, Hansen and Wagner2016; Kooyman, Reference Kooyman, Frenken and Groot2017). Below this limit, sample damage due to electron–matter interactions has been found to be negligible and below the detection limit. The high-resolution images were only used to show the high-resolution imaging possibilities. When adapting this setup, the achievable temporal and spatial resolution for imaging at specific dose rates will strongly depend on the specifications of the cameras used. Since for the present study, a conventional camera was used, the resolution achieved here represents a lower limit in achievable resolution for the stated dose rates. The operando experiments were performed with the commercially available DENSsolutions climate holder. The detection of reactants and products was performed on a QMS 220 PrismaPlus from Pfeiffer with a range of 1–100 amu.
Image Processing
Data analysis and image processing were performed via DigitalMicrograph and ImageJ. Image and selected area electron diffraction (SAED) pattern were acquired with acquisition times of 0.5 s in the selected temperature regimes. Between image acquisitions, the pre-specimen shutter was used to further reduce the exposure of the sample to the electron beam.
Results
Homebuilt Gas Feed System
A schematic diagram of the gas feeding and analysis setup for temporally and spatially resolved operando TEM is shown in Figure 1a. The setup guarantees a precise gas flow through commercially available gas cell TEM holders . The system can be divided into a gas mixing stage and a flow and pressure controlling stage, which is coupled to a QMS. To add more flexibility to the setup, the gas feeding stage, equipped with a QMS, gas pressure and flow controllers, is movable to minimize the distance between the TEM holder and the QMS (Fig. 2a). Ultimately, this leads to a reduction of the QMS delay time. In total, the gas mixing stage consists of five gas lines, which are equipped with shut-off valves, gas purifiers (O2, H2O and hydrocarbons), pressure reducers and flow controllers (precision: 0.1 mL/min). The He, O2, and H2 gas lines are fixed and supplied with the gas of high purity. Still, the gases were further purified from hydrocarbons (He, O2, and H2 gas lines) and moisture (He and O2 gas lines). The other two lines in the setup are free to be used for different gases or vapors (e.g. methanol or water).
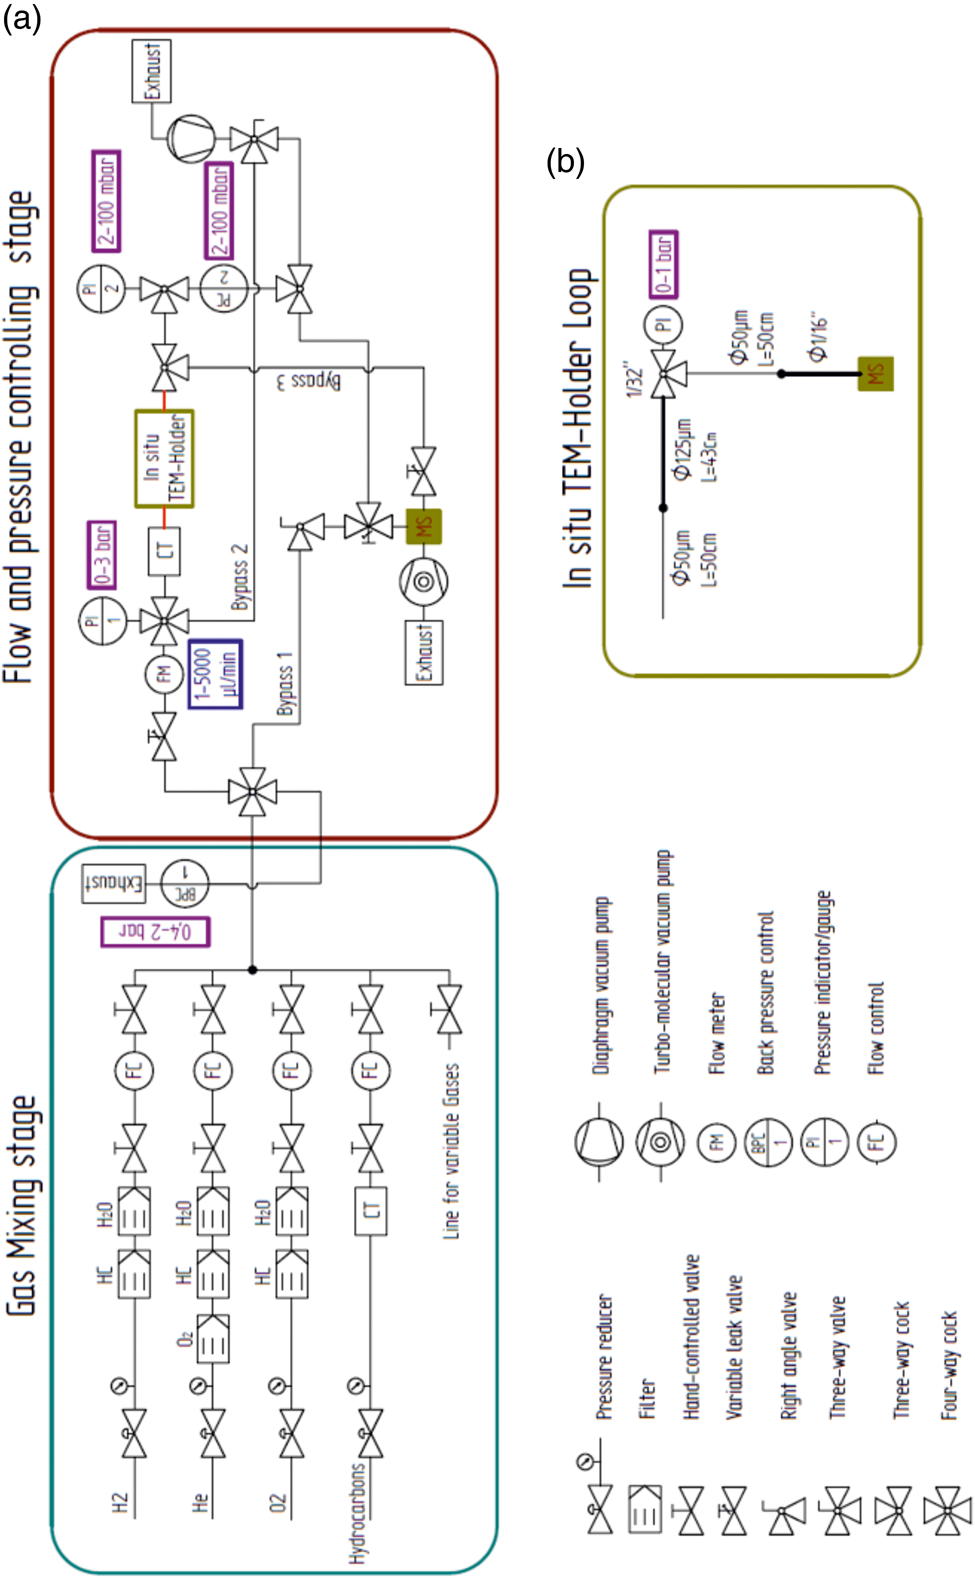
Fig. 1. Schematic diagram of the gas feeding and analysis system for operando TEM. (a) Schematic shows the gas mixing and flow stage and the pressure controlling stage, which is coupled to a QMS. (b) Loop of capillaries that simulate the gas flow and pressure drop through the gas cell TEM holder.

Fig. 2. Pressure regulation by the flow and pressure drop through the setup. (a) Photograph of the setup. (b) Linear dependence of the flow on the inlet pressure. (c) Plot showing the inlet pressure versus the measured reactor pressure. The red circle in (a) denotes the position of the carbonyl trap.
All gas lines are connected to one main mixing line where the pressure (up to 2 bar) is regulated by a back-pressure controller (BPC). The flow in the main line is always set to 100 mL/min in order to increase the speed of gas exchange through the system. In addition, the BPC separates the two parts of the setup. The system past the BPC is dedicated to control the flow and pressure inside the gas cell TEM holder and is coupled to the QMS. The flow and pressure control system consists of one main line and three bypass lines. The gas flow is controlled by a high-precision manual leak valve with a large operation window of 1 µL/min to 5 mL/min (with a precision step of 1 µL). The flow is monitored by a high-precision flow meter (Bronkhorst). The inlet pressure can be adjusted by the velocity of the gas flow or the inlet diameter of the capillary (PEEKsil). In addition to the moveable gas feeding stage on the room wall, the use of flexible PEEKsil tubes with a small inner diameter reduces the vibrations inside the gas cell TEM holder during image acquisition. Due to the small volume of the reaction zone inside the nanoreactor [≈ 0.4 nL at room temperature (RT)], a low gas flow of a few μL/min is needed, while simultaneously the reaction pressure has to be kept as high as possible. This is also assured by the use of small diameter PEEKsil tubes combined with manual high-precision leak valves.
For the experiments where CO is used, a homebuilt carbonyl trap (Swagelok inert tube: ¼ inch diameter; filled with silicon carbide; operation temperature: 220°C) is also connected to the setup before the inlet capillary (PEEKsil) of the holder to ensure that Ni- and Fe-carbonyl-free gas is fed through the TEM nanoreactor (Figs. 2a (red circle), 3) (Masliuk et al., Reference Masliuk, Swoboda, Algara-Siller, Schlögl and Lunkenbein2018). The positioning of the carbonyl trap is crucial, as the CO gas can contaminate the reaction feed with volatile carbonyls, which form readily at RT. Volatile Fe, Ni-carbonyls decompose inside the reactor at elevated temperatures and cause poisoning of the catalyst. The positioning of the carbonyl trap directly after the pressure reducer of the CO gas bottle proved to be an insufficient solution, as it still resulted in the formation of Ni contamination on the catalyst.
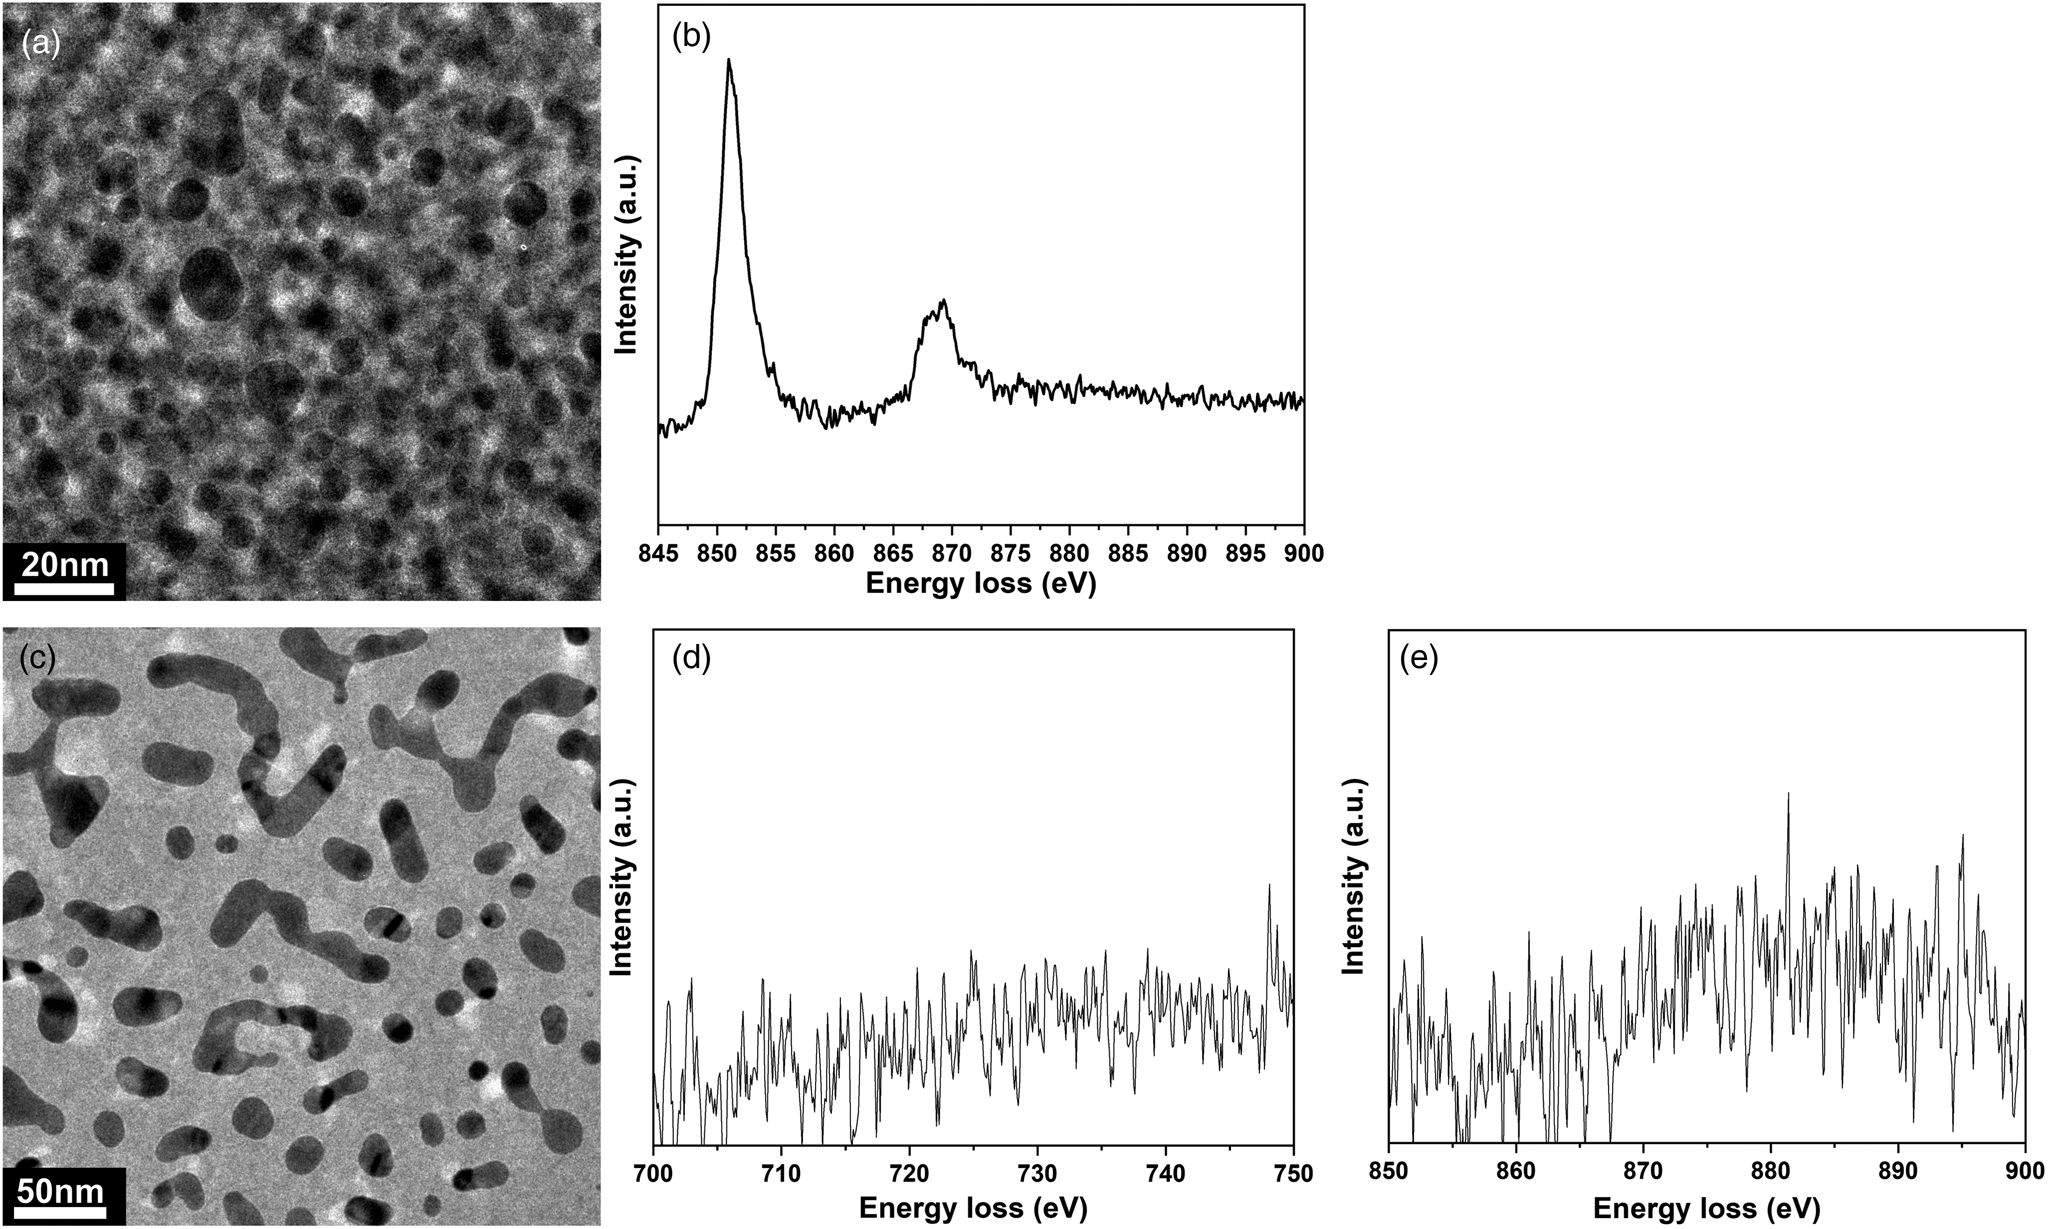
Fig. 3. Investigation of possible carbonyl contamination of the catalyst after CO oxidation. (a) TEM micrograph of the area where the electron energy loss (EEL) spectra were acquired after CO oxidation conducted without carbonyl trap attached to the inlet tube side of the gas cell TEM holder (pressure: 460 mbar, gas feed: CO:O2:He = 1:5:19, flow rate: 20 µL/min, temperature: 200°C). (b) Corresponding core-loss EEL spectra for the Ni-L2,3 edge after the reaction (pressure: 460 mbar, gas feed CO:O2:He = 1:5:19, flow rate 20 µL/min, temperature: 200°C). (c) TEM micrograph of the area where EEL spectra were acquired after CO oxidation conducted with the carbonyl trap attached to the inlet tube line of the gas cell TEM holder (pressure: 700 mbar, gas feed CO:O2:He = 1:5:19, flow rate 20 µL/min, temperature: 200°C). (d,e) Corresponding core-loss EEL spectra of Fe-L2,3 and Ni-L2,3 edges, respectively.
The pressure in the nanoreactor was measured by designing a spatial loop system which simulates the flow through the gas cell TEM holder by placing a T-element connected between the outlet capillary of the holder and the pressure meter (Fig. 1b). The two capillaries were connected in the same manner as in the combination of the DENSsolution holder and PEEKsil capillaries. A T-element and a pressure meter were placed between the connection of the inlet and outlet capillaries to measure any pressure drop inside the capillaries (inner diameter: 50 and 125 µm) which are connected to the MEMS nanoreactor (Fig. 1b). Capillaries with an inner diameter of 125 µm were used to simulate the inlet and outlet tubes through the DENSsolutions holder. The pressure drop inside the nanoreactor, compared to the total pressure drop in the system, thus becomes negligible due to the very short length and geometry of the nanoreactor. For an inlet pressure of 1,000 mbar and an outlet pressure <1 mbar, the pressure in the nanoreactor was found to be 710 mbar. These measurements are in good agreement with calculations provided elsewhere (Niu et al., Reference Niu, Liu, Wang, Zhou, Lv, Zhang, Shi, Li, Zhang, Su and Zhang2019). To confirm the laminar gas flow through the system, the inlet pressure versus flow rate and the inlet pressure versus reactor pressure were measured. It was found that there is a linear relation between inlet pressure versus flow rate and reactor pressure (Figs. 2b, 2c).
Furthermore, the outlet line is split by a T-element into two lines. The first line directly enters the QMS. The direct attachment of the line to the QMS reduces the delay time of the gas analysis. The second line is connected to a pressure controller and a pressure indicator. For our experiments, the pressure controller of the outlet line (0–100 mbar) was set to zero in order to have the fastest possible response. In contrast to standard commercially available in situ TEM gas systems, in our system, all of the gas that leaves the TEM holder passes to the QMS. This significantly increases the sensitivity for the detection of reaction products in our setup. In addition, to obtain fast pumping of the inlet and outlet lines to realize a fast gas exchange inside the gas lines and the nanoreactor, three bypass lines were installed. These lines allow gas exchange in the order of several minutes. Moreover, the residual base pressure in the QMS is kept below 5 × 10⁻⁹ mbar, which again increases the sensitivity of the QMS, allowing for monitoring of reaction products even at low conversions. This feature is important due to the low amount of catalyst (<1 µg) that can be deposited on the MEMS chip and the comparably large volume of the nanoreactor itself (Masliuk et al., Reference Masliuk, Swoboda, Algara-Siller, Schlögl and Lunkenbein2018).
Operando Functionality of the Setup
In Situ Preparation of Pt NPs
The homebuilt gas feed system can be directly connected to commercially available MEMS-based gas cell TEM holders. Figures 3 and 4 demonstrate that a variety of different spatially resolved information, such as electron energy loss spectroscopy (EELS) (Fig. 3), low (Fig. 4a) and high (Figs. 4b, 5a) resolution imaging, or electron diffraction (Fig. 4c) are routinely possible and that the addition of the homebuilt gas feed and analysis setup to the TEM does not limit the resolution. It should be noted that the spatial resolution is similar to previous reports that have investigated different catalytic systems in situ (Kooyman et al., Reference Kooyman, Hensen, de Jong, Niemantsverdriet and van Veen2001; Hansen et al., Reference Hansen, Wagner, Helveg, Rostrup-Nielsen, Clausen and Topsøe2002; Allard et al., Reference Allard, Overbury, Bigelow, Katz, Nackashi and Damiano2012; Bremmer et al., Reference Bremmer, Zacharaki, Sjåstad, Navarro, Frenken and Kooyman2017; Zou et al., Reference Zou, Li, Zakharov, Stach and Zhou2017; Dembele et al., Reference Dembele, Moldovan, Hirlimann, Harmel, Soulantica, Serp, Chaudret, Gay, Maury, Berliet, Fecant and Ersen2018; Roiban et al., Reference Roiban, Li, Aouine, Tuel, Farrusseng and Epicier2018; Altantzis et al., Reference Altantzis, Lobato, De Backer, Béché, Zhang, Basak, Porcu, Xu, Sánchez-Iglesias, Liz-Marzán, Van Tendeloo, Van Aert and Bals2019; De Vrieze et al., Reference De Vrieze, Bremmer, Aly, Navarro, Thybaut, Kooyman and Saeys2019; Tan et al., Reference Tan, Chee, Baraissov, Jin, Tan and Mirsaidov2019). In a first attempt, imaging and diffraction were tested during the in situ synthesis of Pt NPs. We studied the formation of Pt NPs inside the MEMS-based nanoreactor through the decomposition of the tetraammineplatinum (II) nitrate precursors in synthetic air (pressure: 720 mbar, gas feed: O2:He = 1:4; flow rate: 20 µL/min) at 400°C for 3 h with a temperature ramp of 5°C/min. The decomposition of the precursor was monitored by TEM and SAED in order to obtain phase-pure Pt NPs (Figs. 4a–4c). After this treatment, and cooling to 200°C, TEM imaging and SAED confirmed the presence of phase-pure crystalline Pt NPs (Fig. 4). The resulting mix of NPs exhibited a broad size distribution, ranging from a few to several hundreds of nanometers (Fig. 4a). In addition, TEM imaging revealed a high signal-to-noise ratio, even at beam dose rates below 30 e/Å2s. The achievable resolution was found to be sufficient to extract morphological changes in the NPs.

Fig. 4. TEM imaging and electron diffraction analysis of Pt NPs from in situ synthesis. (a) Overview, (b) high-resolution TEM (HRTEM) images and (c) SAED of decomposed Pt NPs in a flowing atmosphere of synthetic air (pressure: 720 mbar, gas feed: O2:He = 1:4, flow rate: 20 µL/min, temperature: 200°C).

Fig. 5. Proof of conversion in CO oxidation over Pt NPs obtained from operando TEM directly coupled to a QMS for gas analysis. (a) HRTEM image of Pt NPs viewed along [0–11] after 25 temperature cycles at 200°C, (b) MS data for CO oxidation over Pt NPs cycled 25 times between RT and 500°C (pressure: 700 mbar, gas feed CO:O2:He = 1:5:19, flow rate: 20 µL/min, heating and cooling ramp: 25°C/min). TEM imaging of the Pt NPs (c) before and (d) after cycling the temperature for 25 times (pressure: 700 mbar, gas feed CO:O2:He = 1:5:19, flow rate: 20 µL/min, temperature: 200°C).
CO Oxidation Over Pt NPs
Next, CO oxidation over the as-synthesized Pt NPs was studied as a model reaction to test the operando functionality of our system. The study was conducted using a constant gas feed of CO2:O2:He = 1:5:19, a flow rate of 20 µL/min and a heating and cooling ramp of 25°C/min from RT to 500°C continuously over 25 cycles. A high-resolution image of a faceted Pt NP mainly terminated by low index {111} and {100} surfaces, thathave formed during the cycling experiment, is presented in Figure 5a. The QMS data (Fig. 5b) indicate that during temperature cycling, the increase of CO2 is always correlated with a decrease of the signals attributed to CO and O2 and vice versa. In general, the reaction started at around 320°C, as indicated by an increase of the CO2 signal in the QMS (Fig. 6). At 426°C, the reaction ignited as indicated by the sharp increase of the CO2 signal (Fig. 6). In the temperature regime between 450 and 500°C, the reaction stabilized (Fig. 6). TEM imaging of the sample before and after the temperature cycling experiment are shown in Figures 5c–5d, respectively, indicating particle faceting (see also Fig. 5a) and reshaping under well-defined working conditions. Detailed analysis of the structure and morphology of Pt NPs under the working conditions that were extracted with this setup have been published elsewhere (Plodinec et al., Reference Plodinec, Nerl, Girgsdies, Schlögl and Lunkenbein2020). Blank experiments using only the MEMS-based gas cell TEM holder showed no CO conversion at temperatures up to 500°C, proving that the gas cell TEM holder and the gas phase itself were not causing any conversion during real catalytic reaction.
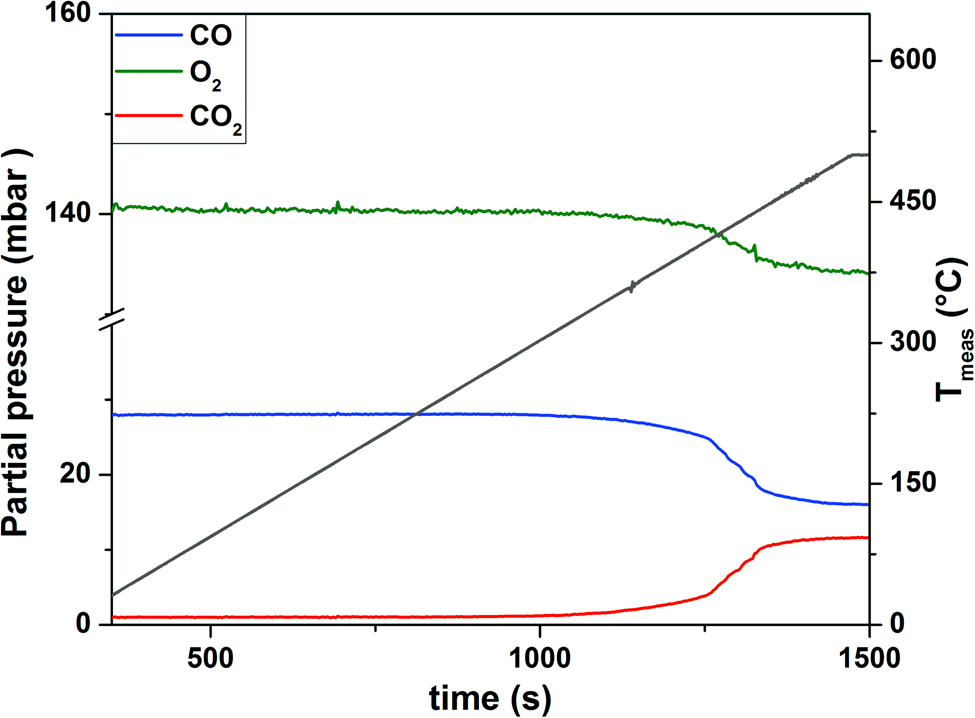
Fig. 6. QMS data recorded during the initiation of the first temperature cycle (pressure: 700 mbar, gas feed: CO:O2:He = 1:5:19, flow rate: 20 µL/min, heating ramp: 25°C/min).
Delay Time of the Mass Spectrometer
The delay time of the MS in the homebuilt gas feed and analysis system was also tested using the model reaction of CO oxidation over Pt NPs under dynamic reaction conditions at different flow rates, pressures and temperatures.
Due to diffusional processes of the gases when moving from the nanoreactor to the MS, the gas detection of the QMS is slightly delayed, which is unavoidable. Thus, TEM imaging has to be synchronized with the delay time of the QMS. This delay can be controlled and steps we undertook to do this are described below. The QMS delay time was determined by measuring the temporal evolution of the CO2 signal during fast heating and cooling cycles (temperature ramp: 1000°C/s) in the temperature regime between 400°C and 1000°C (at 20 mbar and a constant gas flow rate of 2 µL/min). The temporally resolved QMS and temperature responses are shown in Figures 7a and 7b. The QMS delay time was found to be 18 s. In addition to the comparably fast response of the QMS at a very low flow rate, it was also found that the thermal resistivity of the MEMS-based nanoreactors is very high.
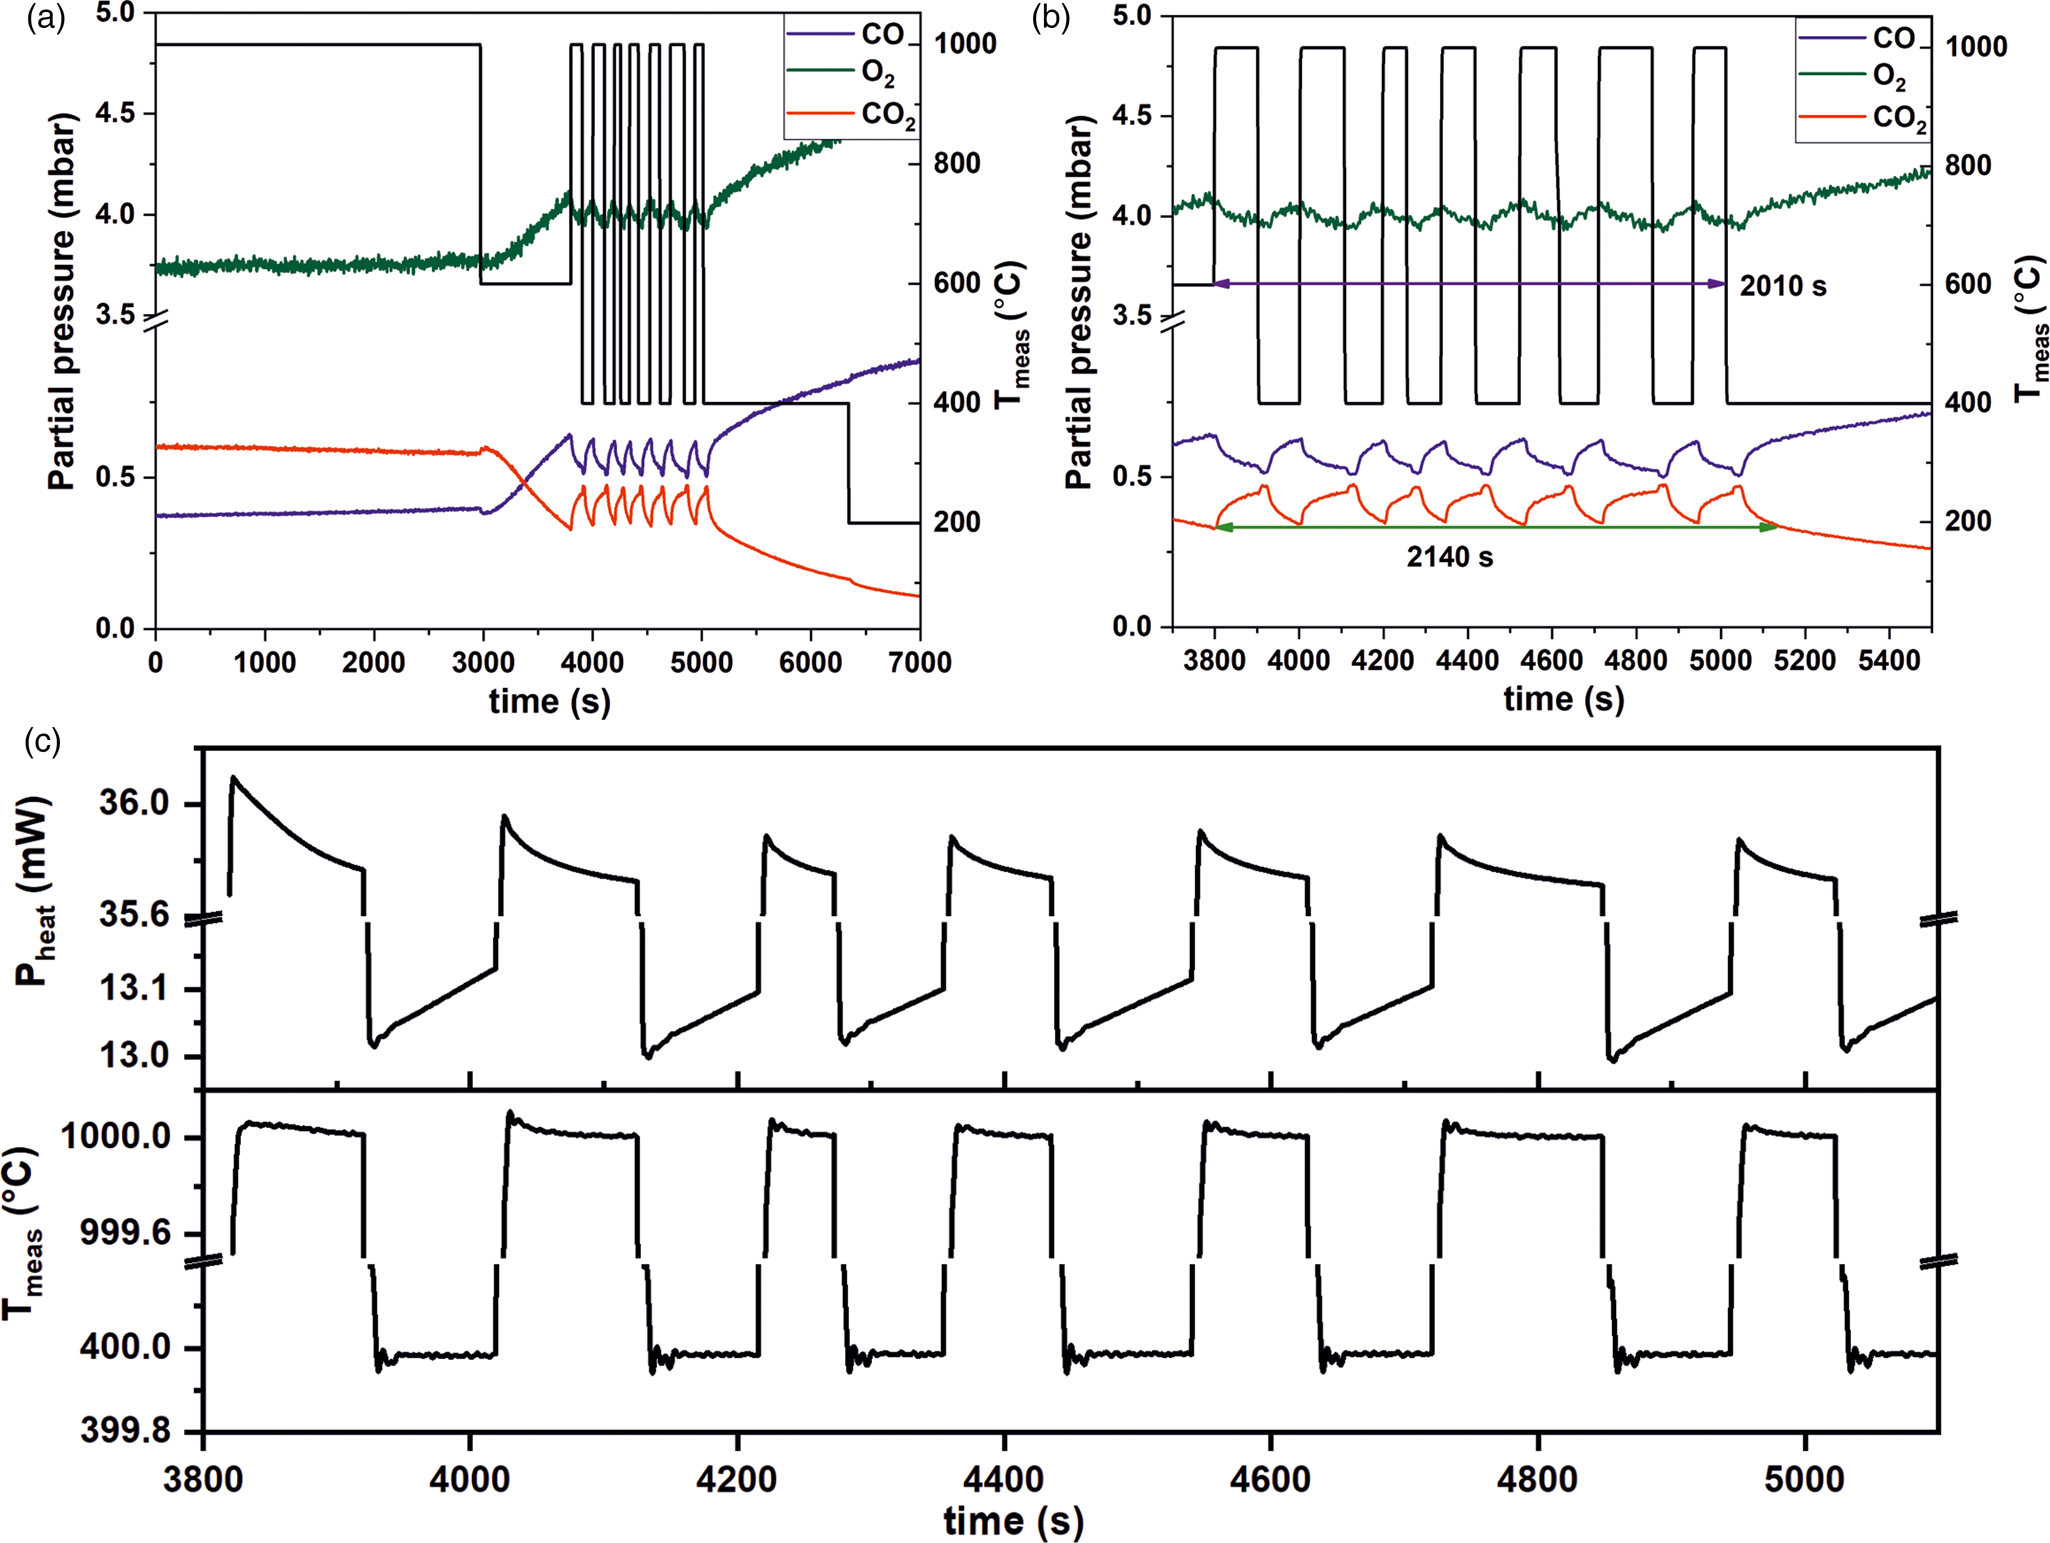
Fig. 7. Short delay time of the QMS. (a) The delay time of MS was measured by cycling the temperature between 400 and 1,000°C. (b) Magnified from the plot shown in (a) of time between 3,700 and 5,500 s. (pressure: 20 mbar, gas feed: CO:O2:He = 1:5:19, flow rate: 2 µL/min). At this flow rate, the QMS response was found to be 18 s in our setup. (c) Correlation between heating power (top) and temperature (bottom) over time.
Furthermore, the heating power could also be correlated to the temperature and to the reactivity as shown in Figure 7c, giving rise to calorimetric information. This correlation is due to the fact that when less heat is released from the reaction, this has to be compensated for by an increase in the heating power to maintain the target temperature and vice versa. As can be seen during temperature cycling between 400°C and 1,000°C, the power signal oscillates with the temperature (Fig. 7c). In addition, at 400°C, the power needed to maintain this temperature was found to increase constantly. This observation correlated with a steady decrease in the catalytic activity at 400°C (Fig. 7b). This was found to change at 1,000°C, where the power signals decreased (Fig. 7c). Simultaneously the CO2 production increased (Fig. 7b). The exothermicity of the reaction led to heat production, which resulted in less power being used by the setup to maintain the target temperature.
Discussion
In this report we have given the detailed technical description and have shown the capabilities of our homebuilt gas feeding and gas analysis setup using in situ synthesis of Pt NPs and CO oxidation over Pt NPs. In addition to the compatibility with commercial gas cell TEM holders, our homebuilt setup proves to be versatile and modular, important for studying a range of different reactions. The special characteristics of our setup include the use of precise needle leak valve leading to more accurate control of the gas flow and low flow rates resulting in an increased residence time. Due to the lower base pressure of residual gases in the detection region, the sensitivity of the attached QMS is also enhanced. Furthermore, the setup is operational in a large parameter field including pressure (20–1,000 mbar, limited by the MEMS-based cells), flow rates (1 µL/min to 5 mL/min) and gas feeds, making the setup versatile and flexible for investigating a huge variety of reactions.
A notable difference compared to findings from fixed-bed reactor studies (Boubnov et al., Reference Boubnov, Gänzler, Conrad, Casapu and Grunwaldt2013; Gänzler et al., Reference Gänzler, Casapu, Boubnov, Müller, Conrad, Lichtenberg, Frahm and Grunwaldt2015) was the onset temperature of the reaction that was found to be higher (Figs. 5, 6) in our study. However, increased onset temperatures have been previously reported for other MEMS-based systems (Vendelbo et al., Reference Vendelbo, Elkjær, Falsig, Puspitasari, Dona, Mele, Morana, Nelissen, van Rijn, Creemer, Kooyman and Helveg2014), as well as for quasi in situ TEM studies (Masliuk et al., Reference Masliuk, Swoboda, Algara-Siller, Schlögl and Lunkenbein2018). The short residence time of the gas mixture in the reaction zone (~1.3 ms) or the low total amount of catalyst (<1 µg) that can be deposited on MEMS chips could be the cause. However, we propose that the high dispersion of the sample and comparably high gas space velocities are the biggest contributing factors. Contrary to Pt NPs in traditional fixed-bed reactors, the investigated Pt NPs on MEMS-based systems or on TEM windows are highly dispersed and are often not in physical contact with each other. The complete heat exchange in such systems results in an increased onset temperature of the reaction compared to fixed-bed reactors, where hot spot formation and local overheating reduce the integral value of the onset temperature. Thus, for a detailed comparison, macroscopic reactors with similar design to the MEMS-based nanoreactor geometry have to be developed to bridge the gap to the fixed-bed reactors. Further studies to probe the limits of this setup could be done in the future by systematically varying the QMS residual base pressure, mass of the catalyst, gas flow, and volume of the reactor to improve our understanding of the kinetics that underlie the current reactor design of gas cell TEM holders.
However, as illustrated in Scheme 1, the temporal resolution of operando TEM is not yet sufficient to visualize active sites at the atomic level or catalytic cycles, which is in line with recent reports on heterogeneous catalysis (Schlögl, Reference Schlögl2015; Kalz et al., Reference Kalz, Kraehnert, Dvoyashkin, Dittmeyer, Glaser, Krewer, Reuter and Grunwaldt2017). Even the use of new ultrafast cameras would not allow a temporal resolution below approximately 50 µs (MerlinEM direct electron detector camera in a binary mode). This temporal resolution is still two orders of magnitude higher compared to the needed temporal resolution. Nevertheless, new pixelated detectors or complementary metal-oxide semiconductor (CMOS) cameras have sufficient temporal resolution to evidence regions of the sample, which may be considered as active during a catalytic reaction, and can be resolved even at atomic resolution with snapshots of a fraction of second. However, caution has to be taken to deconvolve reaction and beam-induced changes, in particular, at the surface and with atomic resolution. Although some TEM studies may have pinpointed the active sites of catalysts, for example on metal NPs, the majority of these studies were performed ex situ, i.e. in a state where the metastable active sites could have already been deformed or vanished (Chang et al., Reference Chang, Barnard, Gontard and Dunin-Borkowski2010; Back et al., Reference Back, Yeom and Jung2015; Kudernatsch et al., Reference Kudernatsch, Peng, Zeuthen, Bai, Merte, Lammich, Besenbacher, Mavrikakis and Wendt2015; Wang et al., Reference Wang, Mei, Glezakou, Li and Rousseau2015). Operando measurements can only be obtained in the regime, in which the temporal resolution of TEM and MS overlap (Scheme 1) which suggests that there is a need to not only develop faster cameras, but also faster and more sensitive mass spectrometers.
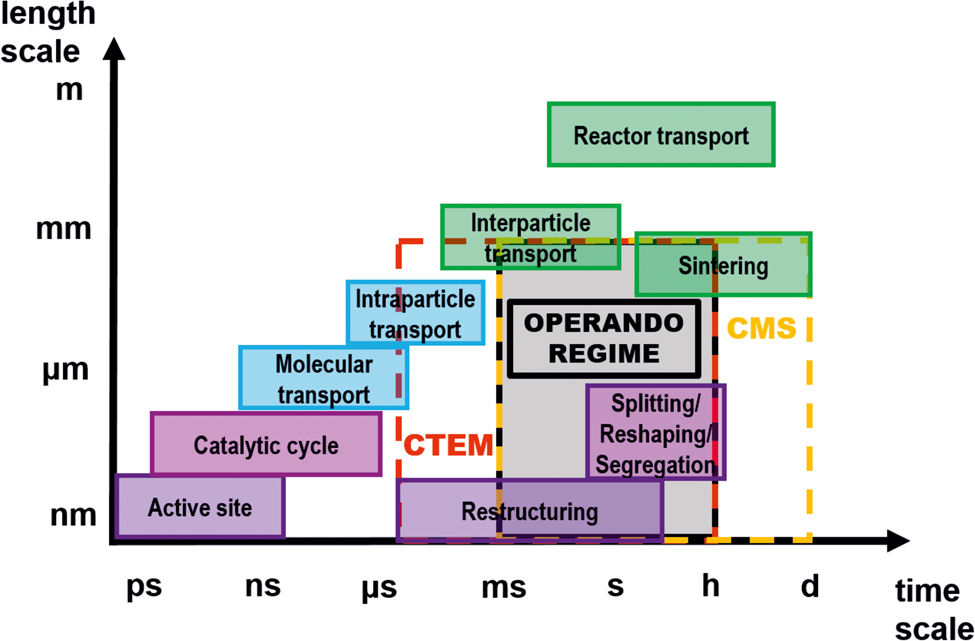
Scheme 1. Space-time scale of different dynamic processes occurring in catalysis. It is possible to capture processes in specific space and time scale ranges using the applied techniques: conventional TEM (CTEM, red dashed box) and conventional mass spectrometry (CMS, yellow dashed box). Only in the intersection of CTEM and CMS, operando measurements are possible (grey box) [modified from ref. Kalz et al. (Reference Kalz, Kraehnert, Dvoyashkin, Dittmeyer, Glaser, Krewer, Reuter and Grunwaldt2017)].
Even though the direct observation of active sites by operando TEM remains a challenging goal, more macroscopic changes of NPs (e.g. splitting, restructuring or reshaping) and correlation of these changes to regimes of low or high activity are already accessible using our setup (Plodinec et al. Reference Plodinec, Nerl, Girgsdies, Schlögl and Lunkenbein2020).
Conclusion
To conclude, we have shown that our homebuilt setup can be used to study catalysts at industrial relevant working conditions, including different gas environments, temperatures and pressures and over time by combining traditional TEM techniques with MS data. Due to the detailed description of the gas feed and analysis system, it can be easily reproduced. The modular and versatile nature of the setup allows for screening a vast parameter range, including a large temperature and pressure range. It further allows applying a large variety of gas feeds for studying a whole range of different reactions. To prove the functionality of the homebuilt gas feed and analysis system for operando TEM, CO oxidation over Pt NPs has been chosen. The use of operando TEM will provide unprecedented insights into temporally resolved structural and morphological aspects of catalysts at high resolution.


 Open access