


Introduction
Obsidian is an amorphous volcanic mineraloid of variable composition that forms when viscous magma of high silicon content cools rapidly before the development of a crystal structure (Jerram & Petford, Reference Jerram and Petford2011). During the process of cooling, undercooling produces a variety of crystallites, including nanolites, which are nanoscopic euhedral crystals embedded within the amorphous matrix. Nanolites have gone understudied despite recent evidence of their effect on volcanic eruptions (Cáceres et al., Reference Cáceres, Wadsworth, Scheu, Colombier, Madonna, Cimarelli, Hess, Kaliwoda, Ruthensteiner and Dingwell2020). While crystallites are estimated to compose only 2% of obsidian's volume, they provide insight on the kinetics and thermodynamics of eruption and emplacement of the melt (Befus et al., Reference Befus, Manga, Gardner and Williams2015; Manga et al., Reference Manga, Voltolini and Wenk2018). The geologic utility of microlite (micron-scale crystallite) characterization has been proven through studies relating microlite crystallographic orientations to the flow direction of the matrix (Manga et al., Reference Manga, Voltolini and Wenk2018), correlating bulk obsidian color to microlite compositions (Camargo et al., Reference Camargo, Menon, Luhrs and Mariella2016) and approximations of the cooling rate based on the size and spacing of host-grown microlites (Bowen, Reference Bowen1956; Sano & Toramaru, Reference Sano and Toramaru2017). Previous microlite studies include the characterization of crystallites that are microns in size or larger and rely on x-ray diffraction (XRD) and scanning electron microscope (SEM) characterization (Manga et al., Reference Manga, Voltolini and Wenk2018). The few transmission electron microscopy (TEM) studies of obsidian record nanolite geometries and diffraction patterns or use powdered samples for averaged elemental analyses (Camargo et al., Reference Camargo, Menon, Luhrs and Mariella2016). While nanolites are believed to provide similar information as microlites on their formational environment, their presence has also been linked to gaseous bubble nucleation and viscosity, increase within volcanic melt, suggesting that nanolites partially govern the degree of explosivity of rhyolitic volcanic eruptions (Cáceres et al., Reference Cáceres, Wadsworth, Scheu, Colombier, Madonna, Cimarelli, Hess, Kaliwoda, Ruthensteiner and Dingwell2020; Di Genova et al., Reference Di Genova, Brooker, Mader, Drewitt, Longo, Deubener, Neuville, Fanara, Shebanova, Anzellini, Arzilli, Bamber, Hennet, La Spina and Miyajima2020).
This work focuses on the amorphous matrix of the obsidian in the vicinity of nanolites. The amorphous matrix is comprised mainly of amorphous SiO2 (a-SiO2) and oxides of Al, Ti, Fe, Ca, Na, K, Mg, and Mn (Jambon & Carron, Reference Jambon and Carron1976; Sano & Toramaru, Reference Sano and Toramaru2017). A host of other elements are also typically present in trace quantities. The nanolites vary in type, but are compositionally distinct from their host matrix. While a handful of nanolite types were identified, Fe-oxide nanolites on the order of tens to hundreds of nanometers in length were selected for this research because they were the most prevalent, displayed clear boundaries with the amorphous matrix, and were surrounded by the most discernible variations in elemental composition. The presence of Fe-oxide nanolites is found to influence local elemental concentrations in the matrix. To discern changes in the composition and average of atomic bond lengths at the nanolite-matrix interface, we performed energy-dispersive x-ray spectroscopy (EDS) mapping on regions containing Fe-oxide nanolites and amorphous matrix and collected parallel beam diffraction data for RDF analysis from the same regions. The presence of Fe-oxide nanolites is related to changes in the local composition of the amorphous matrix and consequent changes in mean nearest-neighbor bond lengths.
Materials and Methods
All samples in this study were produced from a single piece of obsidian sourced from the Warner Mountains in northern California. Using a copper percussive bopper, samples were prepared by knapping, a technique to shape and thin conchoidally fracturing materials that is seldom applied to TEM samples, but well used throughout human history for tool making (Flenniken, Reference Flenniken1984). Knapping enables the analysis of thin regions containing nanometer-scale nanolites embedded in the matrix without requiring the obsidian be powdered or introducing pitting and dislodging embedded nanolites as is common with polishing techniques. Flat millimeter-scale flakes with sharp, thin edges were produced, as shown in Figure 1a. The edges are optically transparent and strain ridges resulting from conchoidal fracture are indicators of fracture orientation. Flakes of 1–2 mm in length were adhered to copper TEM grids with their distal edges centered. Polishing the obsidian dislodged nanolites, incurred contamination, and destroyed thin edges, so no further thinning was performed after knapping.
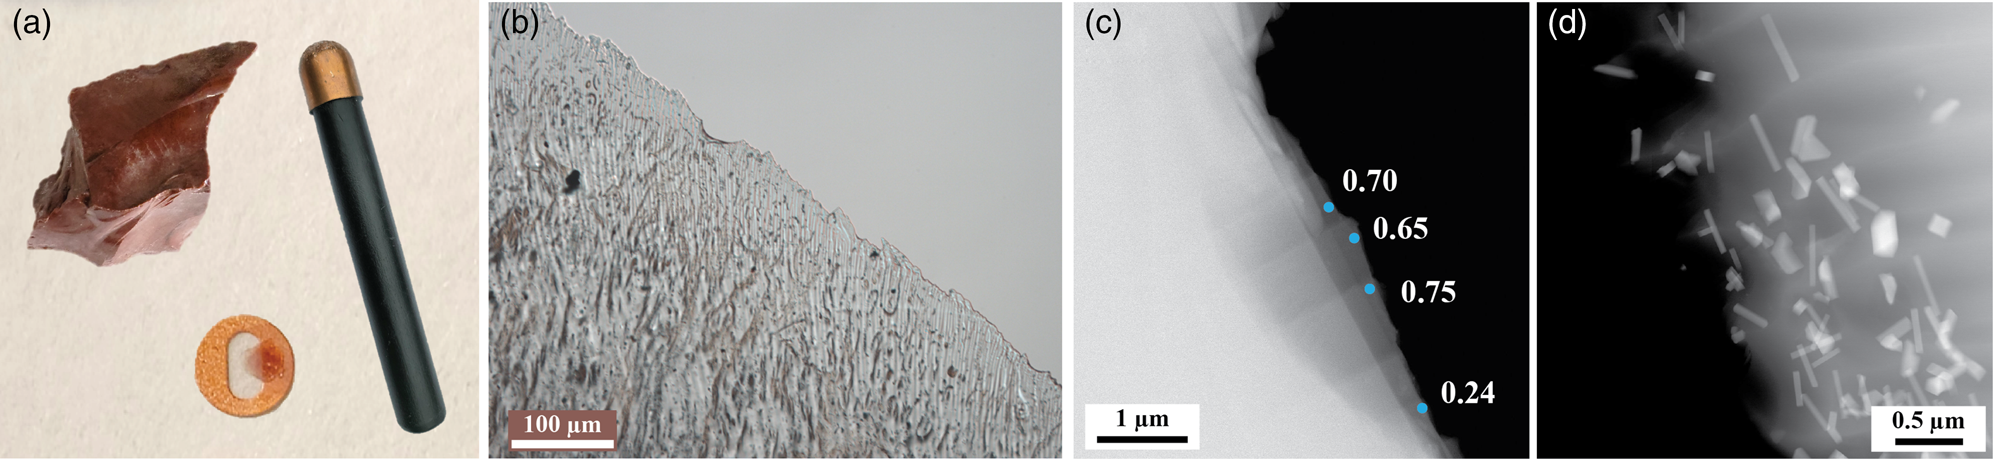
Fig. 1. (a) Bulk obsidian from which the samples were fractured and the copper bopper that was used along with a sample thin sharp adhered to a 3-mm diameter TEM grid (items not to scale). (b) A light microscope image showing the thin edge of a knapped sample and microlites embedded in the amorphous matrix. (c) STEM image of obsidian edge with measured EELS t/λ values. Thin regions with similar compression ripples were observed in most samples. (d) STEM image showing a band of Fe-oxide nanolites near a thin edge of the obsidian. The nanolites were often observed in bands and the ones closest to the thin edges were selected for EDS and diffraction analysis.
The thickness of knapped obsidian samples was measured using EELS on an FEI Tecnai operated at 200 kV with a 150 μm C2 aperture, a 42 mm camera length, and a 2.5 mm entrance aperture. For the purpose of thickness estimates, the obsidian was modeled as a-SiO2 with a mean free inelastic scattering path, λ, of 150 nm for an acceleration voltage of 200 kV (Lee et al., Reference Lee, Ikematsu and Shindo2002). EELS measurements indicate that the thinnest edge regions were between t/λ values of 0.24 and 0.75, equating to edge thicknesses varying between approximately 40 and 110 nm (Fig. 1). The nanolites shown in Figures 2 and 3 were located in slightly thicker regions of the sample, where compositional variations could be observed in the matrix and high-quality diffraction patterns could be obtained. While there are methods that can be used to produce thinner areas, these would likely alter the characteristics of the matrix–nanolite interfaces. Knapping therefore uniquely provided the opportunity to study the interface between nanolites and the surrounding amorphous matrix.

Fig. 2. EDS maps from two Fe-oxide nanolites with select elements exhibiting compositional variation. The matrix is composed mainly of a-SiO2. The Si concentration remains approximately constant or slightly increases approaching the nanolites. The cation concentrations are diminished adjacent to the nanolites compared to the bulk matrix. (a) Nanolite A: a Fe-oxide nanolite is shown with K depletion and Na variation. (b) Nanolite B: the top-most Fe-oxide nanolite exhibits K and Al depletion at its tip. EDS maps of additional elements are included in the Supplementary Material.

Fig. 3. (a,b) RDF curves from the diffraction images collected from the positions approaching the nanolites in (c) and (d), respectively. (e,f) RDF curves from the diffraction images collected from the positions moving away from the nanolites in (c) and (d), respectively. The curves are vertically offset, so that the peaks are more easily distinguishable. The size of the circles in (c) and (d) corresponds to the center of the diffraction probe position. Nearest atomic neighbor distances are smaller near the nanolites compared to the bulk.
EDS maps were collected from regions with nanolites embedded in the matrix to identify Fe-oxide nanolites and regions of Si-enrichment and relative cation depletion surrounding them. Na, Ca, K, and Al were included in the maps because they showed the most distinct compositional variation. EDS maps were collected on a FEI TitanX operated at 200 kV with a 70 μm C2 aperture resulting in a 10 mrad convergence angle. The TitanX is equipped with highly sensitive quad SuperX detectors with an 18° take off angle and 45° azimuthal angle, allowing for shorter acquisition times to mitigate possible beam damage. Beam damage was only noted in the spot where the beam was parked, but not over the entirety of the mapped regions. The spot damage is visible in Figure 2 at the left side of the Nanolite A EDS image. Otherwise, the nanolites and the matrix appeared unchanged after 15-min EDS acquisition. Screen current and dosage were 0.34 nA and 0.44 e/A2s, respectively. Nanolite and matrix composition measurements were made by selecting small regions containing only nanolite, Si-enriched matrix, or bulk matrix in the Bruker Quantax software.
Parallel beam electron diffraction data were collected across the nanolites and neighboring bulk matrix. Data were collected using an FEI TitanX operated at 200 kV using a 70 μm C2 aperture and a 10 μm SAD aperture, illuminating an approximately 150-nm diameter area. All diffraction patterns were collected with a 245 mm camera length and a 0.4 s exposure time. For the two nanolites shown in Figures 2 and 3, data collection started from the amorphous matrix on one side of a nanolite and moved perpendicularly across the nanolite to the amorphous matrix on the other side with an approximately 50-nm step size, such that there was overlap between the beam positions. We refer to the nanolite in Figure 2a as Nanolite A in Matrix region A and the nanolite in Figure 2b as Nanolite B in Matrix region B. The Supplementary Material includes more EDS scans from the nanolites in Figure 2 and another Fe-oxide nanolite data set that shows diffraction data collected from a region of pure matrix, at the nanolite°matrix interface, and at an area with smaller nanolites.
Radial distribution function (RDF) analysis was performed to characterize the distribution of distances between atomic neighbors as a measure of short-range ordering in the obsidian (Cockayane, Reference Cockayne2007). The first, second, and third peaks calculated in RDF analysis correspond to the first, second, and third mean nearest atomic neighbor distances (Srolovitz et al., Reference Srolovitz, Egami and Vitek1981). Diffraction data were analyzed using the py4DSTEM RDF script (Savitzky et al., Reference Savitzky, Zeltmann, Hughes, Brown, Zhao, Pelz, Pekin, Barnard, Donohue, DaCosta, Kennedy, Xie, Janish, Schneider, Herring, Gopal, Anapolsky, Dhall, Bustillo, Ercius, Scott, Ciston, Minor and Ophus2021). Briefly, preprocessing steps included removal of the center beam stop and center beam intensity as well as elliptical distortion correction. For regions including diffraction information from both the matrix and the nanolites, Bragg peaks were excluded by using median statistics. Using median statistics is simpler than manually removing Bragg peak intensity from the patterns and did not change the results. To retrieve the structure factors, intensity profiles were normalized by single-atom scattering factors which were calculated using the parameterization in Lobato & Van Dyck (Reference Lobato and Van Dyck2014). The entirety of the radially integrated intensity profile, including high scattering angles, was included in the analysis and fitting of the single-atom scattering factors. After the radial intensity profiles were normalized, a masking function was applied to the structure factors to smooth out any incomplete tails in the structure factors. The masking function was applied uniformly throughout each data set. The single-atom scattering factor is calculated based on the major elements found in the EDS data; elements present in quantities below 1 wt% are excluded. The calculated single-atom scattering factors were constant for diffraction patterns collected across a given nanolite but varied between nanolites. Finally, the RDF was calculated by taking the discrete sine transform of the structure factor.
The accuracy of the RDFs are limited by the fitting protocol. Specifically, the largest source of error is introduced in the single-atom scattering background fit of the radial intensity profile. Therefore, to measure error in the fitted RDF peak positions, the +σ and −σ values of the background fit were computed and applied to the intensity profile. The shift in peak location between the two background fits was recorded as the error and is discussed in greater detail in the Supplementary Material. All diffraction data were collected with identical microscope configurations, and a uniform analytical procedure was applied to minimize the systematic error between RDF measurements.
Results
Elemental mapping identified variations in the composition of the amorphous matrix adjacent to many Fe-oxide nanolites. Specifically, Na, K, Ca, and Al cations exhibit depletion in the vicinity of the nanolites, producing a Si-enriched region around the nanolites. The width of the depletion regions varied between nanolites, but generally fall between 40 and 150 nm. EDS measurements showed that the composition of the amorphous obsidian matrix in the vicinity of Fe-oxide nanolites is not identical to the bulk composition. Figure 4 is an example of a cluster of nanolites with adjacent cation depletion and Si-enrichment. The nanolite and bulk amorphous matrix compositions from the EDS maps shown in Figure 2 are summarized in Table 1. Representative raw spectra are included in the Supplementary Material. Trace amounts of other elements (all less than 1 wt%) accounting for the remaining wt%. Of the Fe-oxide nanolites observed, the majority have similar compositions as the two presented in Figure 2. Nanolite compositions are from spot measurements centered on the nanolites. The detected Si, Al, and O in the nanolite regions is partially attributable to the matrix and not the nanolite. The matrix composition varies across the bulk obsidian but is distinguishable from that of the nanolites primarily by an increased concentration of Si, Al, K, and Na and a decrease in Fe and O. While there is a degree of variation in the bulk, it is significantly more gradual and less pronounced than the cation depletion and Si-enrichment observed adjacent to the nanolites. The bulk matrix compositions were determined from spot measurements from regions 75 nm to the left of Nanolite A in Figure 2a and 175 nm to the left of Nanolite B in Figure 2b.

Fig. 4. Cluster of three obsidian nanolites with localized depletion of Na, Ca, K, and Al most evident at the top of the right-most nanolite. The boundaries of the nanolites are imprinted on the EDS maps to highlight that the elemental depletion extends beyond the edge of the nanolite into the amorphous matrix. The width of the depletion region is larger to the left of the nanolite than to the right of the nanolite. A line scan, shown as arrows on the HAADF image, was collected across the nanolite, depletion region, and further from the nanolite in the bulk matrix. The count intensities for Si, Fe, and the depleted elements are shown with a vertical offset as function of distance from the nanolite. The depletion extends beyond the nanolite into the matrix. Si-content slightly increases up to the nanolite–matrix interface, then decreases at the nanolite.
Table 1. Elemental Compositions of the Fe-Oxide Nanolites and Amorphous Bulk From the Regions Shown in Figure 2 with 3σ Error Bounds Determined From Bruker Quantax EDS Software.

Empty cells indicate that less than 1 wt% of the element was detected.
While small clusters of and singular nanolites were observed, the Fe-oxide nanolites were uniquely grouped in bands running across the matrix (Fig. 1). Quartz and feldspar microlites were present in the samples, but Fe-oxide nanolites were the most numerous crystallites. Two Fe-oxide nanolite geometries were identified: (1) a rod-like shape with a width ranging from a few tens of nanometers to about 100 nm and (2) plate-like with similar width and length sizes. The rod-like nanolites were distinguished from plate-like nanolites by tilting the samples, as shown in the Supplementary Material. Nanolite A observed in Figure 2a is an example of the former; examples of the latter are shown in the left-most two nanolites in Figure 4 and in the Supplementary Material. The elemental composition of the obsidian matrix was found to vary between the bulk and the regions directly adjacent to nanolites. Both nanolite geometries exhibited variations in the local matrix.
The amorphous matrix surrounding two nanolites shown in Figures 2 and 3 was selected as representative nanolites for studying the relationship between compositional variation and amorphous atomic structure after surveying the Fe-oxide nanolites in thin edge regions of the amorphous matrix. EDS maps from additional nanolite regions are included in the Supplementary Material. K, Na, Al, and Ca are identified as the elements with most variable concentrations in the matrix near the nanolites. Depletion of these cations and increased Si concentrations are observed surrounding the nanolites as shown in Figure 2a or adjacent to part of the nanolites as shown in Figure 2b. It is also evident in the line scans calculated from EDS mapping data shown in Figure 4.
Variations in the composition of the amorphous matrix were found to correspond to shifts in the atomic nearest-neighbor distance. First, second, and third average interatomic neighbor distances were analyzed, and the second and third nearest-neighbor distances were found to be the most sensitive to compositional changes. RDF plots for each diffraction probe position are shown in Figure 3. Figure 5 shows the second and third RDF peak positions corresponding to mean interatomic distances as a function of distance from the longitudinal axis of the nanolites. The trend between distance from the nanolites and interatomic distances is summarized in Table 1 in the Supplementary Material. In general, the average interatomic distances increase further from the nanolites and away from regions of K, Na, and Ca cation depletion. For all RDF plots, the first peak is located between 1.47 and 1.74 Å, the second peak between 2.63 and 3.01 Å, and the third peak between 3.68 and 4.30 Å. The diffraction pattern collected 25 nm to the right of the nanolite shown in Figure 3c produced an RDF pattern with a second peak location greater than anticipated at 4.30 Å.

Fig. 5. (a,b) Peak positions are plotted as a function of approximate distance from the nanolites from the RDFs in Figure 3 showing the change in an average interatomic distance between second (a,c) and third (b,d) nearest neighbors. Plots (a) and (b) correspond to the data shown in Figures 3a and 3e collected from the nanolite shown in Figure 3c. Plots (c) and (d) correspond to the data shown in Figures 3b and 3f collected from the nanolite shown in Figure 3d. A distance of zero indicates that the diffraction data were collected from the longitudinal axis of the nanolites. Moving perpendicularly from the nanolites’ longitudinal axis to the amorphous matrix, data collected from the left side are considered to have a negative distance from the nanolite and data from the right side are considered to have a positive distance. With the exception of the RDF data from the data collected at a distance 25 nm from the nanolite shown in (b), the second and third nearest atomic neighbor distances increase moving away from the nanolites and their adjacent elemental depletion regions and toward the amorphous matrix.
By collecting parallel beam diffraction and computing the RDF as a function of distance from the nanolite data across the same nanolites for which EDS data are collected, Å-scale shifts in the nearest-neighbor distance are related to the changing localized compositions. From the center of the nanolite in Figure 3c, the second nearest-neighbor distance increases by 0.14 Å 75 nm to the left and by 0.16 Å 75 nm to the right of the nanolite center. The third nearest-neighbor distance increases by 0.08 Å 75 nm to the left and by 0.16 Å 75 nm to the right of the nanolite center, excluding the outlier peak located at 4.30 Å. Showing a similar trend, from the edge of the nanolite in Figure 3c, the second nearest-neighbor distance increases by 0.27 Å 175 nm to the left and by 0.19 Å 175 nm to the right of the nanolite center. The third nearest-neighbor distance increases by 0.35 Å 175 nm to the left and by 0.26 Å 175 nm to the right of the nanolite center. As is evident in Figure 5, the increase in average interatomic distances plateaus around 50–100 nm from the nanolites, corresponding to the edge of the regions with cation depletion. Based on the error calculation described above, errors in the peak position were, for the most part, below the number of reported significant figures. All error values were below 0.05 Å (Supplementary Material).
Discussion
Bands of hundreds of Fe-oxide nanolites were identified across the samples. The banding of the nanolites is indicative of nanometer-scale variations in the cooling and composition of the parent melt and their orientations within the matrix are associated with lava flow direction prior to solidification (Manga et al., Reference Manga, Voltolini and Wenk2018). Recent studies on nanolites in rhyolitic melts suggest that the explosivity of volcanic eruptions is influenced by nanolite density as the nanolites provide heterogeneous nucleation surfaces for gases trapped in the matrix. The exsolution of gases reduces the density of the melt, results in further degassing, and contributes to quick ascension rates within the conduit (Di Genova et al., Reference Di Genova, Kolzenburg, Wiesmaier, Dallanave, Neuville, Hess and Dingwell2017; Shea, Reference Shea2017). TEM analysis only provides information on a few micron-scale regions and cannot necessarily be generalized to the entire bulk sample or to all obsidian originating from the Needles Mine in the Warner Mountains. However, since nanolites have been connected to increased gaseous bubble nucleation in volcanic melt, the banding does indicate that the production of bubbles is non-uniform on the micron scale. This means that on this length scale, molten obsidian could experience variations in density, volatile degassing, and ascension rate (Cáceres et al., Reference Cáceres, Wadsworth, Scheu, Colombier, Madonna, Cimarelli, Hess, Kaliwoda, Ruthensteiner and Dingwell2020).
Diffusion at crystalline–amorphous interfaces in obsidian and other volcanic glasses have been reported at the micron and larger scale, but not at the nano-length scale (Magaritz & Hofmann, Reference Magaritz and Hofmann1978). Various models for elemental diffusion between crystallites and host melts have been proposed, including several that account for a depletion of species at the crystalline–amorphous interface (Albarede & Bottinga, Reference Albarede and Bottinga1972; Gardner et al., Reference Gardner, Befus, Watkins, Hesse and Miller2012). The EDS maps showing regions of cation depletion near nanolites support an interface diffusion profile in which certain species of cations are relatively absent from the nanolites and exhibit a convex upward increase in concentration in the surrounding matrix as a function of distance from the matrix–crystalline interface (Smith et al., Reference Smith, Tiller and Rutter1955). This is evident in the EDS linescans of K, Al, Ca, and Na in Figure 4. In this example, K exhibits the most extreme depletion, decreasing in counts per second (cps) by about 55% compared to the bulk at the point of maximum depletion. The EDS linescan across the nanolite in Figure 4 shows a slight increase in Al at the center of the nanolite compared to the regions of maximum depletion. Depletion trends varied slightly between the examined nanolites, but a region of localized cation depletion accompanied by a slight increase in Si concentration at the matrix–nanolite interface, as shown in Figure 4, was commonly observed. In a few cases, Al and Ca remained approximately constant across the nanolites and adjacent matrix, while K and Na varied more substantially. The depletion distances observed were on the order of 50–150 nm, which is roughly the size of the width of the nanolites.
A change in the mean bond lengths of the matrix is expected with a change in the composition. Subtle variations in the Si, O, Al, Ca, Na, and K concentrations as a function of distance from the nanolites altered mean nearest-neighbor distances measured using parallel beam diffraction RDF analysis. The diminished concentration of larger Ca, Na, and K cations near the nanolites resulted in peaks corresponding to smaller nearest-neighbor bond lengths, as shown in Figure 3. The first peak centered around 1.6 Å corresponds predominantly to Si–O bonds, with minor contributions from slightly shorter Al–O bonds (Fogarty et al., Reference Fogarty, Aktulga, Grama, van Duin and Pandit2010; Pamungkas et al., Reference Pamungkas, Joe, Kim and Lee2011). The second peak centered around 2.8 Å corresponds to O–O bonds (Fogarty et al., Reference Fogarty, Aktulga, Grama, van Duin and Pandit2010). The third peak, centered around 4.1 Å for the nanolite in Figure 3c and around 3.8 Å for the nanolite in Figure 3d, includes contributions from various bonds including Si, Al, O, and the larger alkali and alkaline-earth cations. Therefore, only the second and third peaks are likely to change due to the observed cation depletion. Because it is the relatively large atomic species, such as Ca, Na, and K that are depleted, it makes sense that the average bond length decreases as relative concentrations of Si and O are higher and the matrix is more homogeneous near the nanolites. Our measurements confirm that these RDF peak locations move closer into agreement with the peak locations determined for a-SiO2, which are approximately 2.6 and 3.1 Å (Fogarty et al., Reference Fogarty, Aktulga, Grama, van Duin and Pandit2010).
The obsidian in the Warner Mountains is believed to have formed between 9.5 and 7 Ma during the latest period of volcanism in the region (Egger & Miller, Reference Egger and Miller2011). Although nanolites comprise a small portion of the obsidian, their presence has been shown to affect volcanic eruptivity (Di Genova et al., Reference Di Genova, Brooker, Mader, Drewitt, Longo, Deubener, Neuville, Fanara, Shebanova, Anzellini, Arzilli, Bamber, Hennet, La Spina and Miyajima2020). The properties of aluminosilicate glasses are highly dependent on concentrations of Si, Al, and cation species. In general, alkali and alkaline-earth cations are more mobile than Si and form weaker bonds with oxygen, while Si and Al form a more stable network with oxygen (Mysen & Richet, Reference Mysen and Richet2019). The Si-enriched regions adjacent to the nanolites will have greater viscosity relative to the bulk as the absence of large cations creates a more homogenous amorphous network (Mysen & Richet, Reference Mysen and Richet2019). The observation of changes in short-range ordering and atomic coordination as a result of elemental diffusion provides evidence that nanolites alter the nearby glassy structure and may contribute to non-uniform devitrification by reducing the diversity of atomic species and selectively removing larger cations from the matrix (Jerram & Petford, Reference Jerram and Petford2011; Laws et al., Reference Laws, Miracle and Ferry2015). Specifically, the increased stability of the Si-rich regions means they will exhibit a slower rate of devitrification compared to the bulk obsidian (Mysen & Richet, Reference Mysen and Richet2019). This adds to the difference in character between the bulk and nanolite-dense regions of obsidian and offers an additional factor for consideration when discussing the relationship between nanolites and volcanic eruptivity. For example, the relatively higher viscosity of the Si-enriched regions around the nanolites could limit the escape of gaseous bubbles that nucleate at the matrix–nanolite interface (Di Genova et al., Reference Di Genova, Brooker, Mader, Drewitt, Longo, Deubener, Neuville, Fanara, Shebanova, Anzellini, Arzilli, Bamber, Hennet, La Spina and Miyajima2020). This work shows that the influence of the nanolites extends into the obsidian matrix and likely contributes to the dramatic influence that small volume nanolites have on volcanic eruptions.
Conclusions
Taking advantage of obsidian's conchoidal fracture nature, flint knapping techniques can produce thin obsidian samples for TEM analysis without introducing pitting, contamination, or dislodging crystallites. Using this method of sample production, Fe-oxide nanolites were identified in the amorphous matrix of obsidian sourced from the Warner Mountains. Obsidian nanolites are of geologic significance because of the information they contain about the kinetics and thermodynamics of the parent melt from conduit ascension to emplacement and with respect to emerging research on the role they play in heterogeneous bubble nucleation and volcanic explosivity. Na, K, Ca, and Al concentrations are depleted adjacent to many of the nanolites, supporting models of large cation diffusion through the amorphous matrix at the matrix–nanolite interface. EDS maps were compared with RDF analysis from diffraction data across the matrix and the nanolites, showing a decrease in the average nearest atomic neighbor distance for diffraction patterns collected closer to the nanolites in regions of cation depletion. The downward shift in nearest-neighbor bond lengths in the depletion regions approaches the bond lengths measured for RDF on a-SiO2. The elemental and structural information from the amorphous matrix in the vicinity of nanolites indicates that the presence of nanolites affects the local amorphous matrix of the obsidian and could promote non-uniform devitrification and diffusion throughout the obsidian.
Supplementary material
To view supplementary material for this article, please visit https://doi.org/10.1017/S1431927621013957.
Acknowledgements
The work at the Molecular Foundry was supported by the Office of Science, Office of Basic Energy Sciences, of the U.S. Department of Energy under Contract No. DE-AC02-05CH11231. This work was supported by funding from the Jane Lewis Fellowship (University of California). This work partially supported by the US Department of Energy, Office of Science, Office of Basic Energy Sciences, Materials Sciences and Engineering Division under contract No. DE-AC02-05CH11231 within the Electronic Materials Program (No. KC1201). We thank Michelle Devoe for input on the mineralogical relevance of the research.


 Open access