


Introduction
Recent years have experienced a growing interest in the investigation of cultural heritage materials through the use of synchrotron radiation (SR) based techniques (Cotte et al., Reference Cotte, Susini, Solé, Taniguchi, Chillida, Checroun and Walter2008, Reference Cotte, Susini, Dik and Janssens2010, Reference Cotte, Autran, Berruyer, Dejoie, Susini and Tafforeau2019; Bertrand et al., Reference Bertrand, Robinet, Thoury, Janssens, Cohen and Schöder2012; Janssens et al., Reference Janssens, Alfeld, Van Der Snickt, De Nolf, Vanmeert, Radepont, Monico, Dik, Cotte, Falkenberg, Miliani and Brunetti2013, Reference Janssens, Van der Snickt, Vanmeert, Legrand, Nuyts, Alfeld, Monico, Anaf, De Nolf, Vermeulen, Verbeeck, De Wael and Mazzeo2017). Applications involve different types of objects (e.g., paintings, stones, glasses, porcelains, papyri, textiles, plastics, wooden materials, etc.) and different analytical methods (Bertrand et al., Reference Bertrand, Robinet, Thoury, Janssens, Cohen and Schöder2012; Cotte et al., Reference Cotte, Autran, Berruyer, Dejoie, Susini and Tafforeau2019), that were employed either to identify the constituent materials and the manufacturing processes and/or to assess the conservation state via definition of the degradation pathways (Cotte et al., Reference Cotte, Susini, Solé, Taniguchi, Chillida, Checroun and Walter2008, Reference Cotte, Autran, Berruyer, Dejoie, Susini and Tafforeau2019; Bertrand et al., Reference Bertrand, Robinet, Thoury, Janssens, Cohen and Schöder2012; Janssens et al., Reference Janssens, Van der Snickt, Vanmeert, Legrand, Nuyts, Alfeld, Monico, Anaf, De Nolf, Vermeulen, Verbeeck, De Wael and Mazzeo2017; Miliani et al., Reference Miliani, Monico, Melo, Fantacci, Angelin, Romani and Janssens2018).
The strong demand for SR-based techniques is due to their unique instrumental capabilities and source properties, such as brightness, small beam size, broad spectral range (from the infrared to the hard X-ray), and energy tunability (Cotte et al., Reference Cotte, Susini, Solé, Taniguchi, Chillida, Checroun and Walter2008). These properties have led to the development of a wide range of analytical techniques (Bertrand et al., Reference Bertrand, Robinet, Thoury, Janssens, Cohen and Schöder2012; Cotte et al., Reference Cotte, Autran, Berruyer, Dejoie, Susini and Tafforeau2019; Gonzalez et al., Reference Gonzalez, Cotte, Vanmeert, Nolf and Janssens2020a) offering structural characterization, high elemental sensitivity, chemical specificity, and three-dimensional imaging with spatial resolution down to the nanometric length scale. These characteristics are particularly beneficial for the study of highly heterogeneous and complex samples from cultural heritage, such as those from paintings (Cotte et al., Reference Cotte, Susini, Metrich, Moscato, Gratziu, Bertagnini and Pagano2006, Reference Cotte, Susini, Solé, Taniguchi, Chillida, Checroun and Walter2008; Cartechini et al., Reference Cartechini, Miliani, Brunetti, Sgamellotti, Altavilla, Ciliberto and D'Acapito2008; Keune et al., Reference Keune, Mass, Meirer, Pottasch, Van Loon, Hull, Church, Pouyet, Cotte and Mehta2015; Otero et al., Reference Otero, Vilarigues, Carlyle, Cotte, De Nolf and Melo2018; Monico et al., Reference Monico, Sorace, Cotte, De Nolf, Janssens, Romani and Miliani2019; Vanmeert et al., Reference Vanmeert, De Wael, Janssens, Falkenberg and Cotte2019), which in general are composed of micrometric multi-layered systems with different chemical compositions. The high heterogeneity and complexity of such samples can be further increased by the presence of degradation phenomena.
Typically, paint micro-samples are analyzed with a combination of different SR X-ray based techniques to overcome the intrinsic limitations and sensitivity of the single techniques. Notably, X-ray fluorescence (XRF) is used for elemental analysis and can be complemented with X-ray absorption spectroscopy (XAS) to define the chemical speciation of an element of interest, and with X-ray diffraction (XRD) for crystalline phase identification and quantification (Cotte et al., Reference Cotte, Autran, Berruyer, Dejoie, Susini and Tafforeau2019). In general, elemental, chemical speciation, and crystalline phase maps can be obtained by raster scanning the sample over 2D regions. Less frequently, SR X-ray analyses are combined with other SR-based techniques, such as micro-photoluminescence (μPL) or micro-Fourier Transform Infrared (μFTIR) spectroscopy (Salvadó et al., Reference Salvadó, Butí, Labrador, Cinque, Emerich and Pradell2011, Reference Salvadó, Butí, Aranda and Pradell2014; Lluveras-Tenorio et al., Reference Lluveras-Tenorio, Andreotti, Bonaduce, Boularand, Cotte, Roqué, Colombini and Vendrell-Saz2012; Pouyet et al., Reference Pouyet, Cotte, Fayard, Salomé, Meirer, Mehta, Uffelman, Hull, Vanmeert, Kieffer, Burghammer, Janssens, Sette and Mass2015; Langlois et al., Reference Langlois, Mary, Bluzat, Cascio, Balcar, Vandenberghe and Cotte2017; Gonzalez et al., Reference Gonzalez, Hageraats, Wallez, Eveno, Ravaud, Réfrégiers, Thoury, Menu and Gourier2020b). Such non-X-ray techniques provide complementary information on the molecular composition, offering a unique integrated approach for the analysis of painting materials.
In particular, SR μPL proved to be a powerful tool for characterizing complex cultural heritage materials down to the submicrometric scale, thanks to the sensitivity of PL to small variations of local environment (Thoury et al., Reference Thoury, Mille, Séverin-Fabiani, Robbiola, Réfrégiers, Jarrige and Bertrand2016; Hageraats et al., Reference Hageraats, Keune, Réfrégiers, Van Loon, Berrie and Thoury2019; Thoury et al., Reference Thoury, Van Loon, Keune, Hermans, Réfrégiers, Berrie, Casadio, Keune, Noble, Van Loon, Hendriks, Centeno and Osmond2019). For example, recently SR μPL studies on lead white paint have demonstrated that the spectral unfolding of the PL emission can be used to perform semi-quantitative characterization of the spatial distribution of different lead white crystalline phases in paint layers, without exposing samples to a high dose of ionizing radiation, as could be the case when using synchrotron X-ray beams (Gonzalez et al., Reference Gonzalez, Hageraats, Wallez, Eveno, Ravaud, Réfrégiers, Thoury, Menu and Gourier2020b). A major limitation of PL remains the difficulty in interpreting the luminescence spectrum and associating the emission with a specific compound. Indeed, cultural heritage samples are often composed of many different emitting compounds (such as pigments, varnishes, and binders) resulting in a complex emission spectrum.
In this work, we present the combination of SR μPL and SR X-ray based techniques on a case study of two cadmium-based micro-samples from Pablo Picasso's painting Femme (1907, Foundation Beyeler, Riehen/Basel, Switzerland) (Comelli et al., Reference Comelli, Maclennan, Ghirardello, Phenix, Schmidt Patterson, Khanjian, Gross, Valentini, Trentelman and Nevin2019). The painting contains two different types of cadmium yellow (CdY) paints which, although exposed to the same environmental conditions, present different conservation states. While one yellow area has maintained its bright yellow coloration, the other has become brownish. The properties of the preserved and the altered samples are here compared to evaluate similarities with other case studies (Van Der Snickt et al., Reference Van Der Snickt, Dik, Cotte, Janssens, Jaroszewicz, De Nolf, Groenewegen and Van Der Loeff2009, Reference Van Der Snickt, Janssens, Dik, De Nolf, Vanmeert, Jaroszewicz, Cotte and Falkenberg2012; Mass et al., Reference Mass, Sedlmair, Patterson, Carson, Buckley and Hirschmugl2013b; Pouyet et al., Reference Pouyet, Cotte, Fayard, Salomé, Meirer, Mehta, Uffelman, Hull, Vanmeert, Kieffer, Burghammer, Janssens, Sette and Mass2015; Monico et al., Reference Monico, Cartechini, Rosi, Chieli, Grazia, de Meyer, Nuyts, Vanmeert, Janssens, Cotte, de Nolf, Falkenberg, Sandu, Tveit, Mass, de Freitas, Romani and Miliani2020a) and to determine potential markers linked to cadmium yellow degradation. The complementarity of SR X-ray based and SR μPL measurements, applied for the first time to the study of the luminescent emission of CdS in degraded CdY paints, are evaluated and the pros and cons of the combined approach are discussed.
Materials and Methods
Samples Description
Two paint micro-samples, selected from representative areas of the degraded yellow (defined as “now-brownish yellow”) and well-preserved yellow (hereafter referred to as “vibrant yellow”) paints of Picasso's Femme, were embedded in resin (Technovit LC2000) and prepared for the analysis in cross-section. The resin blocks were resized to the minimum thickness [block size ~5 × 4 × 1 mm3 (l × w × h)], to reduce the X-ray absorption by the resin. Results of the preliminary characterization, reported in Comelli et al. (Reference Comelli, Maclennan, Ghirardello, Phenix, Schmidt Patterson, Khanjian, Gross, Valentini, Trentelman and Nevin2019), are summarized in Supplementary Table S1. Both samples are composed of two layers (Figs. 1a, 1b) and consist of a lead white ground and a Cd-based yellow paint.

Fig. 1. Visible light and false-color image of the PL emission (obtained with 275 nm excitation) of the two micro-samples belonging to the (a) now-brownish and (b) vibrant yellow. False-color images of the PL emission are obtained by combining images in the bands 642–708 nm (green) and 800–870 nm (red). Images are recorded as mosaic of different tiles, visible in panel (b). In now-brownish sample, the red channel has been multiplied by a factor 2 for a better visibility.
Methods
The irradiation by SR-based X-ray micro-probes of fragile historical materials might itself induce molecular changes in these objects (Bertrand et al., Reference Bertrand, Schöeder, Anglos, Breese, Janssens, Moini and Simon2015; Monico et al., Reference Monico, Cotte, Vanmeert, Amidani, Janssens, Nuyts, Garrevoet, Falkenberg, Glatzel, Romani and Miliani2020b). The extent of X-ray damage depends either on the material itself (chemical composition) or on the working conditions (fluence/dose, air/vacuum, and ambient/cryogenic temperature). Such changes may result in the darkening of the sample's surface, obscuring the optical PL emission associated with the original material. To overcome this issue, it is mandatory to start systematically with the collection of SR μPL images prior to analysis with X-ray based methods, as performed in this case.
Synchrotron Deep-UV Excited μPL at SOLEIL
The two micro-samples were analyzed at the TELEMOS microimaging end-station of the DISCO beamline at the SOLEIL synchrotron (Saint-Aubin, Gif-sur-Yvette, France). The TELEMOS end-station, described in Thoury et al. (Reference Thoury, Echard, Réfrégiers, Berrie, Nevin, Jamme and Bertrand2011b), is based on a full-field, fully automatized inverted microscope equipped with a dichroic mirror with a cut-off at 300 nm. The excitation wavelength was varied to 250, 275, and 290 nm and photoluminescence micro-images were recorded with a 100×/1.25 NA Zeiss Ultrafluar objective using seven emission filters and variable exposure times to maximize the signal and dynamic range while avoiding saturation. Filters cover the spectral ranges between 420–480 nm, 499–529 nm, 535–607 nm, 642–708 nm, 698–766 nm, and 800–870 nm. A region of interest was defined on each cross section and recorded as a mosaic consisting of different tiles. The images recorded in the different spectral bands were corrected for detector efficiency, filter spectral efficiency, and exposure time and then normalized to the emission peak. False color images of the emission are created by employing the Fiji software (Schindelin et al., Reference Schindelin, Arganda-Carreras, Frise, Kaynig, Longair, Pietzsch, Preibisch, Rueden, Saalfeld, Schmid, Tinevez, White, Hartenstein, Eliceiri, Tomancak and Cardona2012) assigning images of interest to red (R) and green (G) channels.
Synchrotron μXRF and μXANES at ESRF-EBS
High lateral resolution information on the distribution and speciation of Cd, Cl, and S was obtained by performing 2D μXRF mapping and fluorescence mode X-ray absorption near-edge structure (μXANES) spectroscopy analysis at S K-, Cl K-, and Cd L3-edges at the scanning X-ray microscope (SXM) end-station hosted at the beamline ID21 (Cotte et al., Reference Cotte, Pouyet, Salomé, Rivard, De Nolf, Castillo-Michel, Fabris, Monico, Janssens, Wang, Sciau, Verger, Cormier, Dargaud, Brun, Bugnazet, Fayard, Hesse, del Real, Veronesi, Langlois, Balcar, Vandenberghe, Kieffer, Kieffer, Barrett, Cohen, Cornu, Baker, Gagliardini, Papillona and Susini2017), benefiting from the recently commissioned “Extremely Bright Source” of the European Synchrotron, ESRF-EBS (Grenoble, France). Investigations were carried out using the new double crystal Si(111) monochromator developed by the ESRF (Baker et al., Reference Baker, Baboulin, Barrett, Bernard, Berruyer, Bonnefoy, Brendike, Brumund, Dabin, Ducotté, Gonzalez, Malandrino, Marion, Mathon, Roth and Tucoulou2018), delivering a highly stable beam in both static and dynamic modes. The beam was kept stable within the beam size while scanning the energy across the S K-, Cl K-, and Cd L3-edges, but also while switching from one edge to another. This is an asset for multi-edge XANES analyses such as those conducted in this study, since it allows the speciation of various elements without losing time for beamline realignment. The energy calibration was performed using reference powders of CaSO4⋅2H2O, NaCl, and a metallic Cd foil.
The incident beam was focused with Kirkpatrick-Baez mirrors down to a square beam of 0.36 × 0.33 μm2 (h × v), benefitting from the reduced horizontal emittance achieved with EBS (decreased from 4 nm to 110 pm). XRF signals were collected in the horizontal plane and at 69° with respect to the incident beam direction with a 100 mm2 Sirius Series SDD (Silicon Drift Detector) detector (SGX Sensortech), and Falcon X readout electronics (Xia LLC).
μXRF maps were recorded by employing a monochromatic primary beam of fixed energy either at 3.65 or 7.2 keV and with a dwell time of 50 ms/pixel. The software PyMca was used to fit the XRF spectra and to separate the contribution of different elements (Solé et al., Reference Solé, Papillon, Cotte, Walter and Susini2007).
Single-point fluorescence mode μXANES spectra were acquired by scanning the primary energy across the absorption edges of S, Cl, and Cd, according to the following parameters: S K-edge (2.46–2.53 keV; energy step: 0.15 eV), Cl K-edge (2.81–2.89 keV; energy step: 0.25 eV), and Cd L3-edge (3.52–3.65 keV; energy step: 0.32 eV). Data processing of single-point μXANES spectra was performed with the ATHENA software (Ravel & Newville, Reference Ravel and Newville2005). Spectra were normalized and fitted with a linear combination fit (LCF) of library XANES spectra of S- and Cd-based reference compounds. The LCF procedure allowed the quantitative determination of the relative amount (percentage) of sulfate (SVI), sulfite (SIV), and sulfide (S−II) species (expressed as %[SVI]/[Stotal], %[SIV]/[Stotal], and %[ S−II]/[Stotal]) and of different Cd compounds.
Synchrotron μXRD at ESRF-EBS
2D μXRD maps were recorded on the same cross-sections at the “micro-branch” end-station of beamline ID13 at ESRF (Riekel et al., Reference Riekel, Burghammer and Davies2010), benefitting from the Historical Materials “Block Allocation Group” (BAG) access (Cotte et al., Reference Cotte, Gonzalez, Vanmeert, Monico, Dejoie, Burghammer, Huder, de Nolf, Fisher, Fazlic, Chauffeton, Wallez, Jiménez, Albert-Tortosa, Salvadó, Possenti, Colombo, Ghirardello, Comelli, Avranovich Clerici, Vivani, Romani, Costantino, Janssens, Taniguchi, McCarthy, Reichert and Susini2022). The incident energy (13 keV) was selected by means of a Si(111) crystal monochromator, while compound refractive lenses (CRL) —mounted in a transfocator— were employed to focus the beam down to 2.5 × 2.5 μm2 (h × v). XRD signals were recorded in transmission geometry using a Dectris EIGER X 4M detector (2,070 × 2,167 pixels, pixel size 75 × 75 μm2) with an acquisition time of 25 ms/pixel. Calibration of the setup was performed using an Al2O3 reference sample. The recorded 2D diffraction images were azimuthally integrated using the Jupyter Notebooks based on the PyFAI software package (Ashiotis et al., Reference Ashiotis, Deschildre, Nawaz, Wright, Karkoulis, Picca and Kieffer2015) and subsequently analyzed using the XRDUA software package (De Nolf et al., Reference De Nolf, Vanmeert and Janssens2014).
Results
Synchrotron Deep-UV Excited μPL at SOLEIL
Figure 1 shows the false-color image of the SR μPL emission for each sample, obtained by combining the images at 642–708 nm (green channel) and 800–870 nm (red channel), excited with deep-UV light at 275 nm. Similar results were found with other excitation wavelengths (data not reported).
The use of SR μPL imaging allows to observe a high spatial heterogeneity of the optical emission in the altered CdS paint films (Fig. 1a), with regions at the top and at the bottom of the CdY paint layer emitting weakly in the NIR (800–870 nm) and an intermediate region that brightly fluoresces in the red (642–708 nm). Interestingly, this heterogeneity is measured only in the now-brownish yellow paint, while vibrant yellow presents a more homogeneous emission within the whole yellow paint layer (Fig. 1b) peaked in the 800–870 nm spectral range. The emission at shorter wavelengths can be related to the emission of the binding medium (peaked at 535–607 nm) (see Supplementary Fig. S1).
The vibrant yellow paint is characterized by a NIR emission (800–870 nm), typical of CdS deep trap states (Thoury et al., Reference Thoury, Delaney, De La Rie, Palmer, Morales and Krueger2011a; Cesaratto et al., Reference Cesaratto, D'Andrea, Nevin, Valentini, Tassone, Alberti, Frizzi and Comelli2014; Rosi et al., Reference Rosi, Grazia, Gabrieli, Romani, Paolantoni, Vivani, Brunetti, Colomban and Miliani2016). This emission, due to defects in the crystal structure of CdS (Thoury et al., Reference Thoury, Delaney, De La Rie, Palmer, Morales and Krueger2011a; Giacopetti et al., Reference Giacopetti, Nevin, Comelli, Valentini, Nardelli and Satta2018), is highly favored in CdS-based pigment with respect to other emissions, such as the near-band-edge radiative recombination (Cesaratto et al., Reference Cesaratto, D'Andrea, Nevin, Valentini, Tassone, Alberti, Frizzi and Comelli2014; Ghirardello et al., Reference Ghirardello, Kelly, Valentini, Toniolo and Comelli2020a). The emission of the degraded yellow paint, instead, is more intense in the band 642–708 nm, occurring at shorter wavelengths than would be expected for the common deep trap state emission of Cd-based paints (Rosi et al., Reference Rosi, Grazia, Gabrieli, Romani, Paolantoni, Vivani, Brunetti, Colomban and Miliani2016).
SR μXRF, μXANES, and μXRD at ESRF-EBS
The elemental composition of the two yellows, detected through SR μXRF, shows that the now-brownish yellow layer is mainly composed of Cd, S, and Ba, while Pb is dominant in the white ground layer (Fig. 2b and Supplementary Fig. S3b). The widespread presence of Cl was also revealed in the now-brownish yellow paint layer, spatially co-localized with the distribution of Cd (Fig. 2c and Supplementary Fig. S3c) though pockets of Cd without Cl are also apparent. The vibrant yellow paint contains the same elements found in the now-brownish sample (Cd, S, Ba, and Pb), although Pb is present in both the yellow and the white layers (see Supplementary Fig. S4). In this case, chlorine is distributed only at the surface of the paint as a very thin layer (with a thickness less than 3 μm) with less correlation with the distribution of Cd (Fig. 3b).
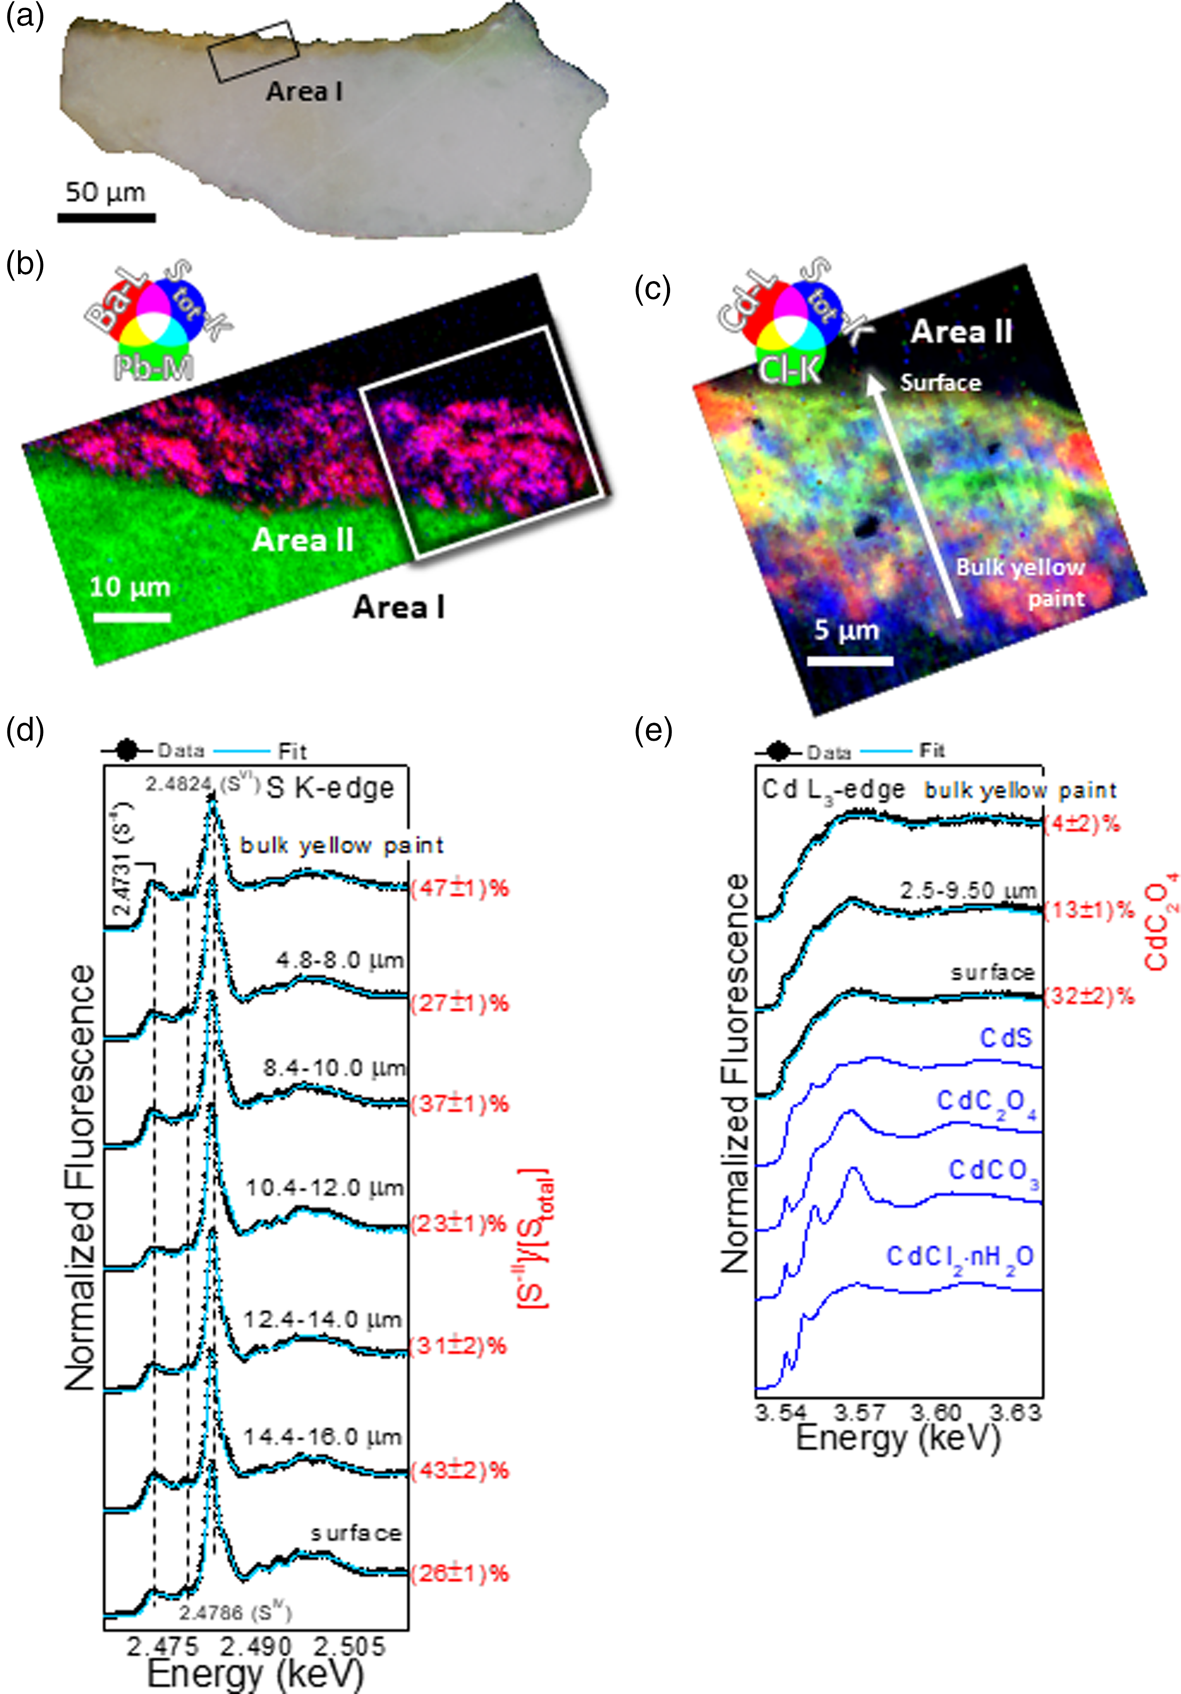
Fig. 2. Now-brownish yellow sample. (a) Visible light microscopy image of the cross section. RGB composite SR μXRF maps of (b) Ba/Pb/S and (c) Cd/Cl/S [step size (h × v), 0.25 × 0.25 μm2; exp. time, 50 ms/pixel; energy area I: 7.2 keV; energy area II: 3.65 keV]. In (a,b), the black and white rectangles correspond to the regions where SR μXRF analysis of panels (b,c) were performed. (d,e) Series of μXANES spectra (black) recorded at (d) S K-edge and (e) Cd L3-edge and linear combination (LCF) results (cyan) of different S-/Cd-based reference compounds (for details, see Supplementary Tables S2 and S3). In blue, spectral profiles of selected reference compounds (see also Supplementary Fig. S2). In (d,e), spectra were recorded across the line shown in (c) with steps of 0.4–0.5 μm and averaged within the depth values reported in each panel (for further data, see Supplementary Fig. S3).
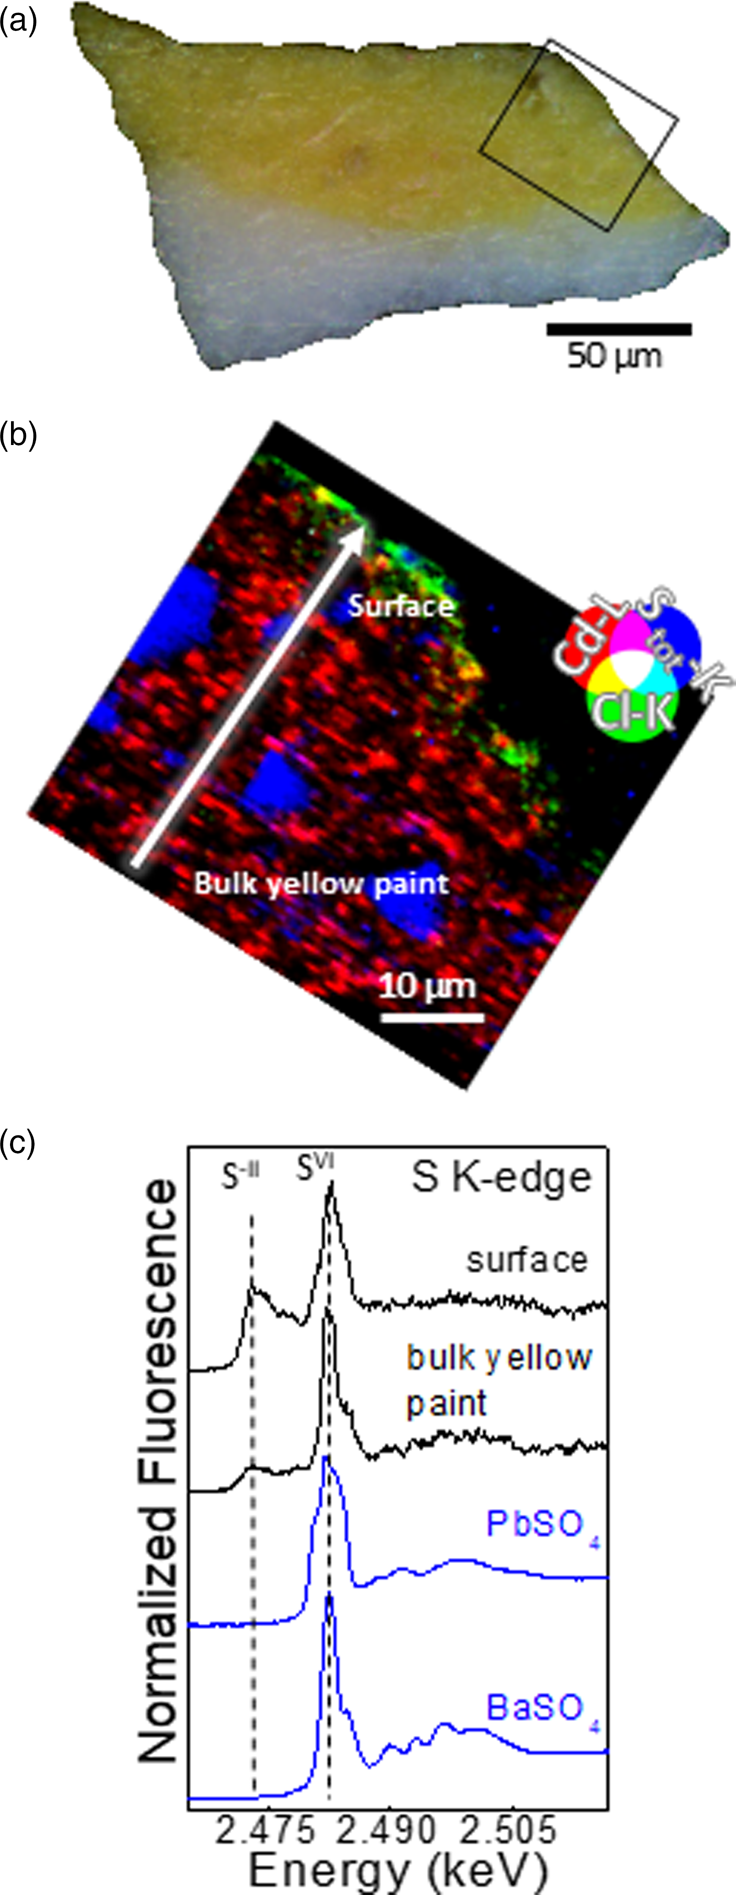
Fig. 3. Vibrant yellow sample. (a) Visible light microscopy image of the cross section. Area marked in black corresponds to the SR μXRF map of panel (b). (b) RGB composite SR μXRF maps of Cd/Cl/S [step size (h × v), 0.5 × 0.5 μm2; exposure time, 50 ms/pixel; energy, 3.65 keV. (c) Selection of μXANES spectra (black) recorded at S K-edge from the line shown in (b) compared to those of reference compounds.
To determine the nature and distribution of the various Cd, S, and Cl species through the stratigraphy of the yellow paint layer, a series of μXANES line spectra at the S K-, Cl K-, and Cd L3-edges were acquired at different depths below the paint surface, extending down into the ground layer for both cross-sections. XANES spectra of S- and Cd-based reference compounds are reported in Figures 2e, 3c and Supplementary Figure S2. The series of S K-edge μXANES spectra (Figs. 2d, 3c and Supplementary Fig. S3d and Table S2) highlights, besides CdS (peak at 2.4731 keV), the presence of sulfate species (white line at 2.4824 keV) in both yellows. The method which consists in acquiring the same μXRF map at two energies (the sulfides and sulfates white line energies) (Van Der Snickt et al., Reference Van Der Snickt, Dik, Cotte, Janssens, Jaroszewicz, De Nolf, Groenewegen and Van Der Loeff2009; Monico et al., Reference Monico, Chieli, De Meyer, Cotte, de Nolf, Falkenberg, Janssens, Romani and Miliani2018) to map the relative amount of Cd–sulfate (SVI) versus Cd–sulfide (S−II) cannot be applied here due to the presence of other sulfate species (PbSO4, BaSO4). However, the identification and localization of these sulfate species were achieved with μXRD (as explained below).
By fitting S K-edge μXANES spectra as linear combinations of reference spectra, some conclusions can be drawn with respect to the distribution of the different SVI-compounds within the yellow layers (see Supplementary Table S2). In the now-brownish yellow, PbSO4 is the dominant component along with minor amounts of CdSO4/CdSO4⋅H2O in the bottommost 10 μm of the sample, whereas BaSO4 and CdSO4/CdSO4⋅H2O are the main compounds of the uppermost surface of the paint. In addition to sulfides and sulfates, S K-edge μXANES spectra show the additional presence of sulfites (SIV; signal at 2.4786 keV), as reported in other case studies of degraded CdS (Monico et al., Reference Monico, Chieli, De Meyer, Cotte, de Nolf, Falkenberg, Janssens, Romani and Miliani2018; Monico et al., Reference Monico, Cartechini, Rosi, Chieli, Grazia, de Meyer, Nuyts, Vanmeert, Janssens, Cotte, de Nolf, Falkenberg, Sandu, Tveit, Mass, de Freitas, Romani and Miliani2020a). Notably, sulfite species are related to intermediate mechanisms of the oxidation of sulfides to sulfates (Monico et al., Reference Monico, Cartechini, Rosi, Chieli, Grazia, de Meyer, Nuyts, Vanmeert, Janssens, Cotte, de Nolf, Falkenberg, Sandu, Tveit, Mass, de Freitas, Romani and Miliani2020a). In the vibrant yellow paint, LCF of S K-edge XANES spectra was not performed, since the contribution of the Pb M5 XRF emission line strongly overlaps with S K-lines. Spectral features characteristic of PbSO4 were apparent at the paint surface, with other SIV-species.
Results of the LCF on Cd L3-edge XANES line scans show the presence of CdS in both samples (see Supplementary Table S3). However, while in the vibrant yellow CdS is the dominant chemical component (data not shown), the now-brownish yellow paint shows an enrichment of Cd–Cl compounds and CdC2O4, the latter mainly located at the paint surface (Fig. 2e and Supplementary Fig. S3e and Table S3).
The μXANES line scans at the Cl K-edge in the now-brownish yellow show similar spectra throughout the entire layer (Fig. 4a). Spectral features show a good agreement with those of profiles previously recorded on artificially aged paint mock-ups originally containing cadmium hydrochloride (Cd(OH)Cl) (Monico et al., Reference Monico, Cartechini, Rosi, Chieli, Grazia, de Meyer, Nuyts, Vanmeert, Janssens, Cotte, de Nolf, Falkenberg, Sandu, Tveit, Mass, de Freitas, Romani and Miliani2020a) and amorphous Cd–Cl compounds. In the vibrant yellow, instead, only the spectra recorded within the uppermost few micrometres of the paint surface show features that resemble an amorphous Cd–Cl compound (Fig. 4b). The profiles recorded in the bulk of the paint do not appear to match with Cd–Cl compounds. While their assignment remains uncertain, the spectral features are similar to those of oxychlorinated- and/or organochlorinated-compounds (Vaudey et al., Reference Vaudey, Gaillard, Toulhoat, Moncoffre, Schlegel and Raimbault2011; Leri et al., Reference Leri, Mayer, Thornton, Northrup, Dunigan, Ness and Gellis2015).

Fig. 4. Series of Cl K-edge μXANES spectra (black) recorded from (a) now-brownish yellow and (b) vibrant yellow. In blue, spectral profiles of selected Cl reference compounds. Spectra were recorded across the lines shown in Figures 2c and 3b with steps of 0.4–0.5 μm and averaged within the depth values reported in each panel.
SR μXRD 2D maps provided information on the nature and distribution of the different constituent crystalline phases in the two samples. The now-brownish yellow paint (Fig. 5a) is composed of BaSO4, cadmium carbonate (CdCO3), 8/3-hydrate cadmium sulfate (3CdSO4⋅8H2O), and PbSO4, this latter mainly concentrated at the interface between the yellow CdS and the lead white ground. Cd(OH)Cl is also detected in the now-brownish yellow layer, spatially localized in a similar region of 3CdSO4⋅8H2O, in agreement with previous research (Monico et al., Reference Monico, Cartechini, Rosi, Chieli, Grazia, de Meyer, Nuyts, Vanmeert, Janssens, Cotte, de Nolf, Falkenberg, Sandu, Tveit, Mass, de Freitas, Romani and Miliani2020a). Interestingly, although the presence of CdS has been detected in the now-brownish layer through XANES, neither hexagonal nor cubic CdS are detected by μXRD. This suggests that the pigment is likely amorphous or nanocrystalline. The vibrant yellow (Fig. 5b) is mainly composed of hydrocerussite [Pb3(CO3)2(OH)2], BaSO4, and sparse grains of CdS in both crystalline forms (hexagonal and cubic). PbSO4 is also detected in the yellow layer and is spatially localized in an area corresponding to the surface of the painting. The white ground, common to both samples, is composed of cerussite (PbCO3) and hydrocerussite.

Fig. 5. SR μXRD distribution in (a) now-brownish yellow and (b) vibrant yellow of the different crystalline phases identified [step size (h × v), 1 × 1 μm2; exposure time, 25 ms/pixel; energy, 13 keV]. The darker region in the center of the maps is due to the poor transparency of the sample (mainly composed of Pb) to X-ray (measurements were acquired in transmission mode).
Discussion
Combination of Different SR-Based Techniques
The spatial correlation between the maps obtained with different SR techniques is challenging due to the different volumes probed by each method. Although providing an accurate estimate of the probing depth of DUV and X-ray excitation is rather difficult due to the dependence on multiple parameters (such as material properties, layer thickness, excitation energy, and reabsorption effects), the penetration depth of DUV light excitation (tens of nanometres to few microns, depending on the material) reduced the probed volume compared to that examined with X-ray analyses (few microns for XANES at 2.5–3.5 keV and tens of microns for XRD at 13 keV). Consequently, PL images are related to the signal from the exposed surface of the cross-section, while X-ray information is related to a larger volume for XANES and to the entire cross-section for XRD. Data interpretation is further complicated by the fact that the sensitivity of each technique depends on materials composition and properties.
Considering these issues, it is clear that the superimposition of distributional maps from different techniques is not straightforward. Nonetheless, the combination of the molecular information provided by each technique allows us to achieve a clearer characterization of the samples and to provide a clearer comprehension of μPL data.
Focusing on the now-brownish yellow, we can in infer the following observations:
(i) Upon deep-UV excitation, the paint exhibits an intense optical emission. Among the compounds identified through μXRD and μXANES, the only one that is well-known for its optical emission is CdS (Gaft et al., Reference Gaft, Reisfeld and Panczer2015; Comelli et al., Reference Comelli, Maclennan, Ghirardello, Phenix, Schmidt Patterson, Khanjian, Gross, Valentini, Trentelman and Nevin2019), while all the other identified compounds are low- or non-emitting materials. Hence, the optical emission of the degraded CdY paint has to be ascribed to CdS and, in particular, to the radiative emission occurring from deep trap states induced by defects. Indeed, the emission occurs at longer wavelengths than the near-band-edge emission of CdS (Thoury et al., Reference Thoury, Delaney, De La Rie, Palmer, Morales and Krueger2011a; Cesaratto et al., Reference Cesaratto, D'Andrea, Nevin, Valentini, Tassone, Alberti, Frizzi and Comelli2014; Rosi et al., Reference Rosi, Grazia, Gabrieli, Romani, Paolantoni, Vivani, Brunetti, Colomban and Miliani2016).
(ii) μXRD and μXANES infer the presence of CdS as an amorphous or nanocrystalline material. While amorphous CdS should present a faint optical emission, highly defective CdS nanoparticles in general present an intense emission from trap states (Veamatahau et al., Reference Veamatahau, Jiang, Seifert, Makuta, Latham, Kanehara, Teranishi and Tachibana2015). Therefore, we can hypothesize that the pigment is based on nanocrystalline CdS, as has been already identified in other degraded cadmium yellow paints (Levin et al., Reference Levin, Finnefrock, Hull, Thomas, Nguyen, Holtz, Plahter, Grimstad, Mass and Muller2019). The large surface-to-volume ratio of CdS nanoparticles causes them to easily react with the surrounding environment, giving them a low stability and high reactivity (Xu et al., Reference Xu, Liang, Yang and Yu2018) thus contributing to paint degradation.
(iii) In-situ measurements (Comelli et al., Reference Comelli, Maclennan, Ghirardello, Phenix, Schmidt Patterson, Khanjian, Gross, Valentini, Trentelman and Nevin2019) on the now-brownish yellow paint have shown only the presence of an intense emission peaked at 650 nm. SR μPL analysis allowed a more complex situation to be defined, with the presence of NIR emission in the uppermost and bottommost part of the yellow layer and red emission in the innermost part. Interestingly, μXRF and μPL maps display a certain degree of correlation, both displaying different signals at the surface and at the bottom of the degraded paint with respect to its inner part. In details, the comparison of the elemental distribution achieved through μXRF maps and the PL emission shows that Cd-rich areas (without Cl, blue areas in RGB composite of μXRF maps in Fig. 6) present NIR PL emission (800–870 nm). Instead, areas containing Cd and Cl (cyan in RGB composite of μXRF maps in Fig. 6) are more correlated with the emission occurring in the band 642–708 nm (green in false RGB PL images in Fig. 6). Based on this correlation, we hypothesize that chlorine species affected the paint micro-environment and consequently the stability of the highly reactive poorly crystalline CdS, inducing the formation of a high-density of superficial defects (Lee et al., Reference Lee, Kim, Jung, Kim, Nahm, Lee, Kang, Lee and Park2012) that are responsible of the intense PL emission observed. To confirm this hypothesis, further artificial ageing test on paint models with measurements before and after degradation are necessary.

Fig. 6. Comparison between SR μXRF maps and false-color image of the PL emission of two different region of the now-brownish sample. Panel (a) shows part of the region of interest reported in Supplementary Figure S3, panel (b) the region of interest reported in Figure 2b. The RGB composite of SR μXRF maps of Cd/S/Cl [step size (h × v), 0.25 × 0.25 μm2; exp. time, 50 ms/pixel; energy, 3.65 keV] and the corresponding false-color image of the PL emission [275 nm excitation, green = 642–708 nm, red = 800–870 nm (multiplied by a factor 2)] are reported for each region.
Comparison with Previous Case Studies
X-ray-based analysis revealed that Picasso employed (at least) two different CdY paints in the painting. The vibrant yellow is mainly composed of a mixture of crystalline hexagonal and cubic CdS with two different extenders [Pb3(CO3)2(OH)2 and BaSO4], while the now-brownish yellow is made up of a mixture of amorphous or nanocrystalline CdS and BaSO4. This finding provides the first clear evidence of the different crystallinity of CdS in the two yellow paints belonging to Picasso's Femme.
Cl compounds are present in both vibrant and now-brownish paints. In the vibrant yellow sample, amorphous Cd–Cl species are limited to the surface of the paint layer, while the bulk shows Cl compounds with an unidentified chemical speciation and in an extremely low amount. Instead, in the now-brownish paint, the Cl species could be identified as Cd(OH)Cl and amorphous Cd–Cl compounds, and were found widespread throughout the paint stratigraphy.
The poor crystallinity of the now-brownish yellow and the presence of Cd(OH)Cl can be ascribed to the production method of the pigment, in particular to wet synthesis processes that produced a poorly crystalline pigment with an abundance of synthesis residues (Leone et al., Reference Leone, Burnstock, Jones, Hallebeek, Boon and Keune2005; Mass et al., Reference Mass, Opila, Buckley, Cotte, Church and Mehta2013a; Levin et al., Reference Levin, Finnefrock, Hull, Thomas, Nguyen, Holtz, Plahter, Grimstad, Mass and Muller2019; Ghirardello et al., Reference Ghirardello, Otero, Comelli, Toniolo, Dellasega, Nessi, Cantoni, Valentini, Nevin and Melo2020b). In previous work (Ghirardello et al., Reference Ghirardello, Otero, Comelli, Toniolo, Dellasega, Nessi, Cantoni, Valentini, Nevin and Melo2020b), we have detected chlorine contaminations only in pigments synthesized from CdCl2. Therefore, it is reasonable to ascribe the presence of Cl to the synthesis method. Moreover, the identification of cadmium carbonate in the now-brownish paint further supports the hypothesis that a specific wet synthesis method [the indirect wet process (Mass et al., Reference Mass, Sedlmair, Patterson, Carson, Buckley and Hirschmugl2013b; Pouyet et al., Reference Pouyet, Cotte, Fayard, Salomé, Meirer, Mehta, Uffelman, Hull, Vanmeert, Kieffer, Burghammer, Janssens, Sette and Mass2015; Levin et al., Reference Levin, Finnefrock, Hull, Thomas, Nguyen, Holtz, Plahter, Grimstad, Mass and Muller2019)] could have been employed for the CdS pigment found in the altered yellow area.
Although the two paints have been exposed to the same environmental conditions, the different types of CdS pigment along with some residual of the starting reagents (i.e., chlorine species) have influenced the paint stability, leading to degradation where a poorly crystalline CdY pigment was used, accompanied by residual contamination from the synthesis process. This finding on the specific case study of Femme is in agreement with other publications on other degraded cadmium yellow paints (Leone et al., Reference Leone, Burnstock, Jones, Hallebeek, Boon and Keune2005; Pouyet et al., Reference Pouyet, Cotte, Fayard, Salomé, Meirer, Mehta, Uffelman, Hull, Vanmeert, Kieffer, Burghammer, Janssens, Sette and Mass2015; Monico et al., Reference Monico, Cartechini, Rosi, Chieli, Grazia, de Meyer, Nuyts, Vanmeert, Janssens, Cotte, de Nolf, Falkenberg, Sandu, Tveit, Mass, de Freitas, Romani and Miliani2020a), that have similarly shown the presence of poorly crystalline or nanocrystalline (Levin et al., Reference Levin, Finnefrock, Hull, Thomas, Nguyen, Holtz, Plahter, Grimstad, Mass and Muller2019) CdS pigments, together with the presence of chlorine compounds. The occurrence of these two features on an increasing number of historical degraded paintings confirm their key role in CdY paint degradation and paves the way for future work on artificially aged model paints focusing on clarifying the individual role of these two factors.
PbSO4 was detected in both samples. Based on previous studies, this compound can be associated with the degradation of lead white (Gonzalez et al., Reference Gonzalez, Van Loon, Wt Price, Noble and Keune2020c). In paintings with both CdY and lead white, the development of PbSO4 was linked with the oxidation of CdS and to the formation of the more stable salt than CdSO4 (PbSO4) (Van Der Snickt et al., Reference Van Der Snickt, Janssens, Dik, De Nolf, Vanmeert, Jaroszewicz, Cotte and Falkenberg2012), although it is noted that PbSO4 can also form as a consequence of the reaction of lead white with environmental SO2 (Szlachetko et al., Reference Szlachetko, Cotte, Morse, Salomé, Jagodzinski, Dousse, Hoszowska, Kayser and Susini2010; Price et al., Reference Price, Van Loon, Keune, Parsons, Murray, Beale and Mosselmans2019). PbSO4 is present in both paints but to different extents. In the now-brownish yellow, PbSO4 is present mainly and with higher concentration (see Supplementary Table S2) at the interface between the yellow and the white ground. Since the lower white ground layer is shielded from the environment by the yellow paint layer above, the presence of PbSO4 at this interface could be reasonably linked to the reaction within the paint layers (Van Der Snickt et al., Reference Van Der Snickt, Dik, Cotte, Janssens, Jaroszewicz, De Nolf, Groenewegen and Van Der Loeff2009). In the vibrant yellow, PbSO4 has formed as a thin layer on the sample surface only, suggesting that its formation is likely the consequence of the interaction with the environment.
In addition to the different CdYs used, it is also interesting to note that two different sub-types of lead white pigment were used in the painting. The white used for the ground contains the usual two constitutive phases of lead white, cerussite and hydrocerussite. However, the one mixed with the vibrant yellow paint contains only hydrocerussite. The painting (dated 1907) was created in a key moment for the production of lead white: indeed, the historical synthesis of lead white based on lead corrosion was still in use alongside new production routes based on precipitation (Gonzalez et al., Reference Gonzalez, Wallez, Calligaro, Gourier and Menu2019, Reference Gonzalez, Calligaro, Wallez, Eveno, Toussaint and Menu2016, Reference Gonzalez, Wallez, Calligaro, Cotte, De Nolf, Eveno, Ravaud and Menu2017). A lead white paint entirely composed of hydrocerussite (as the one mixed with CdS in vibrant yellow) is difficult to obtain following the historical lead white synthesis (Gonzalez et al., Reference Gonzalez, Wallez, Calligaro, Gourier and Menu2019), and might thus correspond to the use of a modern synthesis process. In contrast, the white ground with its mixed composition of hydrocerussite and cerussite is linked to the traditional synthesis process.
Conclusion and Future Perspective
The results obtained from SR measurements, exploiting the improved performances of ESRF-EBS (Cotte et al., Reference Cotte, Autran, Berruyer, Dejoie, Susini and Tafforeau2019), refurbished ID21 and the combination with SR μPL allowed us to observe new chemical and structural features in both samples [e.g., different CdS crystallinity, presence of Cd(OH)Cl and clear identification of degradation species]. Although the correlation of the distribution maps is not straightforward, the combination of the information provided by the different techniques demonstrated to be fundamental to achieve a better understanding of the samples.
The experience gained by the application of this SR-based multi-analytical protocol states that the main difficulties in data integration is caused by the differences in the volumes probed by the different measurement modalities. In this framework, the use of thin sections (~10 μm) allows to probe a similar sample volume (at least for XANES and XRD), while also increasing the homogeneity of the sample along the radiation direction. Moreover, to achieve a better correlation with X-ray-based analysis, the X-ray excited optical luminescence could also be employed (Hageraats et al., Reference Hageraats, Keune, Stanescu, Laurent, Fresquet and Thoury2021).
Focusing on the specific study of the degradation of cadmium yellow paints, in the close future the study of less complex artificially aged model samples with a combination of SR X-ray and PL techniques will allow us to achieve a further step in the comprehension of the factors triggering the stability of this paint. CdY paints prepared ad hoc from different historically reconstructed pigments will be systematically studied with a combination of μXRF, μXANES, μXRD, and μPL measurements to understand the role of particle size and chlorine compounds on the stability of CdY oil paints.
Supplementary material
To view supplementary material for this article, please visit https://doi.org/10.1017/S1431927622000873.
Acknowledgments
The authors wish to thank Markus Gross and Fondation Beyeler (Riehen/Basel, Switzerland) for providing the samples from Femme and allowing their study and colleagues from the Getty Conservation Institute Alan Phenix, Herant Khanjian, Karen Trentelman. This research was carried out at DISCO beamline at SOLEIL (proposal n. 20190111) and at ID21 and ID13 beamlines at ESRF-EBS (proposal HG-159 and in-house beamtime). The proposal HG-159 is a pilot of the Heritage BAG project (proposal HG-172) supported by the European Union's Horizon 2020 research and innovation programme under grant agreement No 870313, Streamline. We thank Loïc Huder and PaNOSC (project funded by the European Union's Horizon 2020 Research and Innovation programme under Grant Agreement No 823852), for data analysis tools (Jupyter notebooks). We thank ESRF accelerator and source division, the ID21 and ESRF instrumentation service and development division colleagues for their efforts in instrumental developments for EBS and ID21 refurbishment, especially Stuart Fisher for the development of Daiquiri interface. Financial support by the Access to Research Infrastructures activity in the Horizon 2020 Programme of the EU (IPERION CH Grant Agreement n. 654028) is gratefully acknowledged for SOLEIL measurements.
Conflict of interest
The authors declare no competing interests.


 Open access