


1 Introduction
Science is inherently uncertain, and in a public health context, when dealing for instance with new diseases in a crisis situation, information can be especially uncertain. Yet, decisions need to be made, despite the uncertainty. Science communication, particularly non-persuasive communication in this kind of context, therefore faces the challenge of expressing scientific uncertainty whilst supporting informed decision making (Reference Blastland, Freeman, Linden, Marteau and SpiegelhalterBlastland et al., 2020; Reference Fischhoff and DavisFischhoff & Davis, 2014). Uncertainty, for instance, around an estimate of an effect – ‘direct’ uncertainty (Reference van der Bles, van der Linden, Freeman, Mitchell, Galvao, Zaval and Spiegelhaltervan der Bles et al., 2019) — is known to play a role in how people perceive information and use it in their decision making (Reference Gustafson and RiceGustafson & Rice, 2020). The way in which direct uncertainty around a number is communicated, such as verbally or numerically for instance, can lead to different interpretations of the information, and much research has shed light on these relationships (Reference Dhami and MandelDhami & Mandel, 2021; Reference Kause, Bruin, Domingos, Mittal, Lowe and FungKause et al., 2021; Reference Mandel and IrwinMandel et al., 2021; Reference Mandel and IrwinMandel & Irwin, 2021; Reference van der Bles, van der Linden, Freeman and Spiegelhaltervan der Bles et al., 2020). Additionally, research has shown that the format in which such direct uncertainty (e.g., probabilistic predictions) is communicated can also affect the perceived credibility of the communicator (Reference Collins and MandelCollins & Mandel, 2019; Reference Jenkins, Harris and LarkJenkins et al., 2017; Reference Jenkins, Harris and LarkJenkins et al., 2018; Reference Jenkins and HarrisJenkins & Harris, 2021). Although some literature points to a potential adverse effect of presentation format on aspects such as understanding and credibility, disclosure of direct uncertainty around numeric estimates and predictions more generally, does not necessarily seem to decrease trust in the numbers or in the source of the message (Reference Gustafson and RiceGustafson & Rice, 2019, 2020; Reference Hendriks and JucksHendriks & Jucks, 2020; Reference Howe, MacInnis, Krosnick, Markowitz and SocolowHowe et al., 2019; Reference Kreps and KrinerKreps & Kriner, 2020; Reference van der Bles, van der Linden, Freeman and Spiegelhaltervan der Bles et al., 2020) and can even increase trust in some contexts (Reference Joslyn and DemnitzJoslyn & Demnitz, 2021; Reference Joslyn and LeclercJoslyn & Leclerc, 2016).
Despite the sizeable body of research and the insights gained on the effects of communicating direct, quantified uncertainties, little is known about the effects of communicating the deeper, more subjective, and not easily quantifiable elements of uncertainty in scientific information. This makes up the ‘indirect’ uncertainty around a claim or estimate (Reference van der Bles, van der Linden, Freeman, Mitchell, Galvao, Zaval and Spiegelhaltervan der Bles et al., 2019), such as the underlying quality of evidence (Reference WeissWeiss, 2003). Quality of evidence is often broadly defined as “the extent to which confidence in an estimate of the effect is adequate to support recommendations” (Reference Guyatt, Oxman, Vist, Kunz, Falck-Ytter and SchünemannGuyatt, Oxman, Vist, Kunz, Falck-Ytter, & Schünemann, 2008, p. 995). Unlike quantifiable uncertainties, which can be communicated in the form of a numeric or confidence interval, it is a more subjective and less easily quantified measure of how much the estimate could be affected by known and unknown factors and biases (e.g., lack of data, disagreement between experts, imprecision, confounding variables).
In a recent article, Reference Blastland, Freeman, Linden, Marteau and SpiegelhalterBlastland et al. (2020) present five rules for effective evidence communication, one of which is to clearly state “evidence quality” (as well as direct uncertainties). Reference Fischhoff and DavisFischhoff and Davis (2014) argue that such uncertainty information needs to be summarized in a useful form for decision makers. In fact, there is a widespread use of qualitative scales for quality-of-evidence communication, mostly in the form of short descriptive labels (e.g., ‘high’ or ‘low’ quality of evidence), sometimes accompanied by or symbolised by icons, such as by GRADE (Reference Guyatt, Oxman, Vist, Kunz, Falck-Ytter, Alonso-Coello and SchünemannGuyatt, Oxman, Vist, Kunz, Falck-Ytter, Alonso-Coello, et al., 2008), the Education Endowment Foundation (EFF, 2020), SAGE documents (UK Government, 2020), the Admiralty Code in military operations and intelligence analysis (Reference Irwin and MandelIrwin & Mandel, 2019), or the Intergovernmental Panel on Climate Change reports (IPCC, 2014; Reference Mastrandrea, Field, Stocker, Edenhofer, Ebi, Frame, Held, Kriegler, Mach, Matschoss, Plattner, Yohe and ZwiersMastrandrea et al., 2010). However, systematic evaluations of the effects of communicating quality of evidence on the audiences are sparse or largely non-existent.
It is conceivable that a cue that a particular claim is based on underlying evidence of high quality may act as a signal that such a claim can be trusted. It signals that potential gains can be taken from knowing the information and using the information in subsequent judgments and decision making. Conversely, it is conceivable that seeing a flag of low quality of evidence may act as a warning sign, making people less likely to use the information. Recent work on the effects of low and high quality evidence underlying the effectiveness of a public health measure supports this proposition; participants who were presented with a low quality-of-evidence indicator for the effectiveness of eye protection against COVID-19 perceived the evidence as less trustworthy, rated the intervention as less effective and in one of two studies indicated lower behavioural intentions to wear eye protection (Reference Schneider, Freeman, Spiegelhalter and van der LindenSchneider et al., 2021). What is more, in a second study which compared high and low quality-of-evidence information to a control group which did not provide a quality indicator, distance from the control group in terms of ratings of perceived trustworthiness and effectiveness differed for the high versus the low quality-of-evidence groups: while perceived trustworthiness and effectiveness were significantly lower in the low quality-of-evidence group compared to the control group, there was no significant difference between the high quality-of-evidence group and the control group (Reference Schneider, Freeman, Spiegelhalter and van der LindenSchneider et al., 2021). These results provide some initial insights that seem to suggest that people may react more strongly to indications of low quality of evidence compared to high quality of evidence.
Another important question is how people make judgments in response to information of explicitly uncertain quality. For example, what if — in a decision context — people are told explicitly that it is not known whether the quality level of the evidence is high or low (i.e., when the quality of evidence is ambiguous). Findings on ambiguity aversion suggest that “the subjective experience of missing information” (Reference Frisch and BaronFrisch & Baron, 1988, p. 152) would lead people to want to avoid uncertainty (Reference Fox and TverskyFox & Tversky, 1995; Reference Tversky and KahnemanTversky & Kahneman, 1974). Often referred to as “one of the most robust phenomena in the decision-making literature” (Reference Keren and GerritsenKeren & Gerritsen, 1999, p. 1), research on ambiguity aversion has shown that people prefer the clear over the vague or certainty over uncertainty across a range of contexts (Reference Camerer and WeberCamerer & Weber, 1992; Reference Keren and GerritsenKeren & Gerritsen, 1999). This is also an important practical question as it can be hard to assess quality of evidence comprehensively, especially in crises — such as during the COVID-19 pandemic — when urgent information turnaround and knowledge production are paramount. For example, policy makers and communicators might have an estimate of the case fatality rate at hand, but it might not be clear what the quality level of the underlying evidence is.
Our research thus asks the question of how people incorporate information on the quality of the underlying evidence into their judgments and decision making. Do they disregard quality when it is not certain and treat it as if the quality indicator did not exist? Do they assume the best, i.e., do they assume high quality in the absence of clarity? Or do they assume the worst, i.e., put it on par with low quality-of-evidence information? And how does disclosure of quality-of-evidence information, be it high, low, or ambiguous, compare to non-disclosure, namely, cases in which the quality of evidence is completely omitted and not even mentioned as a concept? Where do people’s reactions in terms of trust and decision making sit in those cases compared to when they are explicitly told that the quality of the underlying evidence is high, low, or ambiguous?
Another question of interest pertains to the mechanism that underlies possible shifts in perceived trustworthiness and decision making when people are presented with varying levels of quality-of-evidence information. Recent research suggests that conflicting studies and data (an aspect of quality of evidence) may trigger a sense of uncertainty and a feeling that no new knowledge has been gained, even though more data on the matter has accumulated (Reference Koehler and PennycookKoehler & Pennycook, 2019). Similarly, because consensus among experts is an influential judgment cue for people in many decision contexts (Reference van der Linden, Clarke and Maibachvan der Linden et al., 2015, 2019), disagreement among experts can also elicit an indirect sense of uncertainty which can negatively influence trust and decision making (Reference Aklin and UrpelainenAklin & Urpelainen, 2014; Reference Gustafson and RiceGustafson & Rice, 2020). Based on these indications from the literature with regards to the role of perceived uncertainty, we suggest that varying levels of quality of evidence could influence people’s perception of the uncertainty or certainty of the presented information, which could affect trust and decision making. In addition, recent empirical findings suggest that communicating quality of evidence can influence behavioural indicators through varying perceptions of trustworthiness (Reference Schneider, Freeman, Spiegelhalter and van der LindenSchneider et al., 2021). Taken together, it is thus conceivable that the provision of quality-of-evidence cues can influence people’s perceived uncertainty or certainty of the presented information, which could then account for changes in perceived trustworthiness and, in turn, decision making.
In short, despite some initial findings, much is still unknown about how people make judgments and decisions when confronted with cues about the underlying quality of the evidence — especially the question of how people react to ambiguous quality-of-evidence information — and what psychological mechanisms might explain such judgments, from quality perceptions through to decision making. The current research program seeks to remedy these gaps. We address these issues systematically, in the public health domain — using COVID-19 as a real-life context. With well over a million deaths worldwide (ECDC, 2020), there has perhaps never been so much emphasis on the need to “follow the science” and weigh up evidence. However, both the public and policy makers must make overt and wide-reaching decisions based on evidence that is of variable, uncertain, and often low, quality. It is thus crucial to understand how information about the quality of underlying evidence — or a lack of information about it — influences people’s appraisal of the evidence, their opinion of its trustworthiness, and behaviour as a result of it.
Accordingly, in three large-scale experimental studies, we explore how people react to high versus low versus ambiguous versus no quality-of-evidence information in the context of a COVID-19 public health message. We also investigate a potential psychological mechanism that could explain people’s reactions to quality-of-evidence cues. Study 1 assesses the effects of providing people with low quality-of-evidence information (compared to giving no quality cue, i.e., no mentioning of quality of evidence, not even as a concept). Study 2 investigates effects for high and ambiguous quality-of-evidence information. Study 3 constitutes our main confirmatory study which replicates and extends findings from Studies 1 and 2. Here we test effects of disclosure of low, high, and ambiguous quality of evidence versus non-disclosure against each other. We investigate effects on (a) perceived uncertainty of the provided information, (b) trustworthiness of the information, (c) and downstream decision making.
Based on the literature presented above, we hypothesized that (a) effects (distance from a control group that does not mention quality of evidence) for low quality of evidence are stronger compared to effects for high quality of evidence, and (b) we expected that people are averse to ambiguous or uncertain quality-of-evidence information (compared to more certain information on quality). We additionally test whether the effect of quality-of-evidence information on perceived trustworthiness could be mediated by perceptions of increased (or decreased) uncertainty and whether in turn perceived trustworthiness could mediate the effect on decision making. We furthermore test two different explanations for classifying evidence as either high or low quality (quality variations stemming from expert agreement or disagreement on the UK’s COVID-19 case fatality rate and quality variations due to high or low availability of data underlying the calculated case fatality rate) (Studies 1–3) and compare effects of providing an explicit explanation for the level of quality with giving people only the quality level indicator on its own, without further explanation (Study 3).
1.1 Overview of Studies
We ran three studies to investigate the effects of quality-of-evidence communication on perceived trustworthiness and decision making. Our studies are situated in a public health context, providing participants with the UK’s estimated COVID-19 case fatality rate alongside varying (or absent) quality-of-evidence information. At the time of data collection for each study, the current case fatality rate was taken from the website of the Oxford COVID-19 Evidence Service by the Centre for Evidence-Based Medicine (OCEM) at the University of OxfordFootnote 1, to provide participants with an accurate figure. During the time of data collection for our first study there was substantial uncertainty around the accuracy of reported COVID-19 case fatality rate estimates due to a variety of reasons influencing the quality of the underlying evidence, as outlined for example on the OCEM website. Sources of uncertainty included, for instance, difficulty determining the exact number of COVID-19 infections due to limitations in testing, or issues with the attribution of deaths to coronavirus (association-causation problem) and how exactly the numbers should be calculated. The available information on the types of issues affecting the quality of the evidence underlying case fatality rate estimates was distilled into our experimental manipulations of uncertain quality of evidence, namely, lack of data and disagreement between experts. For experimental purposes, in Studies 2 and 3 we vary the quantitative aspect of the quality-of-evidence information (i.e., the label for the quality level – high/low) — each compatible with the situation regarding the quality of the evidence base in the recent past. The qualitative aspects (i.e., the source – lack/availability of data and expert disagreement/agreement) remain consistent across studies.
At the time of data collection for Study 1, the case fatality rate in the UK was fairly uncertain, but it was more certain at the time of data collection for Studies 2 and 3. All participants received a debrief note in which this was clarified. They also received a note explaining that reported case fatality rates depend on aspects such as amount of testing that is conducted and were provided with the link to the OCEM website for further reading.
Apart from information from the OCEM website, the two experimental manipulations of sources of uncertainty in evidence quality used in this research, were also based on assessment of factors that contribute to ratings of quality of evidence by groups such as the Intergovernmental Panel on Climate Change (IPCC, 2014), who outline that the confidence in the validity of a finding is based, amongst other factors, on the amount of evidence and the degree of agreement. Expert disagreement and insufficient scientific evidence have also been highlighted as sources of uncertainty in health care (e.g., Reference Han, Klein and AroraHan et al., 2011). Finally, conflict and consensus (akin to ‘expert (dis) agreement’) and ambiguity (represented by our label ‘lack of data’) have previously been investigated as factors of interest by psychologists studying risk perception and decision making (Reference Baillon, Cabantous and WakkerBaillon et al., 2012; Reference Benjamin and BudescuBenjamin & Budescu, 2018; Reference CabantousCabantous, 2007; Reference Cabantous, Hilton, Kunreuther and Michel-KerjanCabantous et al., 2011; Reference Koehler and PennycookKoehler & Pennycook, 2019; Reference Roozenbeek and van der LindenRoozenbeek & van der Linden, 2019; Reference SmithsonSmithson, 1999, 2015; Reference van der Linden, Clarke and Maibachvan der Linden et al., 2015).
Studies 1 and 2 informed the design of Study 3 which constitutes our main, confirmatory round of data collection. All three studies were pre-registered online on the Open Science Framework (Study 1: https://osf.io/a3r6c, Study 2: https://osf.io/2f8dj, Study 3: https://osf.io/p9kbr). Data for all three studies were collected on the Prolific academic (prolific.co) and Respondi platforms (respondi.com), with half the sample for each study being collected on each platform.Footnote 2 All three samples constituted of UK residents and were national quota samples matched on age and gender to characteristics of the UK population.
2 Study 1
2.1 Methods
We start by assessing the effects of low quality-of-evidence cues in a three-group between-subject design. In total, 2,099 responses were collected between April 9-11th 2020. As per the pre-registration, participants who failed an attention checkFootnote 3 were excluded from the sample, resulting in a total sample of n = 1,942 for analysis purposes (47.68% male, 52.01% female, M age=45.61; see supplementary materials for detailed demographic composition). The study was powered (a priori) at 95%, alpha level 0.01 for small effects (f=0.1) (see pre-registration for more details).Footnote 4
Experimental conditions.
Participants were randomly allocated to one of three conditions, a control group and two low quality-of-evidence conditions.Footnote 5 All participants were presented with information on the COVID-19 case fatality rate which read: “Out of every 100 people in the UK who test positive for COVID-19, it is estimated that 8 will die. This is known as the COVID-19 case fatality rate.” Participants in the control group received no further information. Participants in the two low quality conditions in addition either read “The quality of the evidence underlying the reported case fatality rate is uncertain, because there is disagreement between experts” (Low-disagree) or “The quality of the evidence underlying the reported case fatality rate is uncertain, because there is a lack of data” Footnote 6 (Low-lack).
Measures.
After being presented with the case fatality rate intervention text, participants completed a variety of measures pertaining to the presented information. They indicated to what extent they thought that the COVID-19 case fatality rate mentioned was certain, on a 7-point scale from ‘not certain at all’ to ‘very certain’. This measure was used as a mediator for an exploratory mediation analysis. They also indicated their level of perceived trustworthiness of the presented information, which was measured via three items which were subsequently merged into an index measure (α = 0.94). The three items were: “To what extent do you think that the COVID-19 case fatality rate mentioned is accurate?”, “To what extent do you think that the COVID-19 case fatality rate mentioned is reliable?”, “To what extent do you think the COVID-19 case fatality rate mentioned is trustworthy?”, all measured on a 7-point scale from ‘not accurate/reliable/trustworthy at all’ to ‘very accurate/reliable/trustworthy’. These three items encompass the dimensions of trustworthiness as suggested by Reference O’NeillO’Neill (2018) which include competence and reliability. Participants subsequently responded to questions regarding intended use of the presented information for decision making. Two items, which were combined into an index as pre-registered (α = 0.75)Footnote 7, probed personal use in decision making as well as government use in decision making: “How likely are you to base your own COVID-19 related decisions and behaviours on the mentioned case fatality rate” (7-point scale ranging from ‘not at all likely’ to ‘very likely’) and “To what extent do you think the government should base its decisions on how to handle the pandemic on the mentioned COVID-19 case fatality rate?” (7-point scale ranging from ‘not at all’ to ‘very much’). Participants were also asked how much they thought was currently known about COVID-19. This measure however was found to be rather uninformative due to problems with its design. We therefore present all analyses for the knowledge measure, together with a discussion of the measure’s design issues, in the supplementary materials, as suggested by the reviewers.Footnote 8
2.2 Results and Discussion
2.2.1 Effect of uncertainty information on trust and decision making
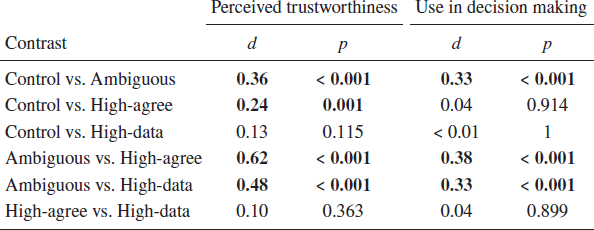
We investigate experimental effects on perceived trustworthiness and intended use in decision making. Sample means and confidence intervals per experimental group are visualized in Figures 1 and 2 (refer to the supplementary materials Table S2 for exact means and standard deviations per experimental group). Consistent with our pre-registration, a one-way analysis of variance (ANOVA) indicated a significant difference between experimental groups for both perceived trustworthiness (F[2, 1933] = 15.02, p < .001, η 2p = 0.015) and decision making (F[2, 1933] = 8.26, p < .001, η 2p = 0.008). Pre-registered post-hoc testing using Tukey HSD (Table 1) found that participants who were presented with low quality-of-evidence information as indicated through disagreement between experts (Low-disagree) perceived the information as significantly less trustworthy than a control group which did not receive any quality-of-evidence indication (Control) and indicated lower use of the information in decision making.Footnote 9 We find the same pattern of results for the group who was presented with low quality-of-evidence information as indicated through a lack of data (Low-lack). These participants perceived the information as significantly less trustworthy than participants in the control group and they indicated lower use of the information in decision making. No significant difference was observed between the two low quality-of-evidence conditions, either for perceived trustworthiness or decision making.

Figure 1: Experimental effects of low quality of evidence as indicated through disagreement between experts (middle) and lack of data (right) versus control (left) on perceived trustworthiness of the information. Horizontal lines and error bars denote sample means and 95% confidence intervals respectively. Violin plots visualize data distributions.
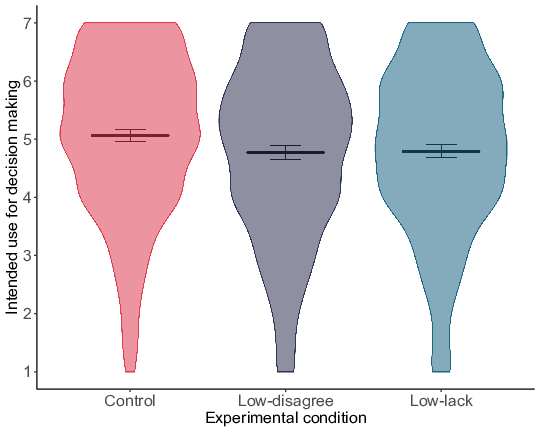
Figure 2: Experimental effects of low quality of evidence as indicated through disagreement between experts (middle) and lack of data (right) versus control (left) on intended use of the information for decision making. Horizontal lines and error bars denote sample means and 95% confidence intervals respectively. Violin plots visualize data distributions.
Results from Study 1 indicate that people react to cues that imply low quality of the underlying evidence. We find that people in the low quality-of-evidence groups perceived the information given to them as significantly less trustworthy and indicated significantly lower use in self- and other-oriented decision making compared to a control group.
Table 1: Study 1 pairwise comparisons — effect sizes and significance.

2.2.2 Mediation analysis
We use exploratory structural equation modelling (SEM) to investigate whether perceived uncertainty mediates the effect of quality-of-evidence information on perceived trustworthiness, which in turn influences decision making, including latent variables (Figure 3).Footnote 10

Figure 3: Structure of proposed serial mediation model. Model consisting of only the indirect effect paths. Effect directions throughout the model are hypothesized as follows: for experimental contrasts that lead to an increase [a decrease] in perceived uncertainty, we hypothesize a decrease [an increase] in perceived trustworthiness, which will in turn decrease [increase] indicated use in decision making. Latent variables are modelled for perceived trustworthiness and decision making for all three studies; and for perceived uncertainty for Study 3.
We use this serial approach to estimate the indirect effects using multiple sequential mediators. The experimental conditions act as an exogenous variable. To implement our structural equation models in R, we use the lavaan package (Reference RosseelRosseel, 2012), employing maximum likelihood estimation, with bootstrapped confidence intervals for the indirect effects (1,000 samples; using bias corrected adjusted bootstrap percentile method). In order to keep the amount of comparisons manageable, we limit ourselves to testing only those contrasts for which we find a significant direct effect of experimental condition on decision making within the SEM regression framework. Additionally, testing mediation for contrasts without a significant direct effect is considered less convincing. See supplementary materials for direct effects output tables. For Study 1 we formally test the following two contrasts: Control vs. Low-disagree and Control vs. Low-lack.
Results for Study 1 (Table 2) indicated good model fit to the data for both examined contrasts according to conventional guidelines; RMSEA and SRMR fit indices are below 0.06 and 0.08 respectively, and CFI indices are above 0.95 which indicates excellent fit (Reference Hu and BentlerHu & Bentler, 1999; Reference Lei and WuLei & Wu, 2007). We note that the χ ² goodness of fit test was significant for both contrasts. However, as this is a test of whether the hypothesized covariance structure is different from the real covariance structure (test of perfect fit), tiny and trivial variations might lead to significant test results for big sample sizes, despite the model fitting the data reasonably well. As our samples sizes are above 600 per experimental group it is likely that observed significant effects are due to sample size rather than an indicator of concerning levels of differences between observed and model-implied covariance matrices (Reference BentlerBentler, 1990; Reference Hu, Bentler and KanoHu et al., 1992; Reference Lei and WuLei & Wu, 2007; Reference McNeishMcNeish, 2018). Taken together, we thus believe the observed fit indices indicate good fit of the theoretically derived model.
Table 2: Structural equation model indirect effects and model fit for Study 1.
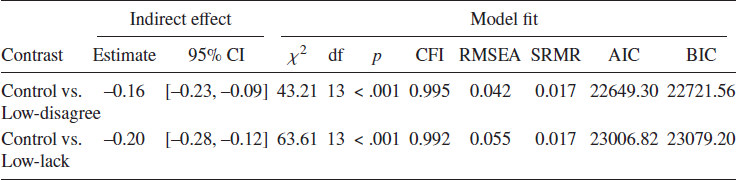
Indirect effects of all tested contrasts emerged as significant (bootstrapped confidence intervals not including zero). Results support the theoretical model laid out, namely that uncertainty mediates the relationship between quality-of-evidence information and perceived trustworthiness, and that trustworthiness, in turn, predicts decision making. Concretely, observed results suggest that being presented with low quality-of-evidence information, either due to disagreement between experts (Low-disagree) or lack of data (Low-lack), compared to information that did not include a quality-of-evidence indicator (Control), increased people’s perceived uncertainty of the information, which decreased perceived trustworthiness of the information, and in turn decreased use in decision making.
Our path analysis results point towards an increase in perceived uncertainty of the information as a potential cause for the observed effects on trustworthiness and decision making. Given the downward effects of low quality of evidence we wanted to test the extent of possible upward effects for high quality of evidence. We furthermore wanted to investigate how people would react to ambiguous quality-of-evidence cues. We hypothesized that we would find downward effects, given the literature on ambiguity aversion. We ran Study 2 to tackle these research questions.
3 Study 2
3.1 Methods
In Study 2, we therefore assess the effects of high and ambiguous quality of evidence. In total, 2,309 responses were collected between May 7-11th 2020. The final analytic sample post attention check failure exclusion was n = 2,155 (48.21% male, 51.6% female, M age=45.47; see supplementary materials for detailed demographic composition). Like Study 1, power calculation was based on a conservative alpha level of 0.01, estimated small effect size (f=0.1), and 95% power, to include a buffer for attrition due to exclusions.
Experimental conditions.
Participants were randomly allocated to one of four conditions, a control group, two high quality-of-evidence conditions, and an ambiguous quality-of-evidence condition. All participants were presented with information on the COVID-19 case fatality rate, with the same wording as in Study 1 (the actual rate information was updated to reflect the correct case fatality rate at the time of data collection). As in Study 1, participants in the control group received no further information. Participants in the two high quality cue conditions in addition either read “The quality of the evidence underlying the reported case fatality rate is fairly certain, because there is a high level of expert agreement” (High-agree) or “The quality of the evidence underlying the reported case fatality rate is fairly certain, because there is a large amount of data available” Footnote 11 (High-data). Participants in the ambiguous quality-of-evidence condition further read: “The quality of the evidence underlying the reported case fatality rate is uncertain. The quality of the evidence could be high or could be low” (Ambiguous).
Measures.
Using the same measures as in Study 1 participants indicated their perceived uncertainty of the presented information – for use as a mediator in a pre-registered mediation analysis, their level of perceived trustworthiness (α = 0.95) and their intended use of the presented information for decision making (α = 0.79).
3.2 Results and Discussion
3.2.1 Effect of uncertainty information on trust and decision making
As for Study 1, we investigate differences in perceived trustworthiness and intended use of the provided information for decision making across experimental groups. Sample means and confidence intervals per experimental group are visualized in Figures 4 and 5 (refer to the supplementary materials Table S4 for exact means and standard deviations per experimental group). Our pre-registered one-way analysis of variance revealed a significant main effect of experimental condition on perceived trustworthiness (F[3, 2149] = 36.23, p < .001, η 2p = 0.048). Specifically, post-hoc comparisons using Tukey HSD as pre-registered (Table 3) revealed that participants who were presented with ambiguous quality-of-evidence information (Ambiguous) perceived the information as significantly less trustworthy than a control group (Control), the high quality-of-evidence group indicated by expert agreement (High-agree), and the high quality-of-evidence group indicated by the availability of ample data (High-data). Additionally, results indicated that people in the high quality-of-evidence group as indicated through expert agreement (High-agree) perceived the information as significantly more trustworthy compared to control group participants (Control). However, people in the high quality-of-evidence group as indicated through availability of data (High-data) did not perceive it as significantly more trustworthy compared to people in the control group (Control). No statistically significant difference was observed between the two high quality-of-evidence groups.
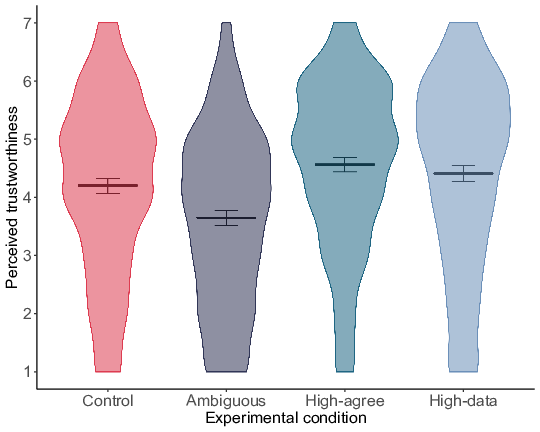
Figure 4: Experimental effects of high (agreement and availability of data) and ambiguous quality of evidence versus control on perceived trustworthiness of the information. Horizontal lines and error bars denote sample means and 95% confidence intervals respectively. Violin plots visualize data distributions.
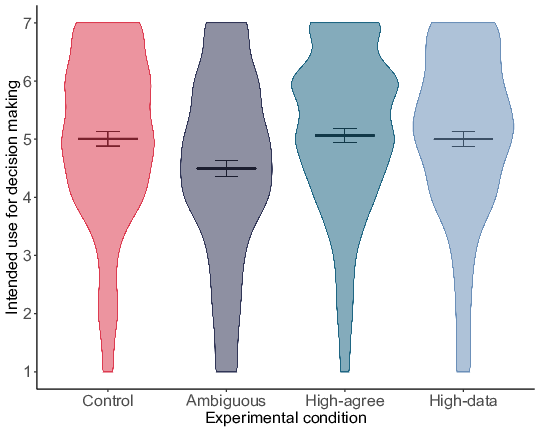
Figure 5: Experimental effects of high (agreement and availability of data) and ambiguous quality of evidence versus control on intended use of the information for decision making. Horizontal lines and error bars denote sample means and 95% confidence intervals respectively. Violin plots visualize data distributions.
Table 3: Study 2 pairwise comparisons — effect sizes and significance.
Results for use of the information in decision making revealed a similar pattern (F[3, 2149] = 16.86, p < .001, η 2p = 0.023).Footnote 12 Participants in the ambiguous quality-of-evidence group (Ambiguous) also indicated significantly lower use of the information in decision making compared to the control group (Control), the high quality-of-evidence group indicated through expert agreement (High-agree), and the high quality-of-evidence group indicated through ample availability of data (High-data). As opposed to trustworthiness, there was no significant difference between the high quality-of-evidence group indicated through expert agreement (High-agree) and the control group (Control). In line with trustworthiness findings, there was no significant difference between the high quality-of-evidence group as indicated by data availability (High-data) and the control group (Control), nor between the two high quality-of-evidence groups.
Findings from Study 2 confirmed our hypotheses regarding the ambiguous quality-of-evidence condition: We find a strong downward effect, such that people perceived the information to be less trustworthy and indicated lower use in decision making when they were presented with ambiguous quality cues compared to a control group. For high quality of evidence our results were somewhat mixed. Findings for decision making were in line with our expectations, such that we do not find a significant difference between the two high quality groups and the control group. For perceived trustworthiness we did find a small effect of high quality of evidence as indicated through expert agreement, with people perceiving the information significantly more trustworthy compared to control group participants. However, no significant difference between the high quality group as indicated through availability of data and the control group emerged.
3.2.2 Mediation analysis
As laid out in Study 1, we test whether quality-of-evidence information influences perceived uncertainty, to influence trustworthiness, and in turn decision making, via a structural equation path model. We investigate the following three contrasts for which we observed significant direct effects of experimental condition on decision making: Control vs. Ambiguous, Ambiguous vs. High-agree, and Ambiguous vs. High-data. As for Study 1, model fit indices overall indicated good fit of our model to the data (Table 4). See the Results section of Study 1 for details on how we evaluated our models.
Table 4: Structural equation model indirect effects and model fit for Study 2.
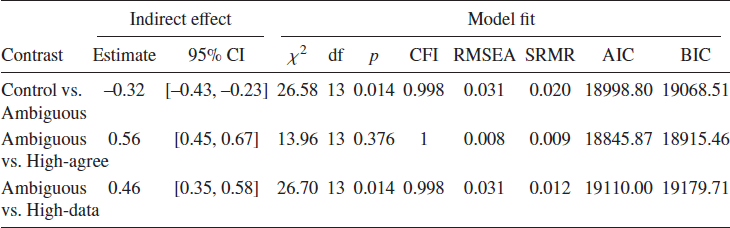
As in Study 1, indirect effects of all tested contrasts emerged as significant (bootstrapped confidence intervals not including zero), thus supporting our theoretical mediation model. We find that ambiguous quality-of-evidence information (Ambiguous), compared to no quality-of-evidence information (Control), led to an increase in perceived uncertainty, which lowered trustworthiness and in turn use in decision making. Providing people with high quality-of-evidence information, both indicated via agreement between experts (High-agree) and ample availability of data (High-data), compared to ambiguous quality-of-evidence information (Ambiguous), led to a decrease in perceived uncertainty, an increase in perceived trustworthiness of the information and, apparently in turn, an increase in use in decision making.
Path analysis findings replicate insights from Study 1, showing evidence that perceived uncertainty acts as a mediator of the effect of the experimental conditions on perceived trustworthiness, with trustworthiness in turn acting as a mediator of the effect on decision making. Because of the somewhat inconclusive findings around the effect of high quality of evidence and because Study 2 did not allow us to directly compare effects for high and low quality of evidence, we decided to include these conditions in a final confirmatory study. We were furthermore interested in pitting the effects of ambiguous quality of evidence against low quality of evidence. Results from our low quality-of-evidence conditions in Study 1 and from our ambiguous quality-of-evidence condition in Study 2 had revealed strong effects on people’s perceptions of trustworthiness and use of the information in decision making; however, given that the low and ambiguous quality-of-evidence conditions were run in two separate studies, we could not compare them directly to each other. Hence, we included the ambiguous quality-of-evidence condition in the final confirmatory study as well.
4 Study 3
4.1 Methods
Our final confirmatory study assesses the effects of low, high, and ambiguous quality of evidence together.Footnote 13 In total, 2,651 participants were sampled between July 6–9th 2020. The final analytic sample after exclusions was n = 2,392 (47.37% male, 52.38% female, M age=45.16; see supplementary materials for detailed demographic composition). The sample that we had powered for provided more than 95% power at alpha level 0.05 for small effects (f=0.1) and included a buffer to account for attrition, hence our final analytic sample is within the bounds of the power analysis.
Experimental conditions.
Participants were randomly allocated to one of eight conditions, a control group that did not provide any quality-of-evidence indicator, three low quality-of-evidence conditions, two high quality-of-evidence conditions, an ambiguous quality-of-evidence condition, and an additional low quality-of-evidence group serving as a robustness check, described below.Footnote 14 As in Studies 1 and 2, all participants received the information on the COVID-19 case fatality rate updated to the time of data collection. Participants in the three low quality conditions in addition read one of the following pieces of text: (1) “The quality of the evidence underlying the reported case fatality rate is low, because there is disagreement between experts” (Low-disagree) — which was the same condition as used in Study 1 for replication purposes, except for a slight wording change.Footnote 15 The additional low quality-of-evidence robustness check group repeated the exact wording from Study 1 to ensure that there was no significant difference between the two wording versions in terms of their effects on the outcome variables. Analyses confirmed that the two wording conditions were not significantly different. Details on the analysis are presented in the supplementary materials. (2) Another low quality-of-evidence experimental condition replicated the lack of data condition from Study 1 (“The quality of the evidence underlying the reported case fatality rate is low, because there is a lack of data”) (Low-data), and (3) the final low quality-of-evidence condition did not give any explanatory details but merely presented the quality-of-evidence level ‘label’, i.e., that it was ‘low’ (“The quality of the evidence underlying the reported case fatality rate is low”) (Low). The two high quality conditions followed the outlined rationale of the low quality-of-evidence conditions, by replicating the condition from Study 2 in one group (“The quality of the evidence underlying the reported case fatality rate is high, because there is a high level of expert agreement”) (High-agree) and using a ‘no explanation’ wording indicating merely that the quality level was ‘high’ (“The quality of the evidence underlying the reported case fatality rate is high.”) (High). Finally, the ambiguous quality-of-evidence condition (Ambiguous) was an exact replication of the one used in Study 2, using the exact same text.
Measures.
Outcome measures were identical to those presented for Studies 1 and 2 with only minor changes. To improve the reliability and statistical accuracy of the mediation analysis, the mediator (perceived uncertainty of the presented information) was measured via two items, which were presented on a separate page from the other subsequent measures. The two items were combined into an index (α = 0.94): “To what extent do you think that the COVID-19 case fatality rate mentioned is certain or uncertain?” and “To what extent do you feel that the COVID-19 case fatality rate mentioned is certain or uncertain?”, both measured on 7-point scales, ranging from ‘very certain’ to ‘very uncertain’. Subsequently, participants responded to the three trustworthiness items which were combined into an index as before (α = 0.95). Use in personal decision making was probed using the same items as in Studies 1 and 2. Use in government decision making had a slightly altered wordingFootnote 16: “To what extent do you think the government should base its decisions and recommendations on how to handle the pandemic on the mentioned COVID-19 case fatality rate?” (7-point scale ranging from ‘not at all’ to ‘very much’). Both items were combined into an index as before (α = 0.82).
4.2 Results and Discussion
4.2.1 Effect of uncertainty information on trust and decision making
Our last confirmatory study replicated and extended findings from Studies 1 and 2. We find differences in perceived trustworthiness and intended use of the provided information for decision making between the experimental groups. Sample means and confidence intervals per experimental group are visualized in Figures 6 and 7 (refer to the supplementary materials table S6 for exact means and standard deviations per experimental group). The pre-registered analysis of variance revealed a significant main effect of experimental condition on perceived trustworthiness (F[6, 2084] = 12.48, p < .001, η 2p = 0.035). As outlined in the pre-registration, Study 3 allowed us to not only compare low and high quality-of-evidence groups to the control group that did not give quality-of-evidence information, but to additionally compare them to the ambiguous quality-of-evidence group as well as to each other. As indicated in the pre-registration, we use Tukey HSD for our post-hoc comparisons (Table 5).
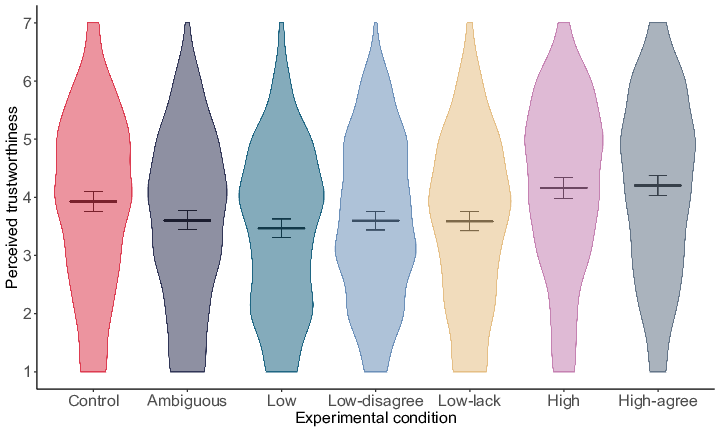
Figure 6: Experimental effects of high (agreement and no reason), low (disagreement, lack of data, and no reason), and ambiguous quality of evidence versus control on perceived trustworthiness of the information. Horizontal lines and error bars denote sample means and 95% confidence intervals respectively. Violin plots visualize data distributions.

Figure 7: Experimental effects of high (agreement and no reason), low (disagreement, lack of data, and no reason), and ambiguous quality of evidence versus control on intended use of the information for decision making. Horizontal lines and error bars denote sample means and 95% confidence intervals respectively. Violin plots visualize data distributions.
Table 5: Study 3 pairwise comparisons — effect sizes and significance.
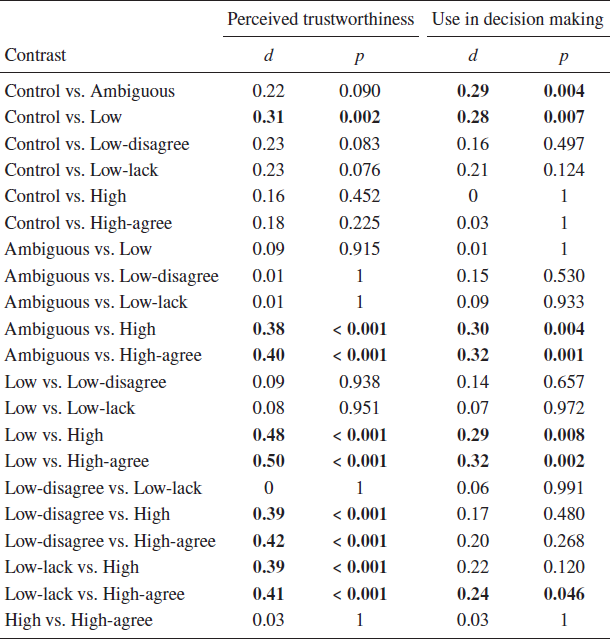
Looking at perceived trustworthiness of the information, we find that trustworthiness was lower for participants in the low quality-of-evidence groups (Low, Low-disagree, Low-lack) compared to participants in the control group (Control), in line with Study 1 results. This observed descriptive pattern was statistically significant for the low quality-of-evidence group that did not provide an explanation for the quality label (Low) compared to the control group (Control). The two low quality-of-evidence conditions that provided an explanation for the quality label, i.e., disagreement between experts (Low-disagree) and lack of data (Low-lack), were not significantly different from the control group (Control), despite substantial descriptive differences. Expanding on Studies 1 and 2, no significant difference was observed between the ambiguous quality-of-evidence group (Ambiguous) and all three low quality-of-evidence conditions (Low, Low-disagree, Low-lack). In line with results of Study 2, participants in both high quality-of-evidence groups, i.e., high quality of evidence without an explanation (High) and high quality of evidence as indicated by agreement between experts (High-agree), perceived the information as significantly more trustworthy compared to participants in the ambiguous quality-of-evidence group (Ambiguous). Furthermore, the two high quality-of-evidence groups (High, High-agree) were not significantly different from the control group (Control) in line with Study 2 (with the exception of the significant difference between the control group (Control) and expert agreement group (High-agree) for perceived trustworthiness in Study 2). Building on findings from Studies 1 and 2, a direct comparison between high and low quality-of-evidence conditions revealed a significant difference between both high quality-of-evidence groups and all three low quality-of-evidence groups. In line with the pattern observed in Study 2 we find that participants in the ambiguous quality-of-evidence group (Ambiguous) indicated lower perceived trustworthiness than participants in the control group (Control). However, this difference was non-significant in our post-hoc inferential analysis. Finally, the three low quality-of-evidence groups (Low, Low-disagree, Low-lack) did not significantly differ from each other; nor did the two high quality-of-evidence groups (High, High-agree).
Results for use of the information in decision making likewise revealed a significant main effect of experimental condition (F[6, 2084] = 6.15, p < .001, η 2p = 0.017), albeit less pronounced than for perceived trustworthiness, in line with findings from Studies 1 and 2. As in Study 1 conditions which presented participants with low quality-of-evidence information (Low, Low-disagree, Low-lack) resulted in lower indicated use of the information in decision making compared to the control group that did not mention quality of evidence at all (Control). However, only the difference between the low quality-of-evidence group that did not provide an explanation (Low) and the control group (Control) was statistically significant, not those between the two low quality-of-evidence groups that provided an explanation (Low-disagree, Low-lack) and the control group (Control). As for perceived trustworthiness, no significant difference was observed between the ambiguous quality-of-evidence group (Ambiguous) and all three low quality-of-evidence groups (Low, Low-disagree, Low-lack). Consistent with results for perceived trustworthiness in Study 3 and with decision making findings in Study 2, participants in both high quality-of-evidence conditions (High, High-agree) indicated significantly higher use of the information in decision making compared to participants in the ambiguous quality-of-evidence condition (Ambiguous). The two high quality-of-evidence conditions (High, High-agree) were not significantly different from the control condition (Control), in line with perceived trustworthiness findings in Study 3 and results for decision making in Study 2. Although both high quality-of-evidence conditions (High, High-agree) were descriptively higher on our measure of use in decision making than all three low quality-of-evidence conditions (Low, Low-disagree, Low-lack), unlike for trustworthiness, this difference was only statistically significant for some of the contrasts. In line with Study 2 findings for decision making, participants in the ambiguous quality-of-evidence condition (Ambiguous) indicated descriptively and inferentially lower use of the information for decision making compared to participants in the control condition (Control). Finally, the three low quality-of-evidence groups (Low, Low-disagree, Low-lack) did not significantly differ from each other; nor did the two high quality-of-evidence groups (High, High-agree).
In addition to replicating findings from Studies 1 and 2 with regards to the experimental effects of high quality-of-evidence, low quality-of-evidence, and ambiguous quality-of-evidence information against a control group that did not provide any quality-of-evidence indicator, Study 3 also allowed us to directly compare effects of providing high versus low quality-of-evidence information with each other, as well as low and ambiguous quality of evidence. We find that people react more strongly to low quality-of-evidence cues compared to high quality-of-evidence cues when comparing to a control group that did not receive any quality-of-evidence cue. We find a significant decline in perceived trustworthiness and use in decision making for low quality-of-evidence information that did not provide an explanation compared to the control group that did not give quality-of-evidence information. No significant differences between the high quality-of-evidence groups and the control group emerged, neither for perceived trustworthiness nor for decision making. Furthermore, insights from Study 3 reveal that the decrease in trustworthiness and use in decision making for low quality-of-evidence cues (compared to control) is about as pronounced as the decrease from ambiguity regarding the quality level (compared to control); we do not find a significant difference between the three low quality-of-evidence groups and the ambiguous quality-of-evidence group for any of our outcome measures. Comparing the three low quality-of-evidence groups against each other, and comparing the two high quality-of-evidence groups to each other, we do not find significant differences, suggesting that the addition or omission of a reason for the quality level, as well as the exact nature of the reason, did not seem to play a role in this context.
4.2.2 Mediation analysis
We test our structural equation path model for the following eleven contrasts (out of the twenty-one total contrasts) for which we observed significant direct effects of experimental condition on decision making: (1) Control vs. Ambiguous, (2) Control vs. Low, (3) Control vs. Low-lack, (4) Ambiguous vs. High, (5) Ambiguous vs. High-agree, (6) Low vs. High, (7) Low vs. High-agree, (8) High vs. Low-disagree, (9) High vs. Low-lack, (10) Low-disagree vs. High-agree, and (11) High-agree vs. Low-lack. As for Studies 1 and 2, model fit indices of our exploratory structural equation models were overall good (Table 6). For several contrasts the χ ² goodness of fit tests were significant (refer to the Results section of Study 1 for a discussion of the significance of a significant goodness of fit test). While sample sizes are lower in Study 3 compared to Studies 1 and 2, they are at around 300 per experimental group, thus large enough to allow to draw conclusions and gather insights from our models by conventional standards.Footnote 17 Indirect effects of all tested contrasts emerged as significant (bootstrapped confidence intervals not including zero), providing further support for our theoretical mediation model. Low and ambiguous quality-of-evidence information led to an increase in perceived uncertainty, and consequently a decrease in trustworthiness and decision making compared to control. High quality-of-evidence information led to a decrease in perceived uncertainty, which translated into an increase in perceived trustworthiness and decision making compared to low and ambiguous quality-of-evidence information.
Table 6: Structural equation model indirect effects and model fit for Study 3.

Our mediation analysis confirms findings from Studies 1 and 2, highlighting perceived uncertainty as a mediator in the effect of quality-of-evidence information on perceived trustworthiness, and, in turn, trustworthiness as a mediator in the effect on decision making.
5 General Discussion
5.1 Summary of main findings
Across three studies we provide insights into the effects of communicating indirect scientific uncertainty on perceived trustworthiness and decision making in a public health context. Comparing the communication of high and low quality of evidence, high quality-of-evidence cues lead people to perceive the information presented as more certain, more trustworthy, and use it more in decision making, while cues of low quality of evidence lead to lower perceptions and judgments of these. When comparing effects to a control group that was not provided with any quality-of-evidence information, we find an asymmetry in people’s responses: effects for cues of low quality of evidence (distance from the control group in the negative direction) are stronger compared to effects for cues of high quality of evidence (distance from the control group in the positive direction). Furthermore, ambiguous quality-of-evidence information leads to a decrease in perceived trustworthiness and use in decision making, about as pronounced as effects for low quality-of-evidence information.
5.2 Interpretation of main findings
Our findings regarding the role of high versus low quality-of-evidence information are in line with recent work on the public’s reactions to cues of evidence quality related to non-pharmaceutical public health interventions (Reference Schneider, Freeman, Spiegelhalter and van der LindenSchneider et al., 2021). One potential explanation of these results is that people value the potential gain from cues of high quality evidence less than that from the presence of a low quality cue (versus no quality indication). In other words, presenting people with cues of low quality of evidence may lead to a stronger decline in perceived trustworthiness and indicated use of the information in decision making than the increase in trustworthiness and intentions when presented with cues of high quality of evidence, taking the control group (i.e., not being given any quality-of-evidence indication) as a reference point. Relatedly, work on intuitive judgment looking at the relationship between strength of an effect and weight of the evidence, has found that people pay insufficient regard to high ‘credence’ of the evidence when the size of an effect is not particularly strong (Reference Griffin and TverskyGriffin & Tversky, 1992).
An alternative explanation is that participants in the control group, with no cues, interpret the information provided as based on high quality evidence: they have a prior that scientific-sounding evidence presented to them is likely of high quality. This would be in line with classic work on how mental systems believe, which argues that humans rapidly and automatically believe in information they understand, similar to how they believe in physical objects they see, and consequently behave as if that automatic belief is true (Reference GilbertGilbert, 1991; Reference Gilbert, Tafarodi and MaloneGilbert et al., 1993). So, in the absence of any cue as to the quality of the evidence that the case fatality rate information is based on, people automatically believe the information because they comprehended it easily, and act accordingly.
It is important to note that the experimental information given to participants did not mention any source, in order to avoid potential confounds stemming from attitudinal priors towards a particular provider of information. In contexts where information is tied to a source people may be more sceptical of the information depending on their priors, even without any quality-of-evidence indicator. Individual differences, such as pre-dispositions for science scepticism may additionally play a moderating role (Reference Brzezinski, Kecht, Van Dijcke and WrightBrzezinski et al., 2021). Furthermore, how exactly people interpret missing quality-of-evidence information may be context-dependent. For instance, in a context where it is the norm that quality-of-evidence information is provided, i.e., where the concept of quality of evidence is very internally salient to people and where there is an expectation to receive it, missing quality-of-evidence indication may be interpreted as a ‘red flag’ and cause people to behave more as they did in the ambiguous quality-of-evidence condition in our study. Future studies should investigate the relationship between people’s reactions to high quality-of-evidence indicators versus lack of any mention of the quality of evidence, potential automatic appraisal, the ease of comprehension of the information, as well as context-dependency of effects and contextual aspects such as the role of source and potential moderating influences in more detail. These would allow exploration of whether — and if so to what extent and in what ways — effects depend on a particular context or reflect attributes of quality-of-evidence perception more broadly.
Findings from our analysis of the ambiguous quality-of-evidence conditions confirm our predictions stemming from the literature on ambiguity aversion (Reference Keren and GerritsenKeren & Gerritsen, 1999; Reference Machina and SiniscalchiMachina & Siniscalchi, 2014), such that people react in a downward direction to ambiguous quality information. Levels of trustworthiness and use in decision making are about equivalent between the low quality and ambiguous quality conditions. Technically, in the ambiguous quality condition the quality-of-evidence level could be higher than in the low quality conditions. Nevertheless, ambiguous quality-of-evidence information leads to as steep a decline in perceived trustworthiness and indicated use in decision making compared to control as the ‘surely’ low quality conditions.
Following from the work on mental systems (Reference GilbertGilbert, 1991; Reference Gilbert, Tafarodi and MaloneGilbert et al., 1993), it may be that while people do not routinely question the reliability of information they are presented with (note that in the control group the quality of the evidence was not mentioned at all, therefore people might not think of it as a factor to consider when evaluating the presented information), the ambiguous quality-of-evidence information highlights and reminds people that information can theoretically be unreliable. From this perspective, if people presume that information is provided only when it is reliable, an unexpected cue that highlights the ambivalent quality of the evidence is informative to people because it might signal that the quality may be lower than expected.
5.3 Considerations for practice
Our findings suggest that the omission of any cues of quality of evidence on public health-related claims and statistics could lead people to trust the information more than might be warranted if the evidence is actually of low quality. Likewise, if people are presented with ambiguous quality-of-evidence cues they might discount the information.
How communicators choose to consider these implications and approach the communication of quality of evidence, may depend on the goal of the communications, namely, whether simply to inform or to persuade (change behaviour). In order to persuade, communicators might feel it is still ethical to omit the disclosure of low or ambiguous quality of evidence. For instance, in public health contexts where communicators might feel that the goal of persuading as many people as possible to adopt certain protective health measures justifies the omission of a classification of low or ambiguous quality of evidence. This might particularly be the case if the evidence quality is low because of a lack of data rather than if there is expert disagreement or conflicting data, and when the associated potential harms of adopting such measures are low. If the goal is purely to inform, however, communicators should aim to disclose uncertainties and honestly acknowledge limitations in scientific knowledge. This has been argued to be vital for informed decision making and the retention of public trust in the long run (Reference Han, Klein and AroraHan, 2013; Reference Kreps and KrinerKreps & Kriner, 2020; Reference Veit, Brown and EarpVeit et al., 2021). Further research on exactly what the public interpret terms such as ‘low’ and ‘high’ quality of evidence to mean will help clarify whether the cues are in fact honestly and correctly communicating the quality of the current state of the knowledge.
5.4 Potential underlying mechanism
Our work also provides initial insights into a potential underlying mechanism of the observed effects of quality-of-evidence communication. Replicated across all three of our studies we find that quality-of-evidence indicators shape how certain or uncertain people perceive the information to be, which influences their level of perceived trustworthiness, and in turn affects use of the information in decision making. Due to the exploratory nature of the full serial path model, we also investigated alternative viable models (presented and discussed in the supplementary materials; see also footnote 10). The balance of evidence — based on model fit evaluation using conventional rules of thumb and taking (non-)significance of indirect effect paths into account — overall speaks in favour of the serial model presented here, in which quality-of-evidence information affects perceived uncertainty, which affects trustworthiness, and in turn decision making. However, given the well-known limitations of mediation analysis (Reference Bullock, Green and HaBullock et al., 2010; Reference Green, Ha and BullockGreen et al., 2010; Reference Raykov and MarcoulidesRaykov & Marcoulides, 2001; Reference Tomarken and WallerTomarken & Waller, 2003), the exploratory nature of our path modelling approach, and the reliance on ‘rules of thumb’ (Reference Burnham, Anderson and HuyvaertBurnham et al., 2011; Reference Burnham and AndersonBurnham & Anderson, 2004; Reference RafteryRaftery, 1995, 1999) and descriptive comparisons for model evaluation, we refrain from making strong claims about the causal nature of the indirect effects and encourage future research employing confirmatory methods to investigate the underlying structure of effects in more detail.
5.5 Qualitative domain differences
We had set out to test possible domain differences in the context of quality of evidence. We explored the effects of availability of data (or lack thereof) versus expert agreement (scientific consensus) and expert disagreement (conflict). Stating that experts agree provides an explicit consensus signal (Reference van der Linden, Leiserowitz and Maibachvan der Linden et al., 2019). Stating that there is a lot of data available doesn’t necessarily provide the same signal, as the various sources could disagree or not be of high quality. Knowing the powerful role scientific consensus plays in judgment and decision making on debated science (Reference van der Linden, Clarke and Maibachvan der Linden et al., 2015, 2019), it could have been that, for the high quality-of-evidence condition, people would react more strongly to the ‘consensus’ messaging condition compared to the ‘availability of data’ condition. For the low quality-of-evidence conditions, research has shown that people respond negatively to consensus uncertainty in particular when compared to other kinds of uncertainty (Reference Gustafson and RiceGustafson & Rice, 2020). However, our data do not allow us to adjudicate in favour or against any of these explanations, as we did not find significant differences between the groups that provided different explanations for the quality of the evidence level in any of our three studies, nor, in Study 3, between these conditions and providing people with a mere quality-of-evidence ‘label’ (‘high’ or ‘low’).
It may be that providing a label for quality of evidence that is as concise and strong as ‘low’ and ‘high’ constitutes such a strong signal that it outweighs all additional information, or it may be that our manipulations were not strong enough to tap into the relevant constructs in this context. It may also depend on the kind of information. For instance, the context used in the present study — information on the COVID-19 case fatality rate — might have been quite abstract to people and not self-relevant enough to trigger an interest in the underlying reasoning. It is conceivable that in more immediately self-relevant contexts, for instance when it comes to choice of compliance with behavioural mandates or medical decision making, people might care more and be more interested in the reason for a quality-of-evidence level. However, perhaps people care more about the actual quality level and less about the reason for the label. Future research could be carried out in different contexts, and provide more detailed information on the reasoning, such as providing two or more expert estimates to illustrate what expert (dis)agreement looks like.
5.6 Limitations and future directions
Our work is not without limitations. We did not use probability samples to draw inferences on a population level. However, we did base our samples on national quotas which places the quality of our datasets above typical convenience samples frequently used in psychology research (Reference Kees, Berry, Burton and SheehanKees et al., 2017). A second limitation is that we used UK data for all of our studies. We therefore encourage replications with multi-country datasets to test the generalizability of observed effects across cultures. Of note is also the fact that the observed effect sizes for differences between control, low and ambiguous quality-of-evidence groups were small to medium (d = 0.19–0.36), with bigger effect sizes for differences between high and low and ambiguous quality-of-evidence groups (d = 0.24–0.50). Recent research on effect sizes in psychological research has argued that even small effects can be consequential and that effects of medium size do have explanatory power and can be of practical use (Reference Funder and OzerFunder & Ozer, 2019). We therefore believe that when considering quality-of-evidence communications on a population level, even small effects should be considered when making decisions about public communications. Unfortunately, our surveys could not collect true behavioural measures but rely on people’s self-reports; the ‘intention-action’ gap therefore has to be kept in mind (Reference Sheeran and WebbSheeran & Webb, 2016).
Notwithstanding these limitations, this set of studies is one of the first to explore how people make judgments and decisions about quality-of-evidence indicators in a public health context. Future work could test further aspects of quality-of-evidence communication; such as, for instance, the role of the source of the quality-of-evidence rating. It is conceivable that there could be important differences in how people react to quality-of-evidence information if the judgment on quality levels comes from, for instance, public health experts versus journalists or a credible versus unknown source. It would also be useful to test the generalizability of the presented quality-of-evidence relationships outside of high profile cases, such as the COVID-19 context used in this study, in addition to exploring potential moderating relationships, such as whether and how effects might vary by for instance political orientation, education, or science scepticism.


 Open access