


Introduction
Welfare for the poor in the UK has traditionally been characterised by work and family ethics and differentiation between deserving and undeserving groups (Millar, Reference Millar, Millar and Sainsbury2018, O’Hara, Reference O’Hara2020). During the past decade, policy has also been shaped by a determination to constrain public spending, direct resources towards older people rather than young families and those of working age (Lupton et al., 2016, Irving and Farnsworth, Reference Irving and Farnsworth2018) and enforce a work-centred benefit regime through more stringent control of claimers (Millar and Bennett, Reference Millar and Bennett2017, Etherington, Reference Etherington2020). The welfare state has become increasingly an instrument of social division (Taylor-Gooby, Reference Taylor-Gooby2016). Since, 2016, however, attitudes to provision for those of working age have become somewhat more supportive (Clery and Dangerfield, Reference Clery and Dangerfield2020) and there are indications that experience of the pandemic has strengthened this trend (IPSOS MORI, 2021).
The 2020 Covid19 pandemic led to exceptional policy measures, including a lockdown of society and an expansion of state spending to sustain businesses and support individuals. Public debt rose to the highest level since the war (OBR, 2020a). The numbers in food poverty escalated (Trussell Trust, 2020a), but a surge in public generosity enabled foodbanks to meet demand (Abrams, Reference Abrams2020). At the time of writing (September 2020) we face the near-certainty of an extended recession and high unemployment and the likelihood of further waves of the pandemic (OBR, 2020a; Academy of Medical Sciences, 2020).
The burst of generosity as the immediate response to the pandemic is striking in the overall context of welfare attitudes in the UK. It is associated with extra state spending on those forced out of employment through the furlough and self-employed income schemes, various loan programmes and enhancements to Universal Credit (UC). It can be understood in two ways: as building on a shift in attitudes to signify a transition to a “new normal” of social inclusion, or as a temporary and exceptional eruption of mutuality which will revert to the established pattern of divisive moralism (Demos, 2020) and meagre benefits for the working age poor as we re-enter the more familiar territory of recession and unemployment. There are now indications that most people believe the impact of Covid19 will be long-lasting. Between 27 March and 6 April 55 per cent of respondents to the ONS Opinions and Lifestyle survey expected life to return to normal within six months, a further 20 percent within 7 to 12 months and only 10 percent after a year or longer. By the week of 26 to 30 August the percentages had reversed to 14, 20 and 60 (ONS, 2020d, Table 7).
The paper examines patterns of generosity in response to Covid19 and falls into three sections: first, background: the recent trajectory of state provision for the poor, public attitudes and the growth of charitable support, the pandemic and social policy and the explosion of demand for foodbank provision in the UK; second, relevant theories, research questions, method and new data from a large time-series study of foodbank donations through major crowdfunding websites; and third, discussion, conclusions and policy implications.
The paper introduces a data-harvesting methodology so far little used in the field of welfare attitudes and shows that, so far as our evidence on foodbank giving goes, the surges in charitable funding and in public generosity are a temporary response to exceptional times rather than a transition to a new normal in which inclusion reflects need. This matters, since it is almost certain that the economic disruption of Brexit will succeed that resulting from Covid19, ensuring high unemployment and rising levels of poverty for some years (OBR, 2020a; HM Treasury, 2020).
1. Developments, 2010-2020
Attitudes, policy and outcomes: welfare for the working-age poor 2000-19
Public attitudes to support for the poor in the UK have traditionally been shaped by a logic that distinguishes deserving from undeserving (Taylor-Gooby and Mau, Reference Taylor-Gooby and Mau2010; Dean and Taylor-Gooby, Reference Dean and Taylor-Gooby1992). The annual British Social Attitudes survey measures the balance of generosity and suspicion through a welfarism scale which combines five variables. Average scores on the scale are generally negative, and stood at –11 percent in 2007. The score shifted upwards after the 2010 election and especially since the mid-2010s and had risen to +11 percent by 2018 (BritSocat, 2020). Similarly, identification of poverty as a key policy issue rose from eight per cent of the sample in 2020 to 20 percent by 2017 and has remained at that level (IPSOS MORI, 2021). However, in international comparisons the UK still appears as distinctively stigmatising of the jobless poor of working age. In the 2008 European Social Survey 66 percent of UK respondents agreed that welfare makes people lazy; the country came second out of 25 countries in anti-welfarism (ESS, 2020). There has been a slight shift toward more positive attitudes as austerity cutbacks bear harshly on the poor. By 2016 (the most recent year the question was asked), Britain came third, with 59 percent agreeing (ibid.).
Poverty has increased during the period since the 2007-8 recession, especially for children and families of working age (De Agostini et al., Reference De Agostini, Hills and Sutherland2018; CASE, 2021). Recovery from the 2007-8 recession has taken place at a very slow rate, the impact on living standards, especially for the poorest, being particularly severe. This resulted from the decision to reduce the deficit resulting from emergency spending, predominantly on banking and the business sector, mainly by cutting benefits and services rather than increasing taxation (Taylor-Gooby & Stoker, Reference Taylor-Gooby and Stoker2011). In fact the period over which the deficit was to be repaid extended from one to two parliaments, and then longer, partly because government actually reduced taxes on business and capital and to a smaller extent on incomes. The cuts took place in the context of the tortuous introduction of a new last resort benefit system (UC) which was repeatedly cut back, so that many of those receiving it were paid less than under the previous regime (Brewer et al., Reference Brewer, Joyce, Waters and Woods2019) and UC roll-out is associated with increased pressure on foodbanks (Reeves and Loopstra, Reference Reeves and Loopstra2020). Stringent cuts in local government support, by roughly half of the central government subvention during the decade, damaged state support for local charities (Taylor-Gooby and Leruth, Reference Taylor-Gooby and Leruth2018 ch, 2, Obolenskaya and Hills, Reference Obolenskaya and Hills2019).
Unemployment in fact fell rapidly from 7.9 percent in April 2010 to reach 3.8 percent at the end of 2018 and then plateaued until the first quarter of 2020 (ONS, 2020b), but the jobs that were created tended to be low-paid and insecure. The outcome was a gradual increase in poverty among those of working age, especially child poverty. Poverty (after housing costs at the 60 percent mean income level) stayed roughly constant between 1994-5 and 2012 at about 19 percent. It then rose to 22 percent by 2018-19 (IFS, 2020).
This is reflected in the numbers seeking work and claiming Jobseekers’ Allowance or UC, which fell from 2.25m in April 2013 to about 1.2m in June 2016 and continued at that level until claims started to rise in early March to 1.35 and then to 2.1 in April and 2.8 in May (DWP, 2020).
In this context, the foodbank movement expanded rapidly (Loopstra et al., Reference Loopstra, Fledderjohann, Reeves and Stuckler2018). The Trussell Trust, the umbrella organisation for some two-thirds of foodbanks, with 1,252 members by 2020, reports an increase in demand from 41,000 to 1.2 million food parcels from 2010 to 2016 (HoC, 2020a, 2020b). The Independent Food Aid Network, which accounts for most of the remaining foodbanks (842 members, 2020), reports an even more rapid expansion. Foodbanks have become an established part of the UK NGO landscape and enjoy high popularity. A survey in September 2019 shows that 87 percent of a population sample believe that “hunger is a problem in Britain today” and that a third had given food to a foodbank during the past year (Trussell Trust, 2019). In practice there may be limitations to the effectiveness of foodbanks in meeting need, especially for minority ethnic and religious groups (Power et al., Reference Power, Doherty, Small, Teasdale and Pickett2017), but their public image remains positive, and support for them provides a useful measure of public generosity to vulnerable groups.
To summarise, welfare provision has been cut back and the division between benefits for those of working age and others has become more marked. In the past few years as poverty rose even higher there are indications of greater sympathy for the working age poor, suggesting the possibility of a major shift in attitudes.
Covid19: The pandemic, the UK government response and its impact on welfare for the poor
The first pandemic cases were identified in Wuhan, China in December 2019. Detailed accounts of the spread of the disease, the International Public Health Emergency declaration by WHO on 30 January 2020 and Pandemic Declaration on 11 March are available elsewhere (WHO, 2020). Here we focus on the UK experience.
The first cases were confirmed in the UK in York on January 31 2020 and the first death in Reading on March 5 (Wiki, 2020). The government issued guidance to travellers on 6 February and later in February but did not move from a “contain” to a “delay” phase in its planning until 12 March, when the “track and trace” system for those in contact with an infected person was shut down. Official guidance encouraged people to avoid public transport and gatherings, maintain distance from others and work from home where possible. The number of cases that day was 136 with one death. Government appeared to be pursuing a “herd immunity” strategy which seeks to build resistance by allowing the disease to spread, but official statements were unclear. Cases escalated and on 20th March an emergency budget was passed. On 21 guidance that vulnerable groups should shield by self-isolating was issued and on the 23 a lockdown was imposed requiring all except identified “essential workers” to remain at home with one exercise outing a day. Schools and all places of gathering, including cafes, pubs, hotels and all but essential shops were closed and people required to work from home. By 26 March the daily number of new cases stood at 2590 and of deaths at 284.
Cases continued to rise and peaked at more than 32,000 a week in mid-May, with the death-rate for those who had tested positive to the virus in fact peaking in official statistics in mid-April at more than eight and a half thousand a week. There is considerable controversy about the recording of deaths, especially in care homes and the community, suggesting that the discrepancy between death-rates (which one would expect to track numbers of confirmed cases rather than anticipate them), and cases is artefactual. Death-rates which include all cases where Covid19 was mentioned on the death certificate were about a quarter higher and the excess of deaths above normal rates for the time of year about fifty percent higher (ONS, 2020c).
Controversy surrounds the delay in lockdown, the supply of ventilators and protective equipment, the closure and then re-establishing of a testing and contact tracing system, the treatment of those in care homes and their staff, the data on cases, deaths and numbers tested, the success of tests, the awarding of contracts to private organisations with little experience in public health, changing claims about new technologies and new vaccines and other factors. A further issue is that the unexpected announcement of a phased ending to the first lockdown in late May when the daily death toll was above 2000 a week appeared to be driven more by a concern to defuse public anger over lockdown-breaking by the Prime Minister’s most senior adviser (BBC, 2020a) than by science. The evidence that by July the UK has achieved the most protracted epidemic and figured among the five highest death-rates per head of population globally is a cause for serious concern (John Hopkins University, 2020).
The response in welfare terms included “furloughing” (payment to employers of up to 80 percent of pay up to £2,500 a month for workers retained on the payroll, applied for by 79 percent of businesses by May: PWR, 2020), an increase in UC and Statutory Sick Pay of £20 a week (subject to the various benefit caps and other minor adjustments), a scheme to provide free school meals for children at home through vouchers or food parcels from 31 March, an extra £1.6bn (doubled on 18 April) to local authorities to compensate for lost revenues and council tax remissions, and £3.2m for charities, and a benefit scheme for small and one person self-employed people who could provide accounts for the previous tax year to top-up their earnings to a maximum of £2,500 a month for three months, but not introduced until 1 June. This scheme failed to cover some 1.8m self-employed people and 700 thousand owner-managers who did not meet the conditions (IFS, 2021). In addition the government established a three-month mortgage holiday and eviction moratorium for most tenants until 30 June, later extended for a further three months, and an ambitious £3.6m scheme to accommodate all street homeless in hotels financed until the same date. Substantial numbers received no support from specific schemes, leading to the near doubling of UC claiming from 290 to 550 thousand between 23 March and 21 June 2020, during the first lockdown (Chart 6)
In addition the UK government developed four loan schemes for different categories of business which had by the end of July disbursed £76.4bn with defaults of more than £18bn anticipated (OBR, 2020b 9) and council tax and in some cases VAT remission schemes and one-off grants. The loans were taken up by 31 percent of businesses (PWR, 2020). The entire package is generous by international standards, with the extra welfare component (£60bn committed overall for 2020-21, if the Job Retention scheme, (£42bn) and £7bn on enhancements to UC are included) being comparable to that of the European leader, Germany (Breughel Institute, 2020). The impact of spending and tax foregone on government borrowing in 2020-21 was estimated on 14 July at £322bn, taking the budgetary deficit to £104bn (OBR, 2020).
One striking feature of the UK’s Coronavirus individual welfare package is that it retains the traditional division between workers and workless. This is highlighted by the fact that the furlough scheme (9.5 million workers retained on payrolls, but only about half that number at any one time, Tomlinson, Reference Tomlinson2020) provides on average 91 percent replacement rate (Resolution Foundation, 2020). The success of the scheme is indicated by the fact that employment fell by only two percentage points although hours worked fell by 24 percent (Benzeval et al., Reference Benzeval, Jonathan Burton, Crossley, Fisher, Jäckle, Hamish and Read2020). By contrast UC (which goes to the 2.8m households with 4.2m members who lost their jobs by April – DWP, 2020b) provided an average 53 percent replacement. The weakness of the enhancements to the scheme in the face of the benefit, housing and child caps is indicated by the fact that in practice they raise the replacement rate by only two percent. Another way of looking at it is that government schemes enhance the income of the lowest quintile by just five percent (Economics Observatory, 2020).
In addition to employment status, age, ethnicity and gender are also fault-lines of division. A national population survey with a BAME boost sample carried out during the summer of 2020 (Runnymede Trust, 2020) shows that BAME people are roughly half as likely again as white people to have had a positive Covid test and five times as likely to have been hospitalised for the disease. The report links higher risk levels among this group to higher overcrowding, employment in public-facing jobs and as key workers and use of public transport (ibid.3). They are roughly twice as likely to have suffered financial impact and less likely to be aware of government advice and lockdown measures and of the financial support available (ibid.4).
ONS analysis confirms that, after taking account of demographic, socio-economic and health-related factors, the increased risk of infection and death among all BAME groups (except Chinese) is more than twice as great compared with the white population: 3.8 times as great for Black African men and 2.8 times for Black African women (ONS, 2020 e, fig.4.). Further work by the Cabinet Office Racial Disparity Unit (Cabinet Office, 2020) attributes the increased risk to poverty and social disparities.
Recent work at the Institute for Fiscal Studies has shown that workers under the age of 25, the majority of them women, are two-and-a-half times more likely than older workers to be employed in sectors such as hospitality and non-food retail that have closed almost entirely. Women are more likely than men to be penalised by child-care responsibilities in households working from home (Harvard Business Review, 2020). The lowest-earning 10 percent of workers were fully seven times as likely as the highest earners to work in sectors that have closed. They are also much less likely to be able to work from home. A further issue impacting on low-income families is that the free school meals scheme had a low income threshold (£7,400) and that three weeks after implementation about 55 percent of entitled pupils were still not receiving vouchers (Dickens, Reference Dickens2020).
Those young people leaving school or graduating from university this summer are likely to be affected especially badly. They enter the labour market during a severe recession. We know from previous experience that this will reduce job opportunities and result in wage cuts, and that these effects will persist for many years (P. Johnson, Reference Johnson2020; Greg and Tominey, Reference Greg and Tominey2020).
The groups most vulnerable in the labour market were most vulnerable in the lockdown and were least well protected by the government response. This led to a rapid escalation of demand for support from foodbanks, exacerbated by short-term disruption to food supplies from closures, staff absence and panic-buying (BBC, 2020b). Trussell Trust reports a 122 percent increase in demand for its foodbanks in March compared with the same month last year followed by 90 percent extra demand in April (Trussell Trust, 2020a, Guardian, 2020). IFAN foodbanks report a 175 percent increase from February to April 2020 (IFAN, 2020). Trussell Trust note that demand for children’s food parcels rose even faster to more than double, reflecting the number of young families in food crisis. The most striking leap in demand, when the increase exceeded 250 percent, occurred in the third week of March, when lockdown began. The fact that foodbank demand did not recede as the first lockdown came to an end but has continued to rise shows that the short-term disruption has been succeeded by long-run factors in explaining the expansion of need.
Food Foundation surveys corroborate this picture, reporting 16 percent of households experiencing food insecurity in late March which fell to nine percent by late April (Food Foundation, 2020, see ONS, 2020a). Trussell Trust predicts a further rise in demand of over sixty percent by December using the OBR unemployment projections (Trussell Trust, 2020b).
From early June the government started to move towards an ending of lockdown, with a plan to reopen schools (later scaled back to years 1 and 6 only) for the last two weeks of the summer term from 1 June, a reopening of non-essential shops from 15 June (together with regulation to require face-masks on public transport), with pubs, cafes and other meeting places opening from 4 July, leading to a future “roadmap on exiting lockdown” in a speech on 17 July (Johnson, Reference Johnson2020b). The OBR’s July 14 Coronavirus modelling puts unemployment at 11.9 percent in the central scenario in the fourth quarter (OBR, 2020a). The Brexit settlement is at present uncertain, but is likely to exacerbate the contraction.
In practice the winding down of the first lockdown has been succeeded by local lockdowns, the first in Leicester from 30 June and then a series of local measures, mainly in northern England and the greater Glasgow area, although including south-east Wales. The opening of air travel to a number of overseas holiday destinations considered safe also appears to have provoked local outbreaks and led to requirements on returning travellers to self-isolate. Official encouragement to pursue a return to work and to modified normal schooling from late August into early September has encountered a sharp rise in infections, resulting in a strengthening of social distancing and public health precautions within a normalisation framework (Coronavirus guidance, August 2020). At the time of writing the future trajectory of Covid19 and of public responses to it is unclear, but recession, high unemployment, greater pressure on benefits, rising food poverty and an unrelenting demand on foodbanks are anticipated. This paper focuses on the first lockdown and the extraordinary public response in generosity to foodbanks through crowdfunding websites.
2. Our research
Viruses do not discriminate between individuals in relation to social status as societies often do. In this sense the events of early 2020 can be seen as a threat against which “we are all in this together”, although policy responses in fact treat different groups differently. As pandemic recedes and issues of recession, unemployment and Brexit return, all of which are foci of political division (Hobolt, 2016), one possibility is that the Covid19 experience helps rebuild a sense of common interest and mutuality (Fonseca et al., Reference Fonseca, Lukosch and Brazier2019, Abrams, Reference Abrams2020). Another is that the former divisions, characterised by stigmatisation of the working age poor, will again become dominant.
Britain is often seen as a divided nation in which social cohesion is in decline (Clark and Heath, 2016; Kennedy, Reference Kennedy2020; Thane, Reference Thane2018; Taylor-Gooby, Reference Taylor-Gooby2016). Division in the world of welfare for the working poor centres on stigma, dependency and deservingness. Van Oorschot summarises the substantial literature on the bases of deservingness, drawing on previous work by Coughlin and Lomax-Cooke, in terms of five factors: poor people’s responsibility for their need; need: the greater the level of need, the more deserving; identity: the closer to ‘us’, the more deserving; attitude: poor people’s docility or gratefulness; reciprocity: the extent to which they have earned support (van Oorschot, Reference van Oorschot2000).
Pandemic, as a common threat which is beyond individual responsibility and generates clear common needs, may promote a sense of shared identity. As the Prime Minister put it in his “all in it together” speech announcing the lockdown: ‘in this fight … each and every one of us is directly enlisted. Each and every one of us is now obliged to join together …We will beat the coronavirus and we will beat it together’ (B. Johnson, Reference Johnson2020). ONS reports 55 percent of adults felt a sense of belonging with other residents in their local community, while 68 percent believed people are doing more to help others since the coronavirus outbreak. Over half reported checking on neighbours who might need help; more than a quarter said they had gone shopping or done other tasks for neighbours (ONS, 2020d). Other surveys show similar findings (Guardian, 2020b).
Conversely, unemployment introduces an element of personal responsibility for need. From the perspectives of both identity and control, unemployment is more likely to be bound up with stigma, suspicion and reluctance to donate than pandemic. A number of commentators (Rothstein, Reference Rothstein1998; Dean and Taylor-Gooby, Reference Dean and Taylor-Gooby1992) argue that social institutions affect the poor’s perception of themselves and also how others see them. Means-testing and work-testing demonstrate that the claimers have failed to meet their own needs and are seen as potentially lazy, both factors reinforcing their lack of perceived desert.
To summarise, when need is seen through the lens of pandemic which is unseen, destroys jobs and affects us all, the first three of van Oorshot’s categories score on the side of deservingness. The gratefulness and capacity for reciprocity of recipients is not obviously related to infection. Conversely, unemployed people are more likely to be seen as undeserving, the more so as we move away from lockdown so that the majority return to work and perceive the needs of those who do not as a matter of individual responsibility among a defined and socially distant group who are unable to reciprocate. The suggestion is that many people will tend to stigmatise the poor of working age after the pandemic ends.
One indicator of cohesion concerns public generosity to other socially distant groups, strikingly displayed during the pandemic. In fact the income of charities as a whole increased by 18 percent between January and July 2020 and cashless giving doubled with an increase of donations to Covid-related causes of about 15 percent of total giving (CAF, 2020a, 2). Appeals and donations to online crowdfunding websites provide a good measure of individual generosity, since they are very easy to establish and to give to and are readily publicised, especially through social media. Foodbanks in particular have very high public visibility, meet an obvious need in hard times and are viewed positively by most people. Online crowdfunding data has limitations. The companies claim that the income to local charities through online digital platforms exceeds £2bn currently and is growing rapidly (UK Giving, 2020). This compares to a total income for small charities (under £100k annual income) of about £9.5bn, currently in decline (NCVO, 2020), and corresponds to survey data from individuals of the amounts they give online (CAF, 2020b). This indicates that online giving is currently about 22 percent of total giving and is increasing, and that women and younger people are most likely to donate to UK poverty relief, such as foodbanks (CAF, 2020b 14-15).
This indicates that crowdfunding for charities is a small but growing share of the market and may tend to be used to a greater extent by particular social groups. Trends in the data can helpfully complement the more familiar attitude studies of people’s feelings about need in their community. One strength is that the data is action-based and concerns money gifts which most people in our society value, rather than responses to attitude questions in a structured questionnaire, which may be subject to problems of ambiguity, context, sampling and interpretation (Goerres and Prinzen, Reference Goerres and Prinzen2012). A second is that the data allows researchers to follow trends closely over time and relate them to other developments (Taylor-Gooby and Petricek, Reference Taylor-Gooby and Petricek2020). A third is the convenient availability of the data.
Hypothesis
Our claim is that many people feel both a sense of solidaristic commitment to the vulnerable during the exceptional conditions of lockdown, when many people cannot work, and a strong suspicion of unemployed people, even during a recession, when the vast majority of working age people are in paid jobs. This leads us to hypothesize that the expansion of popular support for foodbanks in March and early April will follow the trajectory of pandemic and lockdown, rather than that of the long-term needs associated with impoverishment as a result of joblessness.
Data and Methods
We use the numbers of appeals established and of donations made to foodbanks through online crowdfunding websites to estimate the range and depth of public generosity, and of people receiving UC (UC) (the chief last resort benefit for people of working age) as a measure of need among those most profoundly affected by the lockdown. The number receiving UC expanded rapidly at the beginning of the first lockdown from less than three million people in February to more than five and a half million by June 2020 (DWP, 2020). DWP statistics of the numbers receiving the benefit give monthly counts (second Thursday of each month). The weekly estimate is by interpolation.
This project analyses data harvested from the three leading charitable crowdfunding websites used by individuals and by charities and NGOs in the UK. These are GoFundMe, JustGiving and VirginMoneyGiving. GoFundMe is the market leader, a US for-profit company, which established a UK operation in 2017. It does not file accounts in Companies House but claims to have raised $9bn overall between 2010 and 2019. JustGiving, a US for-profit company, also does not file UK accounts but claims to have raised £4bn globally between 2010 and 2019, nearly one billion in the UK. VirginMoneyGiving, a UK-based not-for-profit company has raised £813m since 2009, £110m in 2018-19.
We developed software to gather information on appeals in the UK, harvesting the start-date, number of donations, total amount raised and end-date, if appropriate. The websites classify appeals by sector, including foodbanks as a category, and give access to the data in anonymised form. We stored information on password-protected websites to enhance further the standard of data protection. We repeated sweeps at two-week intervals from 17 May which enables us to capture data on all appeals from the week before our first sweep, since no appeal in the entire dataset lasts less than one week. Our hypothesis requires data from before 23 March, the date on which the lockdown was imposed. Here we report data harvested up to 21 June covering 1765 separate appeals.
The mean amount raised by an appeal in our dataset is £1251 and nearly a third of appeals raise less that £100. Most appeals are short-lived – for example, a sponsored run or a public head-shaving on a particular date. Sweeps from 17 May onwards include full information on appeals that lasted ten weeks or longer and started on or after 8 March since such appeals will still be extant in data gathered on 17 May. However examination of the data from the sweeps after 17 May divided up by the weeks in which each appeal began shows that four-fifths (79 percent) last longer than ten weeks, but 11 per cent last four weeks or fewer and 10 percent are of intermediate duration (four to ten weeks). The sweeps after 17 May miss the one fifth of appeals lasting fewer than ten weeks in the previous period, since such appeals may have started, completed and disappeared from the data before our first sweep. We do have full information on the trajectory of appeals lasting more than four but fewer than ten weeks starting from 19 April onwards, since such appeals are contained within a dataset starting on 17 May and stretching to six weeks later. We can use this data to examine the life-cycle of intermediate appeals and the ratio of intermediate to long-term appeals. For shorter appeals lasting up to four weeks we have data for those starting from 3 May onwards.
Charts 1 and 2 display the raw data on appeals and donations included in the data. These show a rapid increase in numbers of appeals and an even faster increase in amounts raised, building to a peak on 26 April and then declining, corresponding to Covid19 deaths which peaked in the week of 19 April. However, appeals shorter than ten weeks that finished before the date of our first sweep may not be included. The evidence of the period after 17 May is that these make up a noticeable proportion of all appeals and account for a substantial but rather smaller proportion of donations. Our raw data show a major increase in giving in the early period but risk overestimating it, since appeals in early March are less likely than appeals in late April to still be running when data is harvested from May 17.
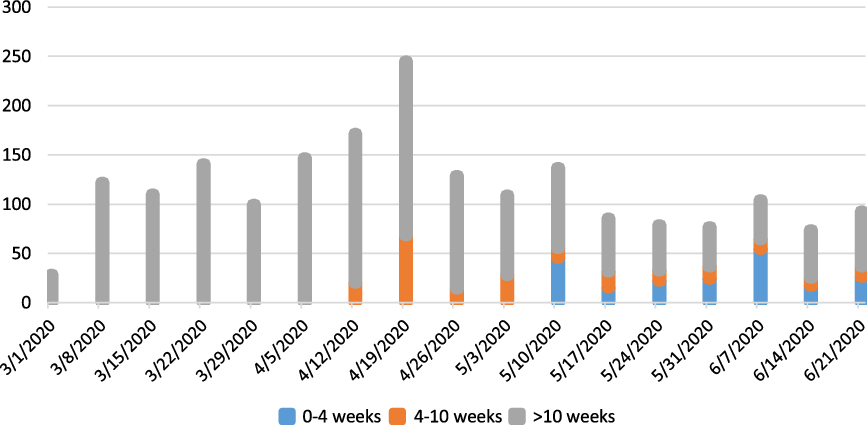
Chart 1. Appeals Started Each Week by Duration of (MHCLG 2020) Each Appeal (harvested data)
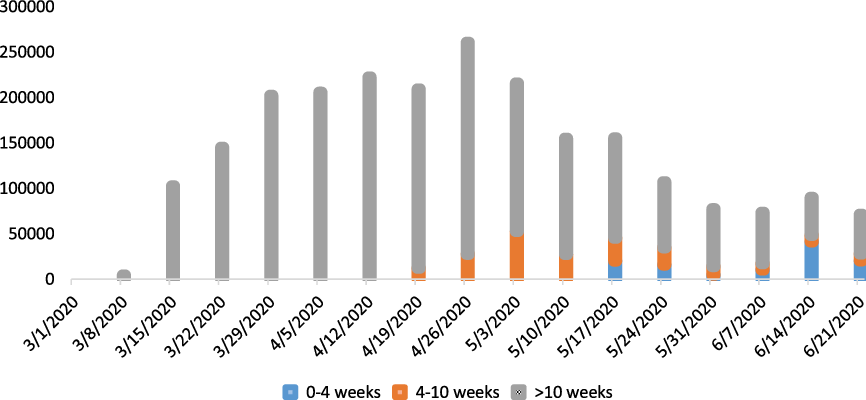
Chart 2. Amounts Donated Each Week by Duration of Each Appeal (harvested data; £)
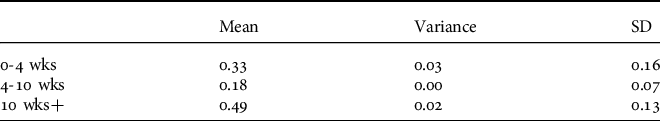
We estimate the numbers of appeals and amounts raised on the basis of the data harvested in the sweeps between 17 May and 21 June. Tables 1 and 2 display the proportions of numbers of appeals extant each week and of amounts raised in each of our categories (less than four, four to ten and ten plus weeks), together with variance and standard deviations. Assuming that the proportion of appeals by duration remains constant over time, we then apply the data on the ratios of short and medium-term to longer appeals and the amounts they raise to estimate the numbers for the period stretching back to before the beginning of the lockdown. We use standard deviations as a widely-used measures of the dispersion of a dataset about the mean to indicate the likely range of variation in our estimates of the proportions of numbers of appeals running each week and amounts raised each week, over the period for which data is gathered. We add the estimates of earlier short-lived appeals to the data displayed in Charts 1 and 2 and included upper and lower one standard deviation bounds in Charts 3 and 4.
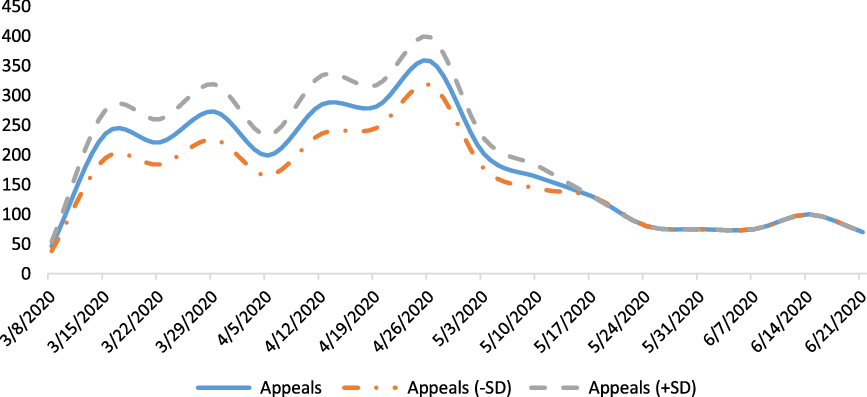
Chart 3. Number of Appeals Started Each Week (including estimates for short and medium-length appeals pre-May 17)
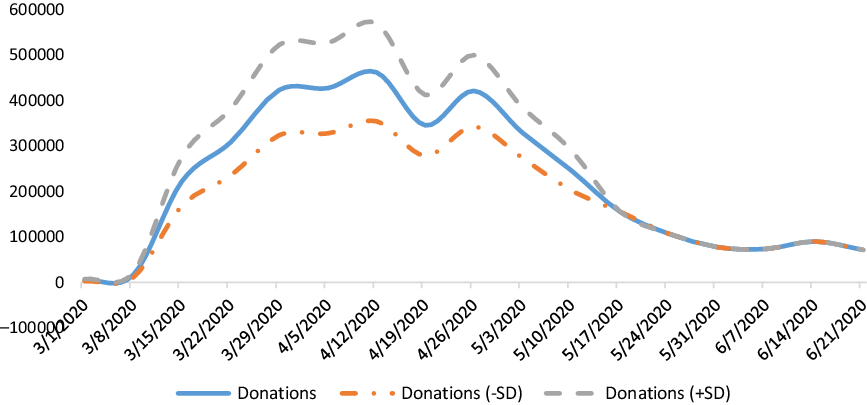
Chart 4. Amounts Donated Each Week (including estimates for short and medium-length appeals pre-May 17; £)
Table 1. Proportion of All Appeals Running Each Week of Different Durations
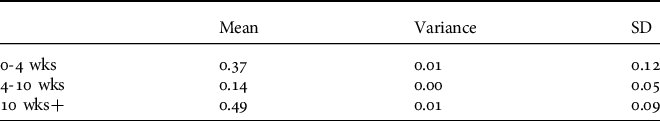
Table 2. Proportion of Amount Donated Each Week Given to Appeals of Different Duration
These show two things: first, the escalation in appeals and amounts donated started in the run-up to the lockdown is even steeper than that shown in the uncorrected data when estimates of the shorter-lasting appeals and donations are added. This indicates the strength of the response to the Covid19 crisis from crowdfunding donors. Secondly, the trajectory of total amounts given took off rather more slowly than the appeals but tracked them closely and rose rapidly to peak at nearly half a million pounds in small donations by the public in the week of 12 April, slightly before the number of appeals reached its apogee, and then continued at an exceptionally high level with a second peak in late April followed by a gradual decline. Chart 5 shows the vitality of public generosity in the fact that the amounts raised by each appeal also increased very rapidly and stayed at a relatively high level before slowly declining.
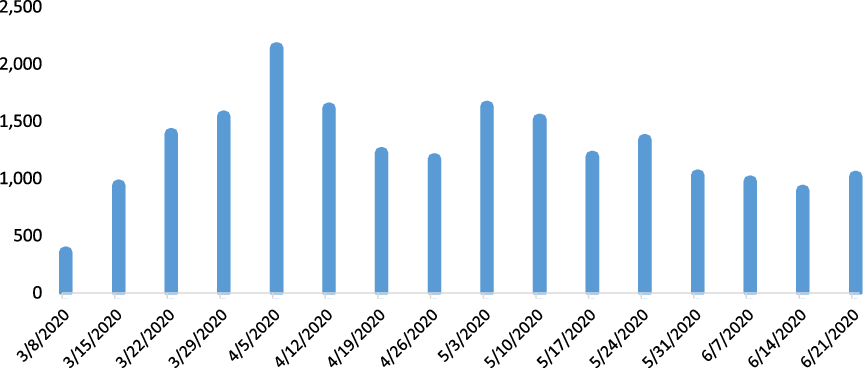
Chart 5. Mean Amount Raised Each Week per Appeal (£)
Cases, Deaths, Need and Public Generosity
We go on to examine the relationship between generosity and the progress of the pandemic and the lockdown in more detail. ONS data on infections and deaths from the disease provide an indication of the scale of the pandemic to which people are responding through the appeals (ONS, 2020c). Infection statistics are based on the numbers testing positive and reflect the effectiveness of the testing system. Death-rates cover numbers of deaths where Covid19 is mentioned on the death certificate, by date of registration. This includes deaths from multiple causes (for example, Covid19 and pneumonia). These statistics are imperfect (they may fail to include some deaths in the community where no test took place, and may over-report deaths from pulmonary illnesses where Covid19 is an assumed cause). However they are the statistics that received the widest currency in national media and are likely to be the ones that had the strongest influence on perceptions.
Generosity to foodbanks is a response to the severity of Covid19. Foodbanks address food-poverty. The immediate needs which provided the context for the appeals were the breakdown of food distribution in the panic-buying at the beginning of lockdown. Joblessness among those not included in the furlough or the various loan schemes and the disruption to and cutbacks in free school meals created longer-term poverty. A direct measure of poverty is provided by the numbers claiming the last resort benefit, UC. The numbers of new claims increased very rapidly in the early weeks of the lockdown and gradually declined from early May to approach the February rate at 54 thousand in the week ending 25 June. This resulted in an increase from under three to over five and a half million people in households receiving the benefit, which has not so far declined, but continues to rise (DWP, 2020). Evidence assembled by Loopstra and Reeves (Reference Loopstra and Reeves2020) indicates a relationship between the introduction of UC and expanded foodbank use, confirming that it is reasonable to expect the demands on foodbanks to be intensified as numbers of UC rise. In the following we consider the relationship between public generosity to foodbanks and poverty (numbers on last resort benefits) as well as to the severity of the pandemic (numbers of infections and deaths).
3. Findings, Discussion and Conclusion
Chart 6 displays the data on the impact of Covid19 on health and benefit claiming and the response in terms of online crowdfunding appeals for foodbanks and the amounts raised. The trajectory of appeals established in early March with that of donations following closely, and then overtaking appeals as more money flowed in to each appeal from late March onwards is familiar. Subsequently, the number of new appeals and the income from each appeal declined in close step. The pattern of infections is similar, although generosity to appeals and in donations anticipates the increase and then follows the decline after the beginning of May. Covid19 deaths track infections at a lower level.
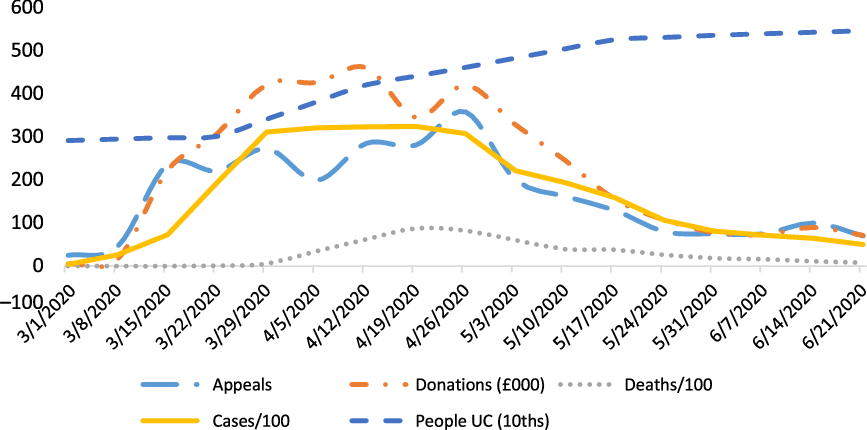
Chart 6. Appeals, Donations, Cases, Deaths and People on UC. Note: the data is expressed in a form that facilitates use of a common scale: appeals = number of appeals extant; donations = value of donations/1000; cases = number of cases/100; deaths = number of deaths/100; and people in households claiming UC = number of people /10,000.
The striking issue in the graph is the huge increase in the numbers claiming UC from the start of the lockdown and the millions living in households which depend on the benefit. Unlike the other data in the set, this statistic does not diminish after the beginning of May but continues to rise and is still doing so, despite attempts to bring the lockdown to an end. The economic dislocation of Covid19 is leading to the exceptionally high unemployment rates foreseen by OBR (2020a) and this is reflected in benefit claiming.
Public generosity reflects the sudden crisis of a pandemic which disrupts economic activity and family life. As the first lockdown is lifted sympathy appears to decline, although the economic impacts of the disease and of the response to it continue to strike home in terms of higher unemployment. The correlation between number of appeals and infections is 0.86 and between appeals and Covid19 deaths is 0.63. Between appeals and UC claims it is 0.58 but between appeals and UC recipients it is -0.22. Corresponding statistics for correlations between donations and cases, deaths, claims and people on benefit are very similar: 0.96, 0.60, 0.65 and -0.20 respectively. The link between headline infection rates and death-rates, statistics which were widely publicised, and the public response is strong. The number of benefit claims tracks these statistics and also correlates well with the two measures of public response. The correlation with the numbers continuing to subsist on benefit is very much weaker and negative. The public is responding not to poverty per se, but to an unprecedented crisis which is perceived to confront all of us and which calls forth a clear behavioural response – establishing appeals and giving money.
The interest in and public support for foodbanks during the pandemic is exceptional. This is borne out by our evidence on appeals and donations, by the statements of foodbanks themselves (Trussell Trust, 2020a; IFAN, 2020) and by material from internet searches and newspaper articles. Chart 7 shows newspaper references to foodbanks and soup-kitchens based on a search of the Nexis database covering all twelve national and 53 regional newspaper (local newspapers were not included because many titles share much of their content with other local papers in the same groups and it is difficult to trace double and triple-counting: Nexis, 2020). Chart 8 shows corresponding material from Google Trends, which uses an index of frequency compared with searches for other terms and normalises on a one hundred point scale to show when the term is most relatively popular. Both charts show similar patterns of a low level of activity in February succeeded by a very rapid escalation in references to and searches for foodbanks and related terms from early March, then a gradual decline in interest. The internet searches show a more abrupt pattern while newspaper interest in foodbanks was more sustained, possibly because stories of generosity to needy families are attractive to readers and relatively easy to supply.
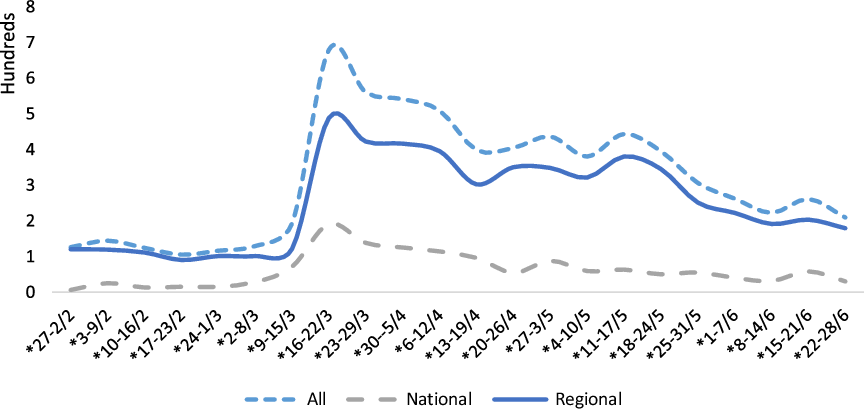
Chart 7. UK References to Foodbanks in Newspaper Articles
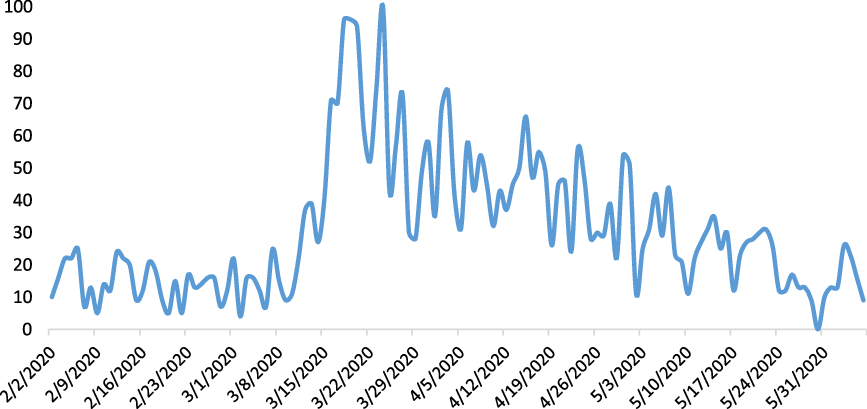
Chart 8. Google Trends: UK Searches for Foodbanks (Google index of relative frequency)
Newspaper references and Google searches are data-sources which must be treated with care and are insufficient in themselves to serve as the basis for a compelling argument. They simply reflect interest in a topic, not orientation or attitude to it, are subject to commercial factors (the over-riding imperative to maintain newspaper sales and use of a particular internet browser, by advertising and by the momentary visibility of the topic) and do not involve a strong action component. They also feed off each other, as different media forms provoke interest in a topic. The patterns in the data, however, are sufficiently similar to those in Charts 3 and 4 to reinforce the evidence of a strong relationship between the pandemic and the response by ordinary people keen to express sympathy by helping foodbanks.
Conclusions
The pandemic and its social, familial and economic aftermath have had profound impacts on UK society, both positive (generosity, neighbourliness and community feeling and the valuing of often low-paid key workers), and negative (unemployment, poverty, mental health and insecurity). One perspective suggests that the lockdown is a turning point, a pivotal moment in a move from individualism towards solidarity, building on a longer-term decay in enthusiasm for market individualism and the fact that the welfare state for the most part addresses needs that we in fact experience collectively (Hills, Reference Hills2017). Another views it as simply a moment of exceptional stress with few long-term implications and argues that moralistic inclusion/exclusion divisions are returning (Demos, 2020).
This paper takes as a measure of generosity direct public responses to perceived need as indicated by appeals and donations by individuals through the main online crowdfunding sites. The amounts raised are small compared to the scale of need (Iafrati, Reference Iafrati2018) but the measure is accessible, swiftly-available, charts time-sequence, is action-based and focuses unambiguously on individual goodwill, unmediated by the political, financial and legal considerations that influence governments, corporate bodies or trusts. The limitations are the socio-demographic specificity of donors and the fact that they form a particular self-selected group. Nonetheless the measure offers a different insight from that of population surveys because it is action-based and refers to money which is highly valued in our market society.
Detailed examination of behaviour over time shows that generosity and solidarity as indicated by crowdfunding responds to the incidence of the pandemic and lockdown and not to that of real financial need. Crowdfunding for foodbanks is necessarily a partial measure of community response. However the pattern here suggests that the established ideology which dominates short-term social security in the UK and is built on notions of deservingness and social division is sufficiently resilient to endure despite a temporary lurch towards solidarity. The likelihood that high unemployment will persist for some time (and labour-market insecurity, especially for those at the bottom, even longer) suggests a bleak outlook.
Our findings also indicate that the more social needs are seen as the outcome of general social forces which confront us collectively, so that ‘we are all in this together’, the more people’s actions are likely to be driven by goodwill rather than by a moralistic divisiveness. This matters, since, as Hills (Reference Hills2017) demonstrates, most of the UK welfare system is concerned to meet needs and risks that confront us all indiscriminately, not issues over which those who are most nearly affected can exert control. The divisive myth of ‘them and us’ is irrelevant to by far the greater part of the welfare state, and the initial response to Covid19 through crowdfunding for foodbanks shows us that things can be different.
Competing interests
The authors declare none.


 Open access