


1 Introduction
State and local pension plans cover more than 19 million members and manage more than US$3 trillion dollars. Benefit payments from these plans in 2010 equaled 11% of state government revenue, and these expenses are projected to grow rapidly over the next 30 years. Although US$3 trillion in assets is sizeable by any measure, it is insufficient to cover committed pension obligations should returns fall below the optimistic assumptions used by most plans. Novy-Marx and Rauh (Reference Novy-Marx and Rauh2012) calculate that the underfunding in state-administered pension plans would require additional contributions of the order of 2% of gross state product should plan investments grow at the risk-free rate.
In response to perceived underfunding and investment risk, public sector retirement systems have increasingly shifted away from the defined benefit (DB) model. In the past 15 years, non-DB plans have opened in Alaska, Colorado, Florida, Georgia, Michigan, North Dakota, Ohio, Oregon, Rhode Island, South Carolina, and Utah among others (Snell, Reference Snell2012). Defined contribution (DC) and hybrid pension plans account for a rapidly increasing share of the retirement assets managed on behalf of public employees. In 1987, only 9% of full-time state and local government employees participated in a non-DB plan, while 93% participated in a DB plan. In 2010, 25% of state employees and 14% of local employees participated in a non-DB plan, whereas participation in DB plans fell to 78% and 79% for these groups.
While there is no inherent link between employees bearing investment risk and choosing allocations, non-DB plans often give participants input in investment decisions. There are important exceptions to this rule. Collective DC schemes, in which participants bear all of the investment risk without managing pension assets, are used by some occupational pensions in the Netherlands. Within the US public sector, participants in systems such as the Wisconsin Retirement System, the Oregon Public Employees Retirement System, and the Nebraska Cash Balance Plan, have faced some investment risk with little or no input on asset management. Despite this, the majority of non-DB public plans in the USA do allow for some individual choice. Ninety-five percent of the responding non-DB plans in the 2012 wave of the Standard & Poor's Money Market Directories (MMD) survey report that their plans’ investments are participant directed.
The trend from DB to non-DB plans in the public sector, then, is also likely a trend towards employee participation in investment decisions. The increasing involvement and risk-bearing by public employees may have important implications for the management of the enormous pool of public sector retirement assets. In this paper, we explore the differences across plan type amongst existing public systems in four aspects of asset management: asset allocations, management fees, investment returns, and portfolio rebalancing. We explore differences in these dimensions both at the plan level and for individuals within a non-DB participant directed plan.
Although several papers have studied the impact of non-DB pension designs on asset management in the private sector, public sector employees and plan sponsors differ from their private sector counterparts in important ways. Public plan sponsors are not bound by ERISA guidelines on investment options and disclosure, cannot offer company stock, and their members and the unions that represent them are frequently influential constituents. For these reasons, as well as their large size and economies of scale, public plans sponsors may structure their non-DB differently or achieve different outcomes. Moreover, public employees are not a representative sample of the nation demographically, have salary paths and job tenures that evolve differently than those in the private sector, and are far less likely to be covered by Social Security. Thus, while the insights gleaned from the literature on non-DB plans in the private sector is useful, the effect of plan type on asset management for state and local governments is best demonstrated by comparing across types within the public sector.
Although this is a critical topic for state and local finance, there are few prior studies that directly explore the relationship between plan type and investment practices across state and local plans. One of the reasons for this is the paucity of data on the investment decisions and outcomes earned in these systems. The lack of data is particularly severe for non-DB public sector plans. This paper uses newly collected data from a number of sources to fill this gap.
The first source of novel data we introduce comes from the Standard & Poor's MMD, which contains information on the investments of thousands of public DB and non-DB plans.Footnote 1 The data were collected primarily from surveys and in-depth interviews of plan officials. Although these data have been collected annually since the 1970s for corporate and public plans, the digitized sample used here contains only public plans and begins in 2005. Unlike most existing data sources on state and local pensions, the MMD data sample a large number of non-DB public plans, opening up a new window on this sector. The survey responses are validated, when possible, against published financial reports. The MMD data also contained the detailed surveys of plan consultants and investment managers, providing a third party source of validation.
To examine the impact of individual investment control on individual outcomes, we construct a unique new data set on individual accounts in the Florida Retirement System (FRS) DC plan. We matched this data set, which contains information on individual contributions and holdings, to demographic and education data collected by the Florida Department of Education (FLDOE) for eligible participants. One of the primary concerns regarding non-DB pension designs is that these systems may create outcome distributions that produce disproportionately poor results for low education or low-income workers. The FRS data (also used in Farrell and Bythewood, Reference Farrell and Bythewood2011) are one of the first to match public pension data to these demographic variables, allowing us to quantify the investment behavior for these groups for the first time.
We use these new data in conjunction with a number of more commonly used data sets. The Survey of Public Employee Retirement Systems, which contains data on membership, flows, and selected assets for public DB plans, is collected by the Census Bureau. The Public Plans Database maintained by the Center for Retirement Research at Boston College provides data from plan annual reports for large public DB plans and a handful of DC plans from 2001-on. Two data sets obtained from Pensions & Investments, a trade publication, contain data on plan allocation targets and component returns. Finally, we used the data set described in Shoag (Reference Shoag2010), which contains data on long-run investment returns for state administered DB plans.
This work builds on an extensive and important literature analyzing investment behavior in public sector pensions. Brown et al. (Reference Brown, Pollet and Weisbenner2009) and Hochberg and Rauh (Reference Hochberg and Rauh2011) look at the prevalence of in-state bias heuristic for public DB plans. Goyal and Wahal (Reference Goyal and Wahal2008) analyze return chasing across managers within in these plans and Sundén and Munnell (Reference Sundén and Munnell1999) looks at politically motivated public pension management. Aronson et al. (Reference Aronson, Dearden and Munley2009) look at coordinating roles of taxpayers, plan administrators and public employees in setting the risk level of plans. A smaller set of literature looks at individual investment behavior in public DC plans. Agnew and Szykman (Reference Agnew and Szykman2005) and Chalmers and Reuter (Reference Chalmers and Reuter2012) look at individual investor competence within two public university retirement systems, and Clark and Pitts (Reference Clark and Pitts1999); Papke (Reference Papke2004), Clark et al. (Reference Clark, Ghent and McDermed2006), and Brown and Weisbenner (Reference Brown and Scott2013) explore which public employees opt to participate in DC systems. This paper adds to this literature by analyzing new data on both public DB and non-DB systems and comparing investment outcomes across plan types.
Using these sources, we explore how participant involvement in the public sector affects the distribution of asset class allocations, management fees, investment outcomes, and portfolio rebalancing at both the individual and aggregate levels. We find that there is little difference between the DB and non-DB plans in terms of asset mix, returns, and fees, except that the DB plan have greater access and allocations to alternative investments. We also find that while the average individual DC plan participant allocated their asset similarly to the DB plan, black females, and older white males, on average, invest on opposite tails of the risk spectrum, with black females holding lower equity positions and older white males holding larger equity positions after controlling individual characteristics.
2 Asset allocation
The most important determinant of a plan's investment performance is its asset allocation (Brinson et al., Reference Brinson, Hood and Beebower1986). Although a large literature has focused on the impact of participant-directed investment in the private sector (for example, see, Choi et al., Reference Choi, Laibson, Madrian and Metrick2004; Brown et al., Reference Brown, Nellie and Weisbenner2007; Tang et al., Reference Tang, Mitchell, Mottola and Utkus2010), there are inherent differences between the structure, membership, size, and function of private and public plans. These differences were manifested historically in the different asset allocations by public and private DB plans (Mitchell et al., Reference Mitchell2001), and may generate important differences in non-DB systems as well. In this section, we provide new evidence on asset allocations at the aggregate and individual level within public sector non-DB systems and compare it to the allocations chosen by public DB plans.
2.1 Aggregate asset allocations in non-DB public plans
The existing data sources on aggregate outcomes for non-DB retirement plans in the public sector are sparse for all but the largest plans, presenting a major obstacle for researchers. We remedy this problem by introducing data from the MMD data set, which contains data on more than 300 non-DB systems (see online appendix for a list). Although the many of these systems are supplemental, they serve more than 8 million participants and oversee more than US$500 billion in assets (these figures are 5 million participants and US$225 billion when limiting to only state and local plans).
In Table 1, we report the average allocation by plan type and size. The data organize plans by the retirement system, and in columns (5) and (6), we classify the largest plan in a retirement system as the ‘primary’ one. Note that being the largest plan for a given system does not mean that these plans are the primary saving vehicle or pension plan for their members.
Table 1. Average asset class allocation by plan type in the public sector: 2012

Data collected from MMD. See the text for description.
As is evident in the table, at a broad level of aggregation, the asset holding of these plans are similar across plan types. Large DB and non-DB public plans attach similar weights to domestic variable and fixed return assets. Non-DB plans are more likely to hold target-date and lifecycle funds, which are recorded in the ‘Other’ category. The overall differences at this level, although, are minor considering the substantial differences in participant involvement and risk-bearing across plan types.
Although the broad allocations are similar, important differences across plan types are evident at finer levels of aggregation. The MMD survey solicits detailed information on plan allocations, providing sponsors with 86 category classifications. Unfortunately, some of these categories are quite broad (e.g., ‘Bonds (unspecified)’, ‘Other’), and a number of plans list assets in these categories rather than disaggregate. Despite this limitation, the data show a stark difference in the use of alternative investmentsFootnote 2 across plan type. In Table 2, we report the percentage of plans of each type that state they hold any alternative assets in samples that include and exclude the partial respondents. As documented in the table, while alternative exposure is extremely common for large DB plans, it is rare for non-DB plans.
Table 2. Alternative asset use across plan type: 2012

Data collected from MMD. See the text for description.
Table 2 reports the percentage of plans holding any of the specified assets; Figure 1 above shows that these holdings represent a non-trivial portion of DB assets. Although the unweighted average allocation to this category is just 2.3% amongst DB plans, the dollar-weighted average is a substantial 10.6% of plan assets. Thus on a per-dollar basis, DB and non-DB plans are even less similar than the differences in Table 2 imply. Similarly important dollar-weighted differences can also be seen in real estate allocations (real estate equity, REITS, and real assets), which comprise 6.2% of public DB assets but only 0.24% of non-DB assets. This stark difference in the usage/availability of alternative investments by non-DB plans may disadvantage them in the risk/return space by limiting their investment universe.
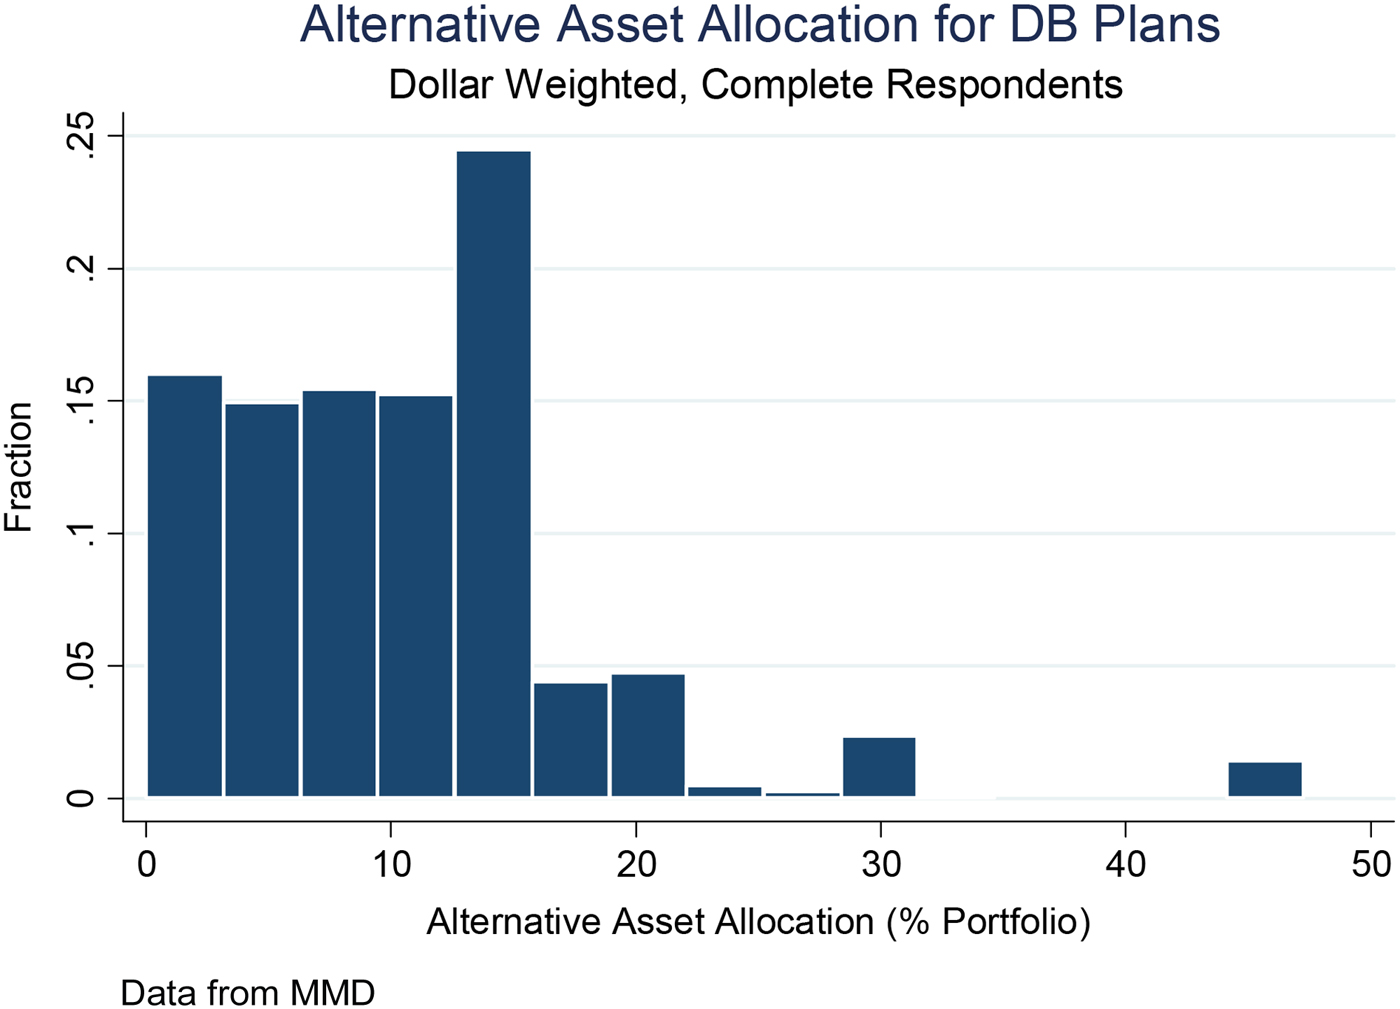
Figure 1. Distribution of alternative asset allocations for DB plans.
2.2 The distribution of individual allocations in a public DC plan
Although the previous section showed that aggregate outcomes in public DB and non-DB plans are mostly similar (except for the noted difference in Alternative investments usage), these aggregates may mask substantial heterogeneity in the allocations of individuals within a non-DB system. To examine the investment behavior of participants at the individual level we use data from public employees in Florida who have elected to join the DC plan within the FRSFootnote 3 . The FRS, since 2002, has allowed employees to choose between a DC and a DB plan, with the DB plan being the default option. Until recently, employers were required to make the full contribution to the plans, while employees contributing nothing. For DC participants the contribution amounts are determined as a percentage of their salary. Participants that elected the DC plan are allowed to choose between a set of available mutual funds covering the equity, foreign equity, bond, money market and TIPS asset classes, as well as three balanced funds of varying risk. Since the DC plan's inception in 2002 the number of funds available has ranged from 40 to 19, with 20 available as of 2009. Participants are defaulted into the Moderate Balanced fund which is designed to provide the level of risk appropriate to the ‘average’ investor; however participants are free to reallocate both their existing balances and future contributions.
As of 2009 the DC plan has grown to nearly 100,000 active participants and US$4 billionn in assets. To enhance our ability to study investor behavior, the investment behavior was combined with demographic data from the Florida Department of Education, which includes approximately 40,000 of the 100,000 total participants. The added data allow us to have an improved understanding of the investment behavior by age, education, race, and job type.
Before proceeding, we first document a number of salient characteristics of plan participants. Table 3 summarizes the demographic characteristics of both the DC and DB plan participants from FLDOE database. The DC participants are primarily female (74.6%) and white (73.9%) with an educational attainment of either a bachelors (36.5%) or Master's degree (22.8%). They have an average age of 44.9, although the age ranges from 15 to 89. When comparing the DB and DC participants, the DC participants are slightly more likely to be male, more likely to be white and more likely to hold college degrees. There is also some difference in the age-earnings profile, with higher incomes among both the youngest and oldest DC participants in comparison to their DB counterparts.
Table 3. Summary statistics for DB and DC plan participants

Data for both panels from the FLDOE data set (2008–2009).
There is significant heterogeneity within the plan across age and income levels. Panel B highlights the difference across age groups. The increasing proportion of male participants across age bins likely reflects the steeper drop in labor force participation among women relative to men. In the later years, we see a widening gender gap across plan choice.
It is also important to document how these demographic characteristics are correlated with average allocation outcomes. Figure 2 reports the age profile of the equity allocations by gender from the FRS between 2008 and 2009. This figure demonstrates two important correlations. The first is that like in many other contextsFootnote 4 , women in the Florida DC plan hold a smaller share of their assets in risky assets. Second, the average equity share peaks between 30 and 39 years old for both male and female participants and declines steadily as participants near retirement and begin to reduce risk. This is consistent with the optimal lifecycle behavior described in Gomes et al. (Reference Gomes, Kotlikoff and Viceira2008). Although the differences in equity allocation are statistically significant and important to understand, they are relatively minor in magnitude. Equity allocations, although declining with age, remain substantial for even the oldest plan participants. This evidence ameliorates the common fear among critics that participants’ ‘shift to a more conservative asset allocation as they age’ will not lead them to excessively ‘sacrifice investment returns’ (Almeida and Fornia, Reference Almeida and Fornia2008).

Figure 2. Age profile equity allocations by gender. Data from the FRS–FLDOE matched data set, 2008–2009.
There is surprisingly little heterogeneity in the distribution of equity shares across income and education. Table 4 shows the relative consistency of equity shares as income increases, with equity shares rising from 63% of the portfolios for those making under US$25K, up to 69% in the US$40K–55K range before dropping to 65% for the highest income earners. A similarly non-monotonic and relatively stable relationship is evident for education as well.
Table 4. Equity allocations by education and income

Data from the FRS matched panel (2008–2009).
Despite the relatively narrow distribution of equity shares across education and income there is still a possibility that some portion of the DC population will assign a very high or low weight to risky assets. To explore this, we tabulate the demographics of the participants whose equity allocations lie significantly below the DB average (allocation <25%) and those whose allocations are significantly higher (allocation >95%). On the low-allocation side, 8.3% of black female participants between 25 and 40 years old have an equity allocation below the 25% threshold; this is nearly double the 4.6% occurrence rate of all participants of the same age. On the high-allocation side, 24.1% of white male participants between 25 and 40 years old with incomes greater than US$55,000 have an equity allocation higher than 95%; this is also nearly double the 12.8% occurrence rate found in all participants of the same age. These two groups account for a relatively small portion of the sample, with black females in the 25–40 age range accounting for 4.4% of the population and white males of the same age and incomes above US$55,000 accounting for only 0.35% of the population in the Q3 2009. While these cases highlight the extremes deviations from the DB norm, these tabulations show these deviations are concentrated amongst identifiable groups. These groups may be more vulnerable to investment risks because of their more extreme strategies.
2.2.1 Summary of asset allocation results
The data described above indicate that, on an average, asset allocations in public retirement systems do not differ wildly across plan types at very broad levels. There has been substantial convergence in the fraction of these assets devoted to risky assets within DB plans, and currently most DB systems hold broadly diversified portfolios. The aggregate holdings of the non-DB systems surveyed in the MMD database show that, on average, the assets held in DC plans are also diversified across broad asset classes.
At a finer level, although, significant differences do emerge. DB plans are far more likely to be invested in alternative assets like private equity and hedge funds, as well as in real estate. Although these differences are relatively minor when treating all plans equally, this gap is largest for the largest funds. As such, when taking a dollar weighted approach, there are meaningful differences in allocations across plan type.
These aggregate tallies mask a wide range of allocations for individuals within a DC system. While there are differences in allocations along demographic lines like age, gender, and education, on average these differences are relatively minor. When focusing on the population with portfolios that differ from the DB norm, we find that these deviations are substantially more likely to occur within distinct demographic groups like black women and high-income, white males.
3 Investment returns and fees
In the previous section, we analyzed asset allocations in both public DB and non-DB pensions. In this section, we explore the outcomes of these allocations and document how investment returns and management fees vary with plan design in the public sector.
3.1 Fees
The public sector's movement away from DB plans may have important consequences for administrative expenses and investment fees. Non-DB plans generally require the tracking of individual accounts, which may be costly, and as seen above have somewhat different asset allocations. Additionally, a straight comparison of fees in existing public DB and non-DB plans is difficult as fees often depend on the size of pension plan. In this section, we explore the realized distribution of administrative expenses across plan design using a number of data sources and attempt to control for the issues discussed above. This analysis builds on the work of Bateman and Mitchell (Reference Bateman and Mitchell2004), James et al. (Reference James, Smalhout and Vittas2001), and others by comparing the costs across plan designs within the US public sector. We find that, after controlling for plan size and asset allocation, plan design appears to have no appreciable effect on aggregate investment and administrative expenses. We then use the individual account data from the FRS to explore how individual control affects the distribution of fees paid across individuals. We find that, while there is heterogeneity in fees across investors, Florida's plan design prevents any investor from paying fees that greatly exceed the distribution of outcomes in the DB sector. Moreover, unlike in the DB system where the smallest plans face the highest fees, high fees in the DC system are more likely to fall on the wealthiest investors.
3.1.1 Average fees in state and local DB and non-DB plans
The Annual Survey of Public-Employee Retirements Systems reports data on the administrative expenses of 1,216 DB plans in 2010. These fees include investment management fees, in addition to the salaries of system employees, building rentals, and the like. The data show that the median DB plan in the sample paid fees equal to 0.5% of its total asset holdings in 2010, a sum that closely mirrors the median in previous years. The distribution of these fees depends heavily on the size of the fund. As is demonstrated in Figure 3 below, larger plans pay smaller fees as a percent of their portfolio and the distribution of fees is compressed. Specifically, less than 3% of the plans with over US$500 million in assets paid more than 1% in the total administrative expenses. Roughly 25% of the plans with under US$8 million in assets paid this amount. There is a prominent tail of high administrative and investment fees amongst these small plans.

Figure 3. Fees by pension plan size (in millions). Data from the Annual Survey of Public-Employee Retirement Systems, 2010.
In addition to size, plan structure (both the portion of internally vs. externally managed assets, as well as the portion of actively vs. passively managed assets) plays an important role in fee determination. Across the major plans in the Pensions and Investments sample, the average internally managed portfolio accounts for 32% of plan assets. This average masks a large degree of heterogeneity. Major plans such as the Oregon Public Employees and the Public Employees Retirement System of Mississippi manage less than 1% of their portfolios internally. The retirement systems in Georgia and Alabama, on the other hand, internally manage their entire portfolios. There is a similar divergence across plans in the share of assets that are passively managed. Many large systems, such as the Illinois State Teachers’ Retirement and the Hawaii Employees’ Retirement System report almost no passively managed asset, others such as New York State Plans and the Colorado Public Employees Retirement Association have large indexed holdings. Both of these measures are associated with lower fees: a 1 standard deviation (SD) increase in the fraction managed internally reduces fees by roughly a .5 SD and a 1 SD increase in the fraction passively managed reduces fees by roughly one-third of an SD.
The distribution of expenses in the Boston College Public Plans Data for large DB plans unsurprisingly resembles the expenses of the largest DB plans in the Census data. The median plan in the Public Funds sample paid fees equal to 0.3% of its portfolio in this period. The mean was slightly higher (0.5%), with a rightward tail that truncates slightly above 2.5%. Once again, the fee distribution appears relatively stable over time in this data set.
The Boston College Public Plans Data set also contains data on the administrative expenses for a small number of state-administered DC funds. We supplement this set with data on the expenses of the available state-administered deferred compensation funds (401K, 403(b) and 457) from a number of states, including California, Michigan, Colorado, New Jersey, Texas, and Pennsylvania. The median administrative expenses amongst these larger plans in 2009 also equaled 0.4% of the total assets. As in the DB case, we encountered very large expense ratios for the handful of small deferred compensation funds for which we were able to obtain data. Statistical significance is hard to evaluate in such a small sample, but conventional tests fail to reject any difference in the distributions of fees and the distribution in the Census sample.
This similarity in fees is consistent with evidence on fees in non-DB plans in the private sector. The GAO (Reference GAO2006) reports that 98.6% of the total fees paid by 401(k) plans are for investment management. Record-keeping and other account maintenance fees have large economies of scale, and constitute just a small fraction of the fees paid in larger non-DB plans. Most public retirement systems are large enough that, if there are major cost differences, it would need to be driven by differences in investment-related fees.
Given the centrality of investment management fees, we compare mandate-level manager fees by plan type in the MMD data. These data are organized on the plan-manager level and reports fees as a percent of the mandate. While these data are not complete, it has the great advantage of allowing for flexible controls for asset class and mandate size. Table 5 demonstrates that these controls are important. DB plans are more likely to utilize high-fee asset classes creating a spurious positive relationship. Additionally, there are more DB plans in the MMD database, and the average size of these DB plans is smaller. When controlling for asset classes and the size of the mandate, we find no relationship between plan design and fees. This is true in both the full sample and when we restrict our analysis to managers that serve both DB and non-DB clients. Thus, the available data suggest that there are little differences between the average fee outcomes between public DB and non-DB plans conditional on asset classes.
Table 5. Management fees by plan type

Standard errors in parentheses.
***p < 0.01, **p < 0.05, *p < 0.1.
Data from MMD.
3.1.2 Individual fees in a public DC plan
As with asset allocations, the shift toward individual risk bearing that often accompanies participant directed investment raises interest in the distribution of fees in non-DB systems. Although DB and non-DB plans face similar investment fees once size and asset classes are considered, these similarities may mask interesting heterogeneity in fees across participants. We again address this issue by looking at data from the Florida Retirement System's DC plan, from 2010 through the first quarter of 2012Footnote 5 , and examine the distribution of fees across individual investors. Because of the size of the Florida Retirement system and the level of fees for their DB plan, they are able to provide relatively low fee mutual funds to their individual participants. The fees for the first quarter of 2012 ranged from a low of 0.02% annually to a high of 0.92% annually, with passively managed stock and bond funds, as well as the balanced funds, in the sub-0.10% range and the actively managed funds in the plus-0.50% range. We can look at the distribution of fees across participants based on their allocations to the individual funds in each quarter. The active participants are not assessed any other fee, while non-active participants currently pay a small account maintenance feeFootnote 6 .
Across all participants and periods, the average fee is 0.142%, although this has been dropping over time from a peak in Q2 2010 of 0.149% to a low in Q1 2012 of 0.135%. There does, however, remain significant heterogeneity among the participants. Male participants pay an average of 0.164% while female participants pay an average of 0.129%, this difference reflects the tendency of female participants to remain in the default investment which carries a fee of 0.04% while male participants tend to more heavily use actively managed funds, which carry higher fees.
Looking at fee distribution by portfolio value, we see that participants with portfolios greater than US$100 K are more likely to use the high fee funds and have a wider distribution of fees. At the median they pay 0.26% while the other participants pay 0.05%, they also have higher fees at both the 25th and 75th quartiles. These high-fee funds earned larger returns over the period covered by the data.
In Table 6, we regress fees on portfolio values and find that fees increase significantly with increases in pension wealth. However, wealth is not the only factor in correlated with fees at the individual level. Column 2 of Table 6 displays the same relationship with gender, race, age, education, and experience as controls. As wealth increases, the increase in fees paid is substantial and significant, with the portfolio value of US$100 K+ category paying 0.103 pp higher fees. It should be noted that fees differ along these demographic and education division. Appendix Table 2 shows that, holding portfolio value and income constant, men, blacks, and Hispanics pay higher fees and older workers with advanced degrees pay lower fees than average. Although these estimates are statistically significant, they are generally small relative to the SD of fees across the population or the gradient of fees across portfolio values.
Table 6. Wealth effects on fees at the individual level

Standard errors in parentheses.
***p < 0.01, **p < 0.05, *p < 0.1.
Data from FRS–FLDOE matched data set (2010–2012).
These results reflect the fact that less wealthy participants may shy away from active management, in this case remaining with a low-fee default investment, while more wealthy participants may seek the higher expected returns found in the available actively managed funds. The plan level results suggest that fees in a large, participant-directed DC will likely be comparable to that of a similarly sized DB plan. To the extent that heterogeneity in a DC framework creates a distribution of outcomes, the tail end of the fee distribution contains the wealthiest investors. Clearly, plan design and fund availability will have an impact on fee distribution within a DC plan.
3.2 Investment returns in DB and non-DB systems
There is considerable debate as to whether participant-direct non-DB plan can match the investment returns found in DB plans. Although there is little aggregate data on state DC investment outcomes, a number of studies (Tapia, Reference Tapia2008; Towers, Reference Towers2009, and others) have found that private DC plans earn lower returns than DB systems. In this section, we explore this question by comparing the distribution of returns among FRS investors and investment options to the available data on investment returns for state and local plans.
Unfortunately, long-run data on the investment returns earned by any type of public plans are scarce. The Public Pension Database maintained by the Boston College Center for Retirement contains data extracted from plan reports going back to 2001. In addition, we were able to obtain data for the 2005–2010 period, including policy benchmark returns and fund performance within asset classes, from Pensions and Investments Public 100 database. For data before 2001, we turn to the state-administered return data set used in Shoag (Reference Shoag2010). These data were collected from open records requests and plan financial reports from the Library of Congress and at various state libraries. The data were validated, where possible, using data from the biennial Public Funds Surveys and the NEA Characteristics of Large Public Employee Pension Plans.
In Figure 4, we plot the distribution of returns for plans with fiscal years ending in June. There is clearly substantial heterogeneity in returns across time, but there is also substantial variation within years.

Figure 4. Returns in public DB plans. Data from Shoag (Reference Shoag2010).
At the individual level, using the FRS data, we find substantial heterogeneity of returns. Figure 5 shows the distribution of returns between Q4 2002 and Q3 2009 for the participants. From 2002 to 2009 the mean return was −0.33% with an SD of 7.6% and a median of 1.83%, reflecting a fat left tail that was expected given the market crash of 2008 and 2009. From 2002 to Q3 2007, there was a mean of 2.85% with an SD of 3.23% and a median of 2.84%. There is a wide distribution in participant returns within each year as well as across years.

Figure 5. Distribution of individual returns by quarter. Data from FRS–FLDOE matched data set (2002–2009).
Ideally we would like to compare the ex-ante distribution of returns chosen by participants in non-DB systems to the distribution chosen by DB plans, but real-world data only contain ex-post outcomes. Additionally, while we have a return data for a medium-sized sample of DB plans, our data on non-DB plan options are limited to the FRS.
In Figure 6, we compare the distribution of the DB plans’ and DC individuals’ annual returns in the FRS over the same time frame. We can see that DB plans tend to slightly outperform at the median and have a narrower dispersion of results. The mean of the DB distribution is 1.6 percentage points above the mean of the FRS DC distribution, although this difference is larger in years when the market does well (0.8 pp and marginally significant in years where the average return was negative relative to nearly 2 pp and highly significant otherwise). This may reflect the fact, documented in previous sections, that DB plans are more likely to hold high-risk assets such as private equity and venture capital.

Figure 6. Distributions of DB plan and the FRS DC plan returns. Data from Shoag (Reference Shoag2010) and FRS–FLDOE matched data set (2004–2009).
To further explore the where the difference in return stems from, we compare the within asset class performance. Figure 7 plots the distribution of equity returns for DB funds and the returns on the 25 equity investment options in the FRS system weighted both equally (left panel) and by participant elections (right). A common set of year fixed effects has been removed from the two distributions, and the sample is for June FY plans and returns. As is evident in the figure, the DC distribution is more variable. Nevertheless, there is no statistically significant difference in the mean, and if anything, the DC options performed slightly better. This suggests that the difference in returns is not due to within asset class performance, but rather to allocations and access to asset classes with historically higher returns, such as alternatives.

Figure 7. Comparison of residualized equity returns for DB plans and DC participants. Data from Shoag (Reference Shoag2010) and FRS–FLDOE matched data set (2005–2009).
Finally, we explored whether there were significant differences in performance along demographic and educational lines, holding fixed portfolio size and income. Men, who invest in riskier allocations, earned higher returns. Older workers and African Americans had lower returns. Although these differences were statistically significant (see Appendix Table 2, column 2), they are generally small relative to the cross-sectional variation in returns.
3.2.1 Summary of investment return and fee results
The data described above indicate that, on average, fees are quite small for both large DB and non-DB public plans. The highest fee DB plans are the smallest DB plans and those DB plans investing heavily in alternative assets. When comparing within asset class fees, there appears to be no difference across plan types. The average fees levied on participants in the FRS plan are comparable to those found in DB systems. With respect to the heterogeneity of the individual fees, interestingly, it is the wealthiest investors that pay the highest fees within this system. Wealthy investors are more likely to sort into expensive and aggressive funds, as opposed to poorer investors who are more likely to sort into inexpensive and low-risk funds.
On the return side, like many previous studies in the private sector, we find that the distribution of DB returns has a higher mean and is compressed relative to FRS distribution of individual returns. This effect is strongest in up-years and is not evident in within asset class comparisons. These facts suggest that differential allocations to alternative investments by DB plans may explain this difference.
4 Rebalancing
Much of the previous literature on participant directed investment has focused on behavioral biases or cognitive limitations. This literature has found that pension members inefficiently rebalancing their portfolios (Shefrin and Statman, Reference Shefrin and Meir1985; Dhar and Zhu, Reference Dhar and Zhu2006), suffer from status quo bias (Samuelson and Zeckhauser, Reference Samuelson and Richard1988) and 1/n bias (Benartzi and Thaler, Reference Benartzi and Richard2001) in their allocation decisions. Shefrin and Statman and Calvert et al. (Reference Calvert, Campbell and Sodini2009) have shown that the disposition bias is less prevalent for investors with greater financial literacy, product knowledge, and wealth. Under weak assumptions about the efficiency of markets and the stability of preferences and return distribution, investors should rebalance their portfolios in response to market movements when it is costless to do so. By allowing allocations to drift from targets, investors subject themselves to mean-variance inefficiency and modest welfare loss (Brennen and Torous, Reference Brennan and Walter1999). Following Calvet et al. (Reference Calvert, Campbell and Sodini2009), we measure rebalancing by comparing the active change in investors’ allocations with their passive or market-induced changes. This method captures the investors’ rebalancing actions relative to the market drift that they would experience given differences in asset returns. In addition, for DB plans, where asset class allocation targets are stated, we look at the rebalancing behaviors relative to their explicit targets.
4.1 Rebalancing in DB plans
We explore rebalancing in DB plans using two data sources. The first source is the CUSIP level equity holdings reported in the 13F filings of some public pension plans. Institutional investment managers supervising more than US$100 million in 13F securities (mostly domestic equity) must report their quarterly holdings to the SEC. The applicability of this law to public pension plans is unclear. Nevertheless, 24 state-administered DB retirement systems did file 13F forms during at least one quarter between 1980 and 2010. These filings allow us to construct quarterly CUSIP level data on the internally managed equity portfolios of these plans. We show that that states do not fully rebalance their stock holdings in this segment of their portfolios, and even portfolio aggregates like beta and industry composition are allowed to drift over short to medium horizons.
To measure rebalancing, we decompose total portfolio changes into active and passive changes as in Calvet et al. (Reference Calvert, Campbell and Sodini2009). The passive changes reflect the change in equity share that would have occurred based solely on market movements and the active change is the change due to active rebalancing. In a full rebalancing regime, active changes would offset passive changes one for one.
Figure 8 shows the change in holdings vs. the passive change in holdings (i.e., the change that would have taken place if the plan did not adjust the number of shares it owned) at the plan-stock-quarter level. The figure bins the 1.8 million observations into 100 quantiles, and panels A and B document this relationship in dollars and portfolio shares, respectively. These results are only calculated over stocks which appear for at least two adjacent quarters.
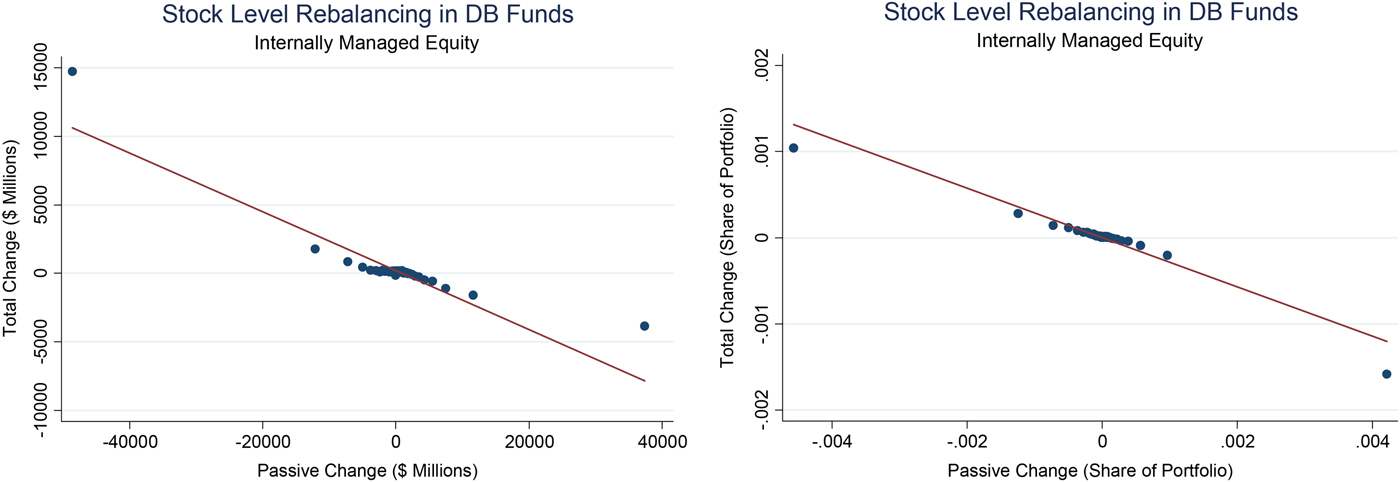
Figure 8. Actual change vs. price induced change.
As the graph shows, changes in the allocation to a single stock caused by price movements are partially offset at the quarterly frequency. Rebalancing seems far stronger in response to extreme passive changes, a feature that may be driven by measurement error (i.e., unobserved stock splits, unaccountable swings in reported portfolio sizes).
To get a better handle on this issue, in Table 7, we regress the active portfolio change on the passive change and the passive change interacted with a dummy registering a passive change in the 90th percentile in the absolute value distribution. The regression shows that rebalancing occurs, is modest for moderate changes, and is significantly more responsive to extreme movements.
Table 7. Active response to price movements

Data collected from 13F filings. Dummy registers change greater in absolute value than the 90th percentile of the absolute value distribution. See the text for description. Robust standard errors in parentheses.
While these results suggest that public pension plans quickly rebalance only extreme movements at the stock level, it is possible that these changes are undone through composition of stocks. That possibility does not appear to be true in the data, however. In Table 8, we report the relationship between passive (price movement induced) changes in portfolio betas and the actual change in portfolio betas reported over the quarter, biannual, and 4-year horizon. Stock level betas are taken from the CRSP data set, and the portfolio betas are calculated through a weighted average of the individual stocks for which an estimate was available. Passive changes are calculated only for stocks present at the initial and final time period.
Table 8. Change in beta due to price movements

Data collected from 13F filings and CRSP. See the text for description. Robust standard errors in parentheses
The table shows that at all frequencies, changes in the actual beta of these portfolios are highly linked to the changes that would have taken place absent any rebalancing. Estimates of the persistence decline over time, but remain over 46% at the 2-year horizon. These results suggest that plans do not actively target a specific beta in the short to medium run.
Given the moderate levels of rebalancing within the internally managed equity component of state pension portfolios, it is worth investigating how quickly funds are rebalanced across asset classes. Using data from Pensions and Investment, we explore how persistent are deviations from asset class targets. These data report both the actual percentage of a plan's investment in a given asset class as well as the target percentage set by the system's boardFootnote 7 .
To quantify persistence, in columns (1), (4), and (7) of Table 9, we regress the gap between the actual and target allocations on the gap in the previous year. We find that the gap is persistent in every category, with estimates ranging between 84% for private equity and 35% for fixed income.
Table 9 Deviations from allocation targets

Data from Pensions and Investments. Standard errors clustered by plan.
There are two ways in which a plan can close the gap between its actual investment share and its target, it can adjust its investments or alter the target. Columns (2), (5), and (8) regress the change in the actual share allocated toward equity, fixed income, and private equity on the lagged gap. The coefficients can be interpreted as the percentage change invested in the asset class given a 1 percentage point allocation over the target in the previous year. The estimates imply that if the fund held 1 pp more of its assets in equities than its desired target, then it would reduce its equity holdings as a percentage of its portfolio by 0.3 pp of the following year. This indicates a modest amount of rebalancing, consistent with what was demonstrated in the previous section.
Columns (3), (6), and (9) present the results for the change in the target. The estimates indicate that when 1 pp more of the portfolio is over allocated toward equities, the equity target is adjusted upwards by 0.08 pp of the portfolio the following year. The corresponding estimate for fixed income is 0.27 and 0.11 pp for private equity. Thus, a non-trivial fraction of the closing of the gap in these categories stems from adjusting the target and not rebalancing.
4.2 Rebalancing in the FRS DC plan
Prior research has shown that investor behavior can vary considerably across contexts, with discount brokerages showing frequent trading (Odean, Reference Odean1999) while 401k type accounts tend to show very infrequent rebalancing (Agnew et al., Reference Agnew, Pierluigi and Sunden2003) and the tendency to stay with a default investment (Madrian and Shea, Reference Madrian and Shea2001; Choi et al., Reference Choi, Laibson, Madrian and Metrick2004). To examine rebalancing at individual level in public DC plans, we use the matched subset of 2010–2012 Florida participants, which includes fund balances as well as future contribution elections.
Again following Calvet, Campbell, and Sodini, we decompose the changes in equity allocations on a quarterly basis into active and passive shares at the participant level. Table 10 below provides summary statistics for the active and passive changes to equity allocations for the participants. The mean values are close to zero, with −0.07% for active change and 0.03% for passive change. The vast majority (96.8%) of participant-quarters do not feature an active change greater than 0.5% of the portfolio in absolute value, suggesting that there is very little rebalancing in this plan from quarter to quarter. There appears to be a high level of inertia from the participants intra-quarter.
From 2010 to Q1 2012, of the 20911 participants in the full sample period, 13% had an aggregate active change in their equity allocation greater than 0.5% in absolute value. One of the concerns is the potential for significant heterogeneity across participants in rebalancing behavior. Table 11 below compares the characteristics of these active participants and non-active participants. In terms of age, race, and education, these groups are fairly similar; with the only substantial difference being the proportion of participants with advanced degrees at 31.6% to 27.2%. However, we see large differences in income, portfolio value, and gender ratios. The active participants have a higher income (US$39,256–34,082), larger portfolio balances (US$47,587–31,255), and a larger proportion of them are male (32.7%–22.7%). These income and portfolio balance differences occur despite nearly identical average employment tenures across groups. The active participants have earned a slightly better return over the sample period, have a slightly lower equity share, and have a much smaller average allocation to the moderate balanced fund (default investment).
To further examine what impacts active rebalancing, Table 12 reports the results from regressing the active change on the passive change and the initial equity share. In the first specification, passive change has a positive effect on active change, suggesting that active movements do not offset any of the passive movement at this frequency. Initial equity share has a negative effect, suggesting that participants do tend to revert toward the mean. The second specification added the average equity returns to control for potential return chasing. While equity returns have a significant positive impact on the active change, the addition does not significantly change the size or sign of the passive change or initial equity share. Both of these specifications suggest that the quarter-to-quarter impacts of market movements on rebalancing are small.
Table 10. Summary of active and passive changes of equity allocations

Data from FRS–FLDOE match data set (2010–2012).
Table 11. Comparison of active participants and non-active participants

Data from FRS–FLDOE match data set (2010–2012).
Table 12. Rebalancing – effects on active change

Data from FRS match data set (2010–2012).
The third specification looks at the changes over the whole period, focusing on the participants that have remained in the plan for the 2.25 year span. This regresses the total active change over the time period on the total passive change and the equity share in the first period. When viewed over a longer period of time we see a significant increase in the magnitude and a sign reversal on the passive change impact (0.0324 pp to −0.4305 pp), suggesting that, while market drift dominates quarter to quarter, over a longer period of time participants are rebalancing to adjust for the movements. In the final specification, we added an interaction term for the low incomeFootnote 8 participants to the total change regression to test for differences in rebalancing behavior across the income groups. There is a significant difference in rebalancing behavior for low-income and non-low-income participants, even with controls for the portfolio value. The low-income participants have a passive impact of 0.8110 pp, while the non-low income participants have a −0.7045 pp passive impact given a passive change of 1%. Similarly, shorter tenure employees and employees without an advanced degree are also less likely to rebalance (see Appendix Table 1). Interestingly, we do not find statistically significant differences in rebalancing along non-economic demographics such as age, sex, ethnicity, and gender, conditional on our baseline controls.
4.2.1 Summary of rebalancing results
This section concludes that, while DB plans do rebalance their portfolios, there is substantial short to medium run inertia in state pension plan investments. This inertia is present within the internally managed equity component and occurs at both the level of individual stocks and portfolio aggregates such as beta and industry composition. There is also inertia in the allocation across asset classes. Deviations from investment targets ultimately cause adjustments to both the actual allocation and the target.
Our analysis of individual investors in the FRS DC system produces extremely similar results. Rebalancing by individuals is harder to detect in the short-run, although a similar degree of moderate rebalancing can be seen over longer horizons. There is, however, heterogeneity in the magnitude of rebalancing across demographic groups, meaning that certain segments of the population, like those with low income, are more susceptible to these biases.
5 Conclusion
The past 30 years have seen a rapid movement away from DB plans in the private sector, and to a lesser extent this trend has been mirrored in public sector during the past two decades. Concerns about the ability of state and local governments to meet existing pension commitments may speed that transition toward DC designs in the coming years. This change will have a meaningful impact on the lives of millions of public employees and on the substantial assets allocated for their retirement. It is important to understand how these changes are likely to affect the allocation and management of these assets.
In this paper, we use new data to provide the first comparison of asset allocations, fees, and returns across plan designs in the US public sector. We also use unique data on individuals in the Florida state DC plan matched to demographic information from the FLDOE to analyze how individual heterogeneity affects the distribution of outcomes within a public DC system.
We find that aggregate asset allocations are broadly similar across plan designs, although there is substantially greater use of alternative investments amongst DB plans. The data suggest that this difference explains much of the fee and return differentials across plan designs.
Within the Florida DC system, most investors hold diversified portfolios (in large part due to a ‘balanced’ default option). A small segment of investors, in which those with low incomes, minorities, and women are over-represented, hold significantly more conservative portfolios than the representative DB plans. Due to the structure and size of the FRS this group is relatively insulated from fees, however, which are higher for the more aggressive, and typically higher-income, participants.
This analysis suggests that the shift toward participant involvement may change the way public sector retirement assets are managed. Certain asset classes are much less common in existing non-DB systems, and the use of these assets can meaningfully affect fees, risk exposure, and average performance. Additionally, while non-DB systems seem to produce outcomes comparable to the DB universe at a broad level, there remains significant heterogeneity among the individuals. A minority of the investors in the FRS DC system deviate significantly from the DB norm, and these deviations are more common among investors with distinct demographic profiles such as black women and high-income, white males.
Appendix
Appendix Table 1. Rebalancing – effects on active change

Appendix Table 2. Heterogeneity of fees


