


Overweight and obesity in women are strongly related to retention of weight acquired during pregnancy(Reference Gunderson1,Reference Endres, Straub and McKinney2) . The postpartum period is a recognised window of opportunity for delivery of weight management interventions, due to the energy cost of breastfeeding, the increased autonomy provided by maternity leave, and the extra motivation for women to become good role models for their children and return to pre-pregnancy weight(Reference Butte and King3–Reference Edvardsson, Ivarsson and Eurenius5). An accurate estimate of the resting energy expenditure (REE) of an individual may facilitate calculation of the energy intake reduction required for weight loss. In this respect, methods to estimate REE in overweight and obese women postpartum is of special interest. As indirect-calorimetry measurements of REE are often unaccessible in clinical practice, predictive equations are commonly used to estimate REE. However, their use has been widely discouraged for individuals who differ from the reference population, since substantial prediction errors may occur(Reference da Rocha, Alves and Silva6,Reference Thompson and Manore7) . No equation has previously been developed for postpartum women, although they may be at particular risk for such errors due to the anomalous physiological condition associated with this period. For instance, postpartum women may be in a state of overhydration, associated with both pregnancy and obesity(Reference Buchholz, Bartok and Schoeller8,Reference Das, Roberts and Kehayias9) . This may lead to an overestimation of the energy requirement. To our knowledge, only two publications have previously validated existing predictive equations in women postpartum at 1–10 d(Reference de Sousa, Maioli and Dos Santos10) and 3 months and 9 months postpartum, respectively(Reference Pereira, Purcell and Elliott11). Both studies were only observational and included both lactating and non-lactating women of several BMI categories. Pereira et al.(Reference Pereira, Purcell and Elliott11) found similar patterns for performance of equations in BMI-specific categories, however, with larger individual variation in REE (increasing limits of agreement) with increasing BMI(Reference Pereira, Purcell and Elliott11).
We conducted a randomised controlled trial investigating the main effects of diet and exercise behaviour modification treatment (the Livsstil vid Effektiv Viktminskning under Amning (LEVA) study; Lifestyle for Effective Weight loss during lactation), in Sweden between 2007 and 2011(Reference Bertz, Brekke and Ellegard12). There was a main effect of the dietary behaviour modification treatment resulting in a weight loss of 9 % after the 12-week intervention, and the weight loss sustained at 10 % at 15 months postpartum(Reference Bertz, Brekke and Ellegard12). Exercise behaviour modification did not contribute significantly to weight loss. Thorough physiological measurements, including REE, anthropometry, body composition and breastfeeding status, were collected at three times: baseline (10 weeks postpartum), end of intervention (24 weeks postpartum) and 1-year follow-up (15 months postpartum).
The aim of the present study was to evaluate which predictive equations provide the best estimates of REE in women with overweight and obesity at each of these three different postpartum stages. Additionally, we aimed to investigate whether any equation would perform well across the entire postpartum period, despite changes in lactation status and body weight. Including measurement of fat-free mass (FFM) and fat mass (FM) may increase the precision in estimates of REE. However, equipment for measurement of body composition is not always accessible in clinical practice. Therefore, we aimed to identify the best performing equations, both with and without the inclusion of body composition variables.
Methods
Women with overweight or obesity were recruited during pregnancy or early postpartum from fifteen antenatal clinics in Gothenburg, Sweden. Measurements of REE, anthropometry and breastfeeding status were available for seventy-one women at baseline (10 weeks postpartum), and sixty-four and fifty-seven of the same women at 24 weeks and 15 months postpartum, respectively. Body composition measurements by dual-energy X-ray absorptiometry were only available for fifty-six of the fifty-seven women at 15 months. All participating women in the present data analysis had a BMI ≥25 kg/m2 at the 10-week postpartum visit, and had complete measurements of REE, height, weight and breastfeeding status on at least one visit. Written informed consent was obtained from all participants. The study was approved by the regional ethics board in Gothenburg, Sweden (483-06).
Measurements
The measurements were carried out by trained research staff at the laboratories of the Department of Internal Medicine and Clinical Nutrition, University of Gothenburg, Sweden, and at the Sahlgrenska University Hospital, Sweden. The women arrived at the research clinic in the morning, after an overnight fast, by car or public transport.
RMR
RMR was measured using the Deltatrac II Metabolic Monitor ventilated hood system (Datex-Ohmeda), after a 30-min rest in the supine position. The equipment was calibrated before each measurement in accordance with the instructions of the manufacturer. RMR was derived from the last 25 min of a 30-min measurement, and the value was extrapolated to 24 h to determine REE.
Anthropometry and body composition measurements
Height was measured to the nearest 0⋅5 cm using a wall-mounted stadiometer. The height measured at the baseline visit was used for all consecutive body composition analyses. Body weight was measured to the nearest 0⋅1 kg with light clothing, using an electronic scale (MC 180 MA; Tanita). FM (kg) and FFM (kg) were measured by dual-energy X-ray absorptiometry (Lunar Prodigy; GE Lunar Corp.).
Predictive equations
Predictive equations of REE obtained from a literature search in the Pub Med database (January 2018) fulfilling the following criteria were included: (i) equations based on body weight, height, age and/or FFM and FM; (ii) equations derived for both sexes or women only; (iii) equations developed for adults. The following predictive eqations were excluded: (i) equations developed only for (critically ill) patients, athletes, elderly or underweight populations; (ii) equations derived from small sample sizes (n <20); and (iii) equations being too complicated for use in clinical settings. When more than one equation was available from the same study, all equations relevant to our population were included. If there were multiple equations based on the same variables available, the equation with the highest value for explained variance (r 2) was chosen.
The literature search resulted in an inclusion of thirty-six REE predictive equations from eighteen scientific papers(Reference Bernstein, Thornton and Yang13–Reference Siervo, Boschi and Falconi30), of which twenty-five were weight-based and eleven were FFM-based (Supplementary Table S1).
Statistics and data analyses
For analyses of predicted REE (pREE) and measured REE (mREE), the three time points were analysed separately and all participants with complete measurements at each visit were included in the analyses. For each woman at each visit, the REE was predicted for all equations in MJ/d and compared with the REE measured by indirect calorimetry. The body weight, age, FFM and FM measured at the respective visit were used for this calculation. Equations derived for specific age or BMI groups were analysed as applied on the entire sample.
An accurate prediction of REE was defined as a pREE within ±10 % of mREE. A pREE less than 90 % of mREE was classified as an under-prediction, and a pREE exceeding 110 % of mREE was classified as an over-prediction. The bias was defined as the mean percentage error between pREE and mREE values. Systematic bias between pREE and mREE was defined as a bias of ≥±5 %. The root mean sum of squared errors (RMSE) was used to indicate how well each equation predicted REE in our sample. To clarify the extent of clinical risk of prediction inaccuracy in any given individual, the maximal underestimation and maximal overestimation found with every equation were reported.
The performance of the equations was evaluated primarily based on the percentage of women whose REE was accurately predicted, and secondarily based on bias and RMSE. The weight-based and the FFM-based equation with the highest performance at each visit, along with the equations producing ≥80 % accurate predictions at all three postpartum visits were graphically presented in Bland−Altman plots, in which the difference between pREE and mREE (pREE-mREE) was plotted against their averaged value (aREE). Furthermore, the differences (pREE-mREE) at 24 weeks and 15 months postpartum were plotted against percentage weight change from baseline (10 weeks postpartum), to analyse their predictive performance relative to weight change. Pearson's correlation was used to analyse whether there existed a relationship between differences (pREE-mREE) and aREE or percentage weight change.
Data were analysed using IBM SPSS version 25.0. P values <0⋅05 were considered statistically significant.
Results
The participating women had a mean BMI of 30⋅2 (sd 2⋅9) kg/m2 at 10 weeks postpartum, half of them were primiparous and the majority had a higher level of education (Table 1). There was a significant reduction in body weight between baseline and the subsequent follow-ups, mainly explained by the FM loss of those who were randomised to the dietary behaviour modification treatment (Table 2). The majority (93 %) were exclusively breastfeeding at 10 weeks postpartum, partially breastfeeding at 24 weeks postpartum (86 %) and no longer breastfeeding at 15 months postpartum (91 %).
Table 1. Background characteristics of the seventy-one lactating women with overweight or obesity included in the validation of resting energy expenditure (REE) predictive equations at three postpartum stages
(Mean values and standard deviations; numbers and percentages)

Table 2. Resting energy expenditure (REE), anthropometry, body composition and breastfeeding status at baseline, end of intervention and follow-up
(Mean values and standard deviations; changes; numbers and percentages)
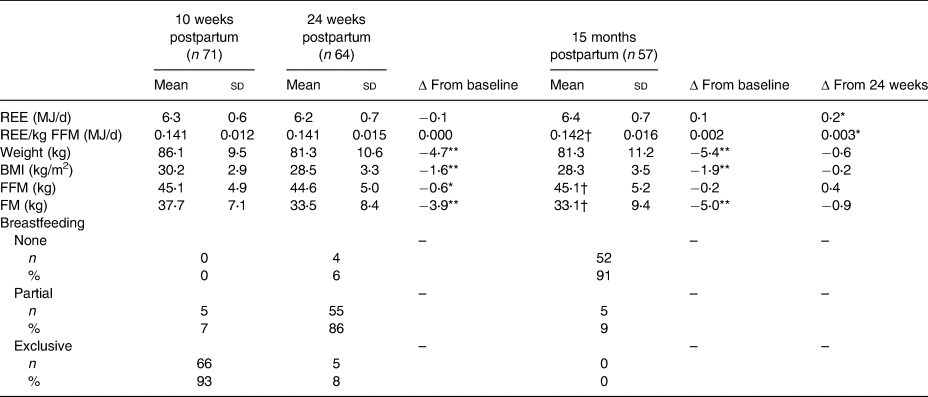
FFM, fat-free mass; FM, fat mass.
* P < 0⋅05, ** P < 0⋅001.
† n 56.
Results from the individual postpartum visits
A total of twelve equations accurately predicted REE in ≥80 % of women at 10 weeks postpartum, of which six were weight-based and six were FFM-based (Supplementary Table S2). The weight-based and the FFM-based equations with the highest performance were HenryW30−60 and LazzerFFM, which accurately predicted 89 and 92 % of the women, respectively. At 24 weeks postpartum, REE was accurately predicted in ≥80 % of the women by nine equations, of which four were weight-based and five were FFM-based (Supplementary Table S3). The equations achieving the highest percentage of accurately predicted women were Siervo (83 %) and JohnstoneFFM (86 %). At 15 months postpartum, REE was accurately predicted in ≥80 % of the women by ten equations, six of which were weight-based and four of which were FFM-based (Supplementary Table S4). Three weight-based equations (HenryWH30−60, SchofieldW30−60 and SchofieldWH30−60) achieved 83 % accurate predictions, whilst two FFM-based equations (MüllerFFMall and JohnstoneFFM) achieved 82 % accuarate predictions at this time point.
Results from the total postpartum period
REE was accurately predicted in ≥80 % of the women at all three postpartum visits by six predictive equations, of which two were weight-based: HenryWH30−60 and Livingston, and four were FFM-based: MüllerFFMall, MüllerFFM30, JohnstoneFFM and LazzerFFM (Table 3). Of the two weight-based equations, the overall average of accurate predictions was 83 % with HenryWH30−60, and 81 % with Livingston. Both equations showed a moderate negative correlation between differences and averaged REE values at all three visits (HenryWH30−60: r −0⋅41 and P = 0⋅000 at 10 weeks, r −0⋅44 and P = 0⋅000 at 24 weeks, and r −0⋅44 and P = 0⋅001 at 15 months postpartum; Livingston: r −0⋅57 and P = 0⋅000 at 10 weeks, r −0⋅52 and P = 0⋅000 at 24 weeks, and r −0⋅51 and P = 0⋅000 at 15 months postpartum), indicating an overestimation of lower REE values and an underestimation of higher REE values (Fig. 1(a) and (b)). Of the four FFM-based equations, the overall average of accurate predictions was 83 % with MüllerFFMall, 83 % with MüllerFFM30, 84 % with JohnstoneFFM and 85 % with LazzerFFM. MüllerFFMall showed a moderate negative correlation between differences and averaged REE values at all three visits (r −0⋅44 and P = 0⋅000 at 10 weeks, r −0⋅44 and P = 0⋅000 at 24 weeks, and r −0⋅43 and P = 0⋅001 at 15 months postpartum) (Fig. 1(c)). MüllerFFM30 showed a weak negative correlation between differences and average REE values at 10 weeks (r −0⋅39 and P = 0⋅001), and a moderate negative correlation at 24 weeks (r −0⋅40 and P = 0⋅001) and 15 months (r −0⋅40 and P = 0⋅002) (Fig. 1(d)). Neither JohnstoneFFM nor LazzerFFM showed any statistically significant correlation between differences and averaged REE values at any visit (Fig. 1(e) and (f)). Of the six equations with overall ≥80 % accurate predictions, a correlation between differences and percentage weight loss was present only with LazzerFFM at 15 months; however, the positive correlation was weak (r 0⋅28, P = 0⋅038) (Bland−Altman plot not shown).
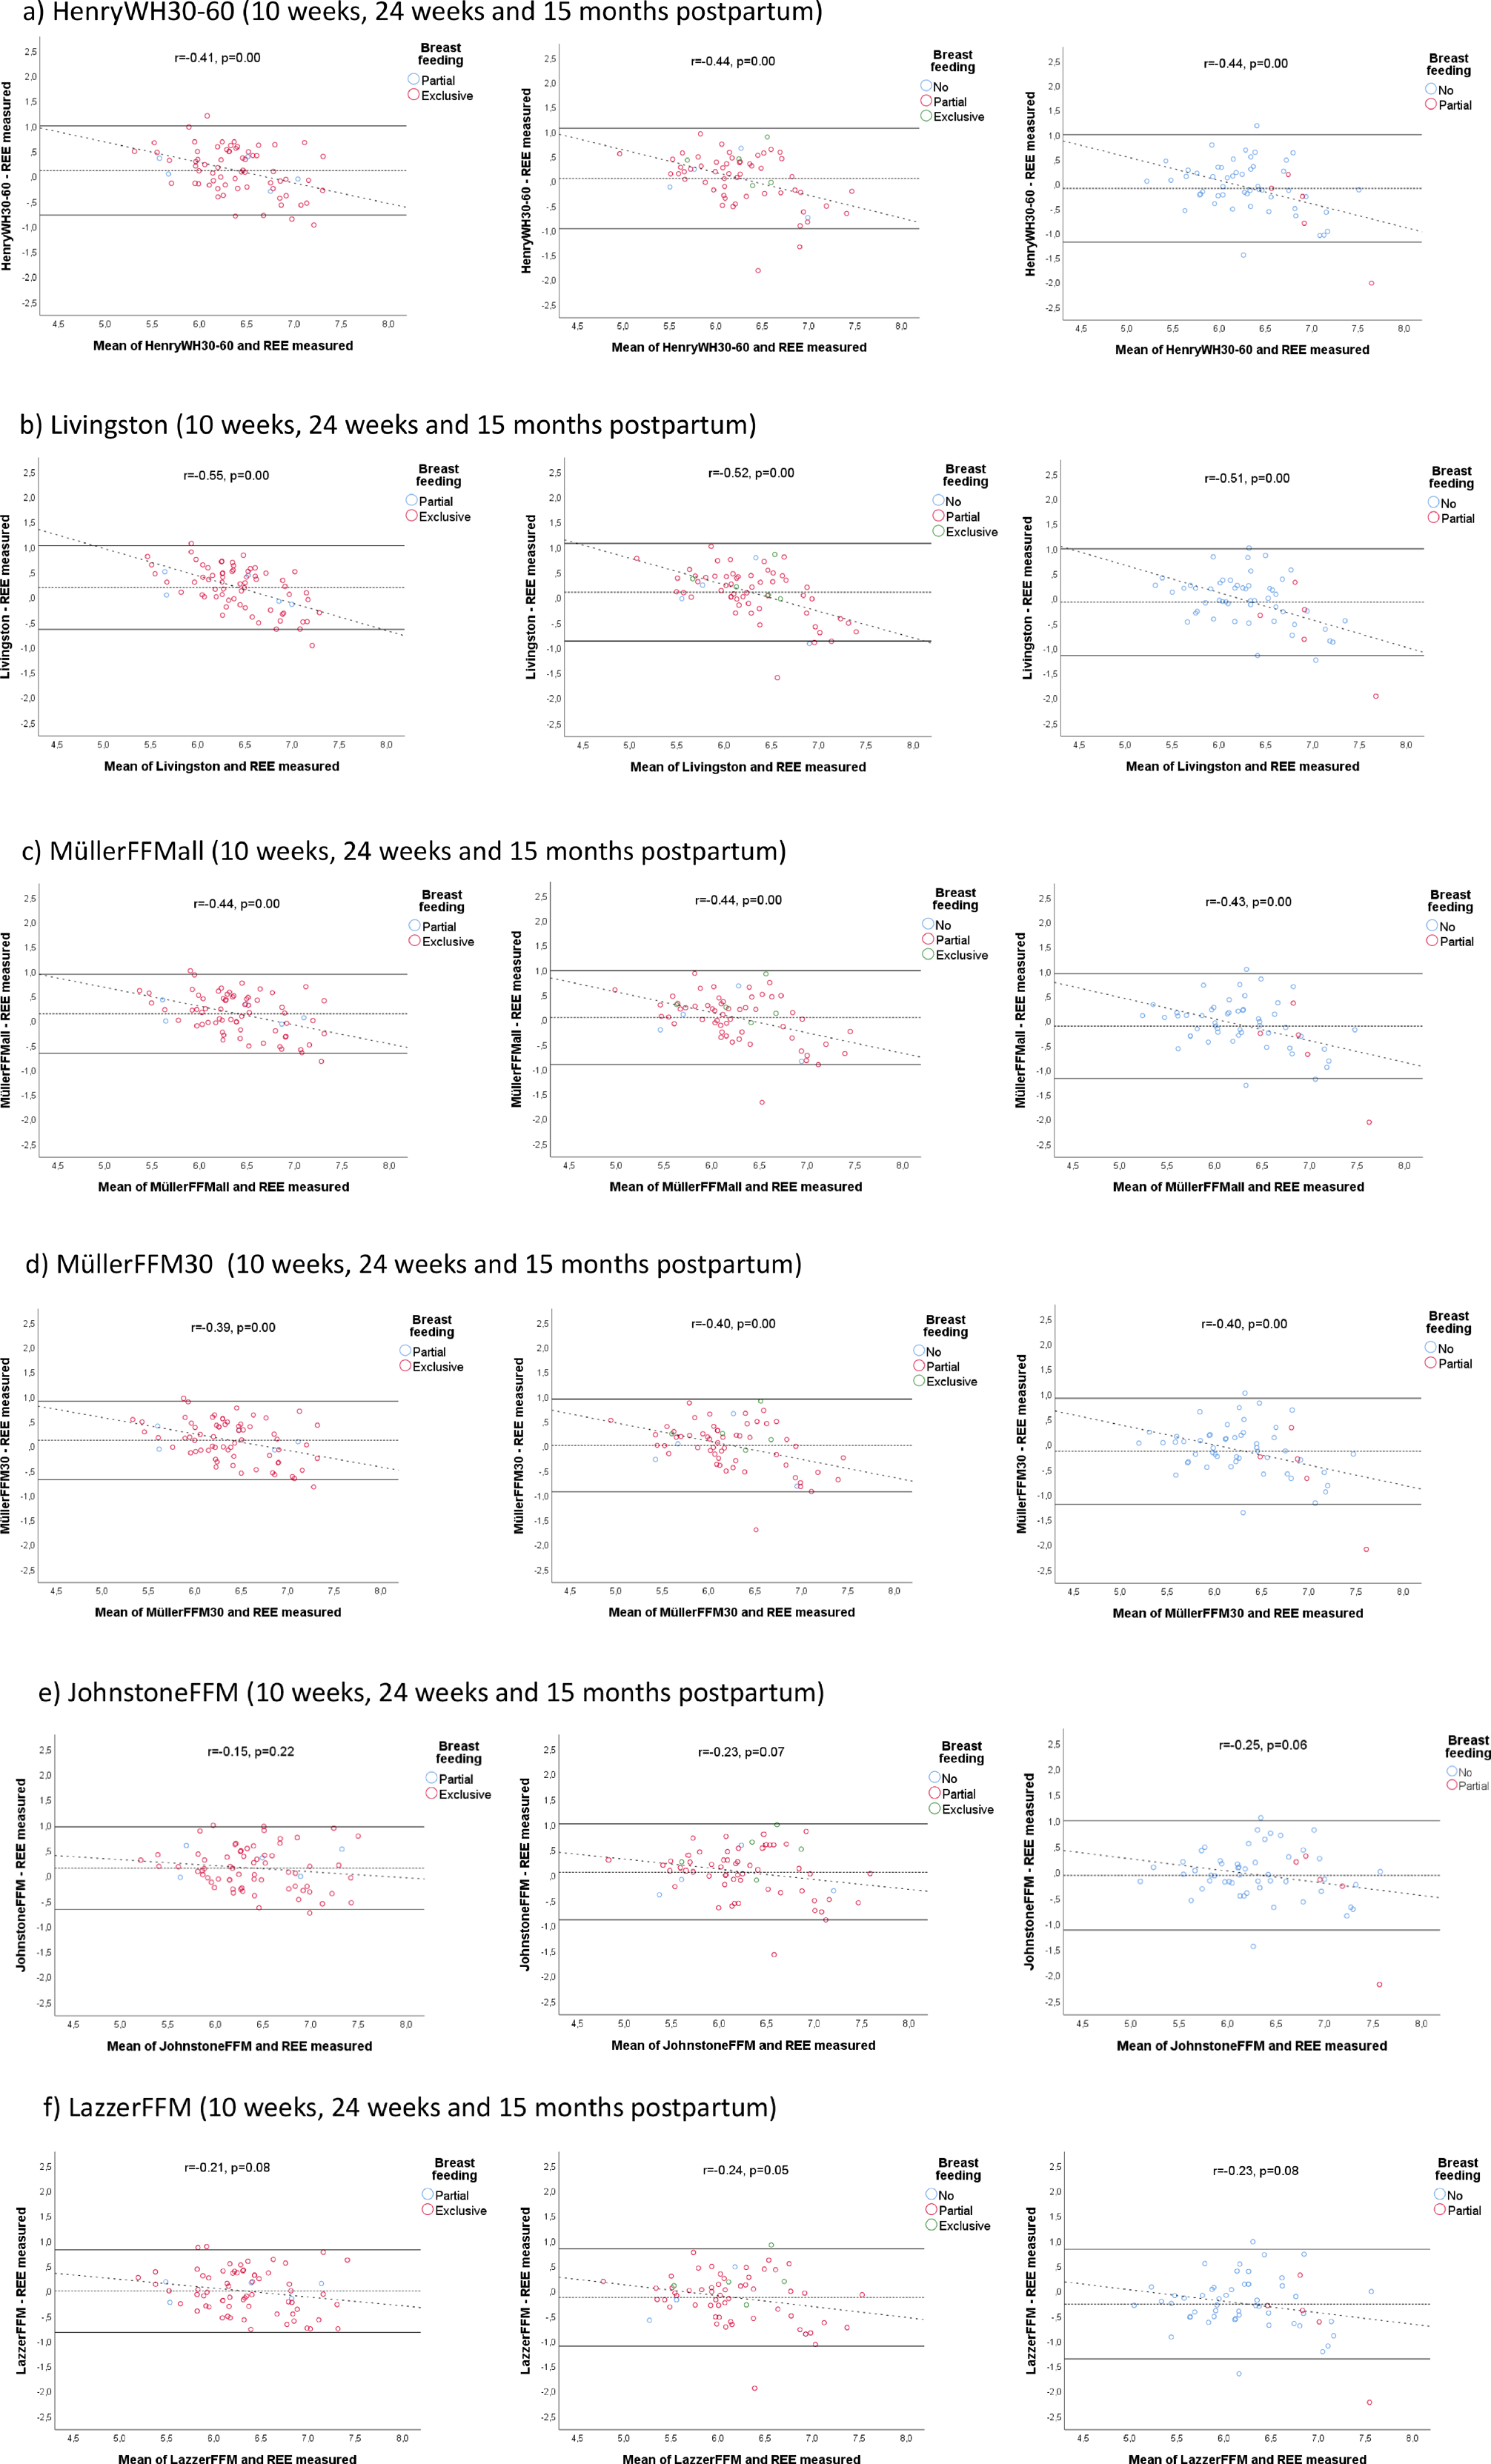
Fig. 1. (a–f) Bland−Altman plots of differences between predicted and measured resting energy expenditure (REE) for six predictive equations where resting energy expenditure was accurately predicted in ≥80 % of the women at all three postpartum stages. HenryWH30–60, Henry's predictive equation for age group 30–60 years; Livingston, Livingston's predictive equation for all age and BMI groups; MüllerFFMall, Müller's predictive equation for all BMI groups; MüllerFFM30, Müller's predictive equation for BMI group ≥ 30 kg/m2; JohnstoneFFM, Johnstone's predictive equation for all age and BMI groups; LazzerFFM, Lazzer's predictive equation for BMI group ≥ 40 kg/m2.
Table 3. Presentation of resting energy expenditure (REE) predictive equations with ≥80% accurate predictions at all three postpartum visits(Reference Bernstein, Thornton and Yang13–Reference Siervo, Boschi and Falconi30)
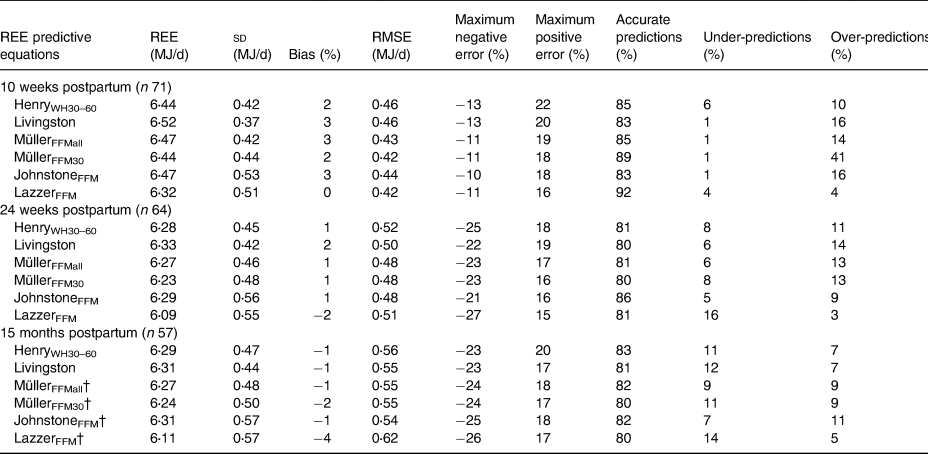
Bias, mean percentage error between predictive equation and measured value; RMSE, root mean sum of squared prediction error; Maximum negative error, the largest underprediction that was found with this predictive equation as a percentage of the measured value; Maximum positive error, the largest over-prediction that was found with this predictive equation as a percentage of the measured value; Accurate predictions, the percentage of subjects predicted by this equation within 10% of the measured value; Under-predictions, the percentage of subjects predicted by this equation <10% of the measured value; Over-predictions, the percentage of subjects predicted by this equation >10% of the measured value; HenryWH30–60, Henry's predictive equation based on weight and height for age group 30–60 years; Livingston, Livingston's predictive equation based on weight and age; MüllerFFMall, Müller's predictive equation based on FFM, FM and age for all BMI groups; MüllerFFM30, Müller's predictive equation based on FFM, FM and age for BMI group ≥ 30 kg/m2; JohnstoneFFM, Johnstone's predictive equation based on FFM, FM and age; LazzerFFM, Lazzer's predictive equation based on FFM and FM for BMI group ≥ 40 kg/m2.
† n 56.
The best performing equations for the total postpartum period (Table 3) were in several cases also among the best performing at each of the postpartum visits (Supplementary Tables S2–S4).
Discussion
In our population of Swedish postpartum women with overweight and obesity, REE was accurately predicted in ≥80 % at all visits by six equations. Although weight and breastfeeding status changed during the postpartum period, there was little gain in the proportion of accurately predicted REE values by choosing time-specific equations. There was also limited gain in choosing FFM-based equations.
Weight-based equations
Of the weight-based equations, HenryWH30−60 achieved the overall highest performance, with better results at all postpartum visits compared with Livingston. In addition, none of the weight-based equations with the highest percentage accurate predictions at one visit was remarkably superior to the HenryWH30−60 equation. The HenryWH30−60 equation was more than sufficient for predicting REE at all postpartum visits, and hence it could be used for groups that share the same characteristics as ours. Noteworthy, although a quarter of our group of lactating women with overweight and obesity were younger than 30 years of age and none was older than 41 years of age, still, the HenryWH30−60 performed better when applied to the whole group, irrespective of age. Actually, none of the age- or BMI group-specific equations provided higher percentages of accurate predictions at all three visits when applied to the intended age group only, as compared with the whole group. This becomes evident when looking at the low performance in general of the equations for the age group 18–30 years (Supplementary Tables S1−S3). Interestingly, the equations by Henry(Reference Henry17) have also been recommended for the general population in both the Nordic Nutrition Recommendations of 2012(31) and the European Food Safety Agency (EFSA) report on dietary reference values for energy of 2013(32). Nevertheless, the maximum negative and positive errors found by use of HenryWH30−60 compared with actual measurements of REE in our population were −25 and 22 %. The consequenes of such errors in clinical practice must be granted careful evaluation.
Fat-free mass-based equations
Of the FFM-based equations, LazzerFFM achieved the highest overall mean percentage accurate predicitons; however, the high performance was mainly explained by the extraordinary results at 10 weeks postpartum, at which 92 % of the women were accurately predicted, with no skewness in percentage under-predictions and over-predictions and small maximum errors. JohnstoneFFM, the FFM-based equation with the second highest overall percentage of accurate predictions, provided more similar results from visit to visit, than did LazzerFFM. Therefore, if a single FFM-based equation were to be recommended for the entire postpartum period, JohnstoneFFM would probably be the safer choice.
In agreement with other studies(Reference Pereira, Purcell and Elliott11,Reference Poli, Sanches and Moraes33) , the FFM-based equations did not markedly improve accuracy compared with the weight-based equations. The overall performance of both LazzerFFM and JohnstoneFFM cannot with certainty be considered superior to the overall performance of HenryWH30−60; thus, we do not consider it necessary to use an FFM-based equation for postpartum women when dual-energy X-ray absorptiometry is used to determine FFM. The discrepancies between the methods used to measure FFM comprise an additional uncertainty associated with these equations. Therefore, both the original population and the method used to measure FFM should be carefully considered before applying FFM-based equations to postpartum women.
Strengths of the strategy used
This study has several strengths. The measurements of REE were performed under well-controlled conditions and the population is well defined with regard to body composition and breastfeeding status. An additional strength of the present study is the broad range of well-documented statistical analyses used to validate the predictive equations. Each test measured a different aspect of the performance of the equations. Because these equations are used in clinical practice to estimate an individual's REE, and because group mean data may mask larger individual errors, a measure of prediction accuracy on the individual level was the main variable assessed. Prediction accuracy was defined as the percentage of subjects predicted within 10 % of the measured value, as described by Frankenfield et al.(Reference Frankenfield, Roth-Yousey and Compher34,Reference Frankenfield, Rowe and Smith35) . They considered this error limit on prediction accuracy to be consistent with accepted calorimetry measurement errors of 5 % or less(Reference Phang, Rich and Ronco36). Validation of equations based on the number of accurate predictions is widely recognised as the preferred method of such(Reference Madden, Mulrooney and Shah37).
Generalisability of our findings
It has been widely warned that caution should be exhibited when predictive equations are applied to groups that differ from the populations for which the equations were developed(Reference da Rocha, Alves and Silva6,Reference Thompson and Manore7) . No equation has yet been developed specifically for prediction of REE in postpartum women; however, our findings indicate that multiple existing equations may be highly suitable for this purpose. This is somewhat contradictory to the findings by de Sousa(Reference de Sousa, Maioli and Dos Santos10) where most equations overestimated REE. However, they measured at 1–10 d postpartum while our first measurement was at 10 weeks. Our results are in better agreement with Pereira et al.(Reference Pereira, Purcell and Elliott11) who found a number of equations with more than 80 % accurate predictions at 3 months postpartum, including one with 100 % (FAO/WHO/United Nations University (FAO/WHO/UNU), height and weight). We did not report here the results from FAO/WHO/UNU from 1985; however, we report the updated versions of these, the Schofield equations, which were not among the overall six best performing equations in our population. We have now also tested the 1985 equation from FAO/WHO/UNU and found a perfect correlation with Schofield although with a slight shift. Like the Schofield equations, those of the FAO/WHO/UNU (weight and height) from 1985 were not among the equations with the highest number of accurate predictions in our population. Previous studies differed from our study in that our population only had women with overweight/obesity and thereby was more homogeneous with respect to BMI. They had also lost on average 4⋅7 and 5⋅4 kg in weight at 6 months and 15 months, respectively. Another major difference is that we tested as many as thirty-six equations, also irrespective of the intended age group and found that this actually improved overall accuracy. Since predictive equations are expected to be valid for the original population only(Reference da Rocha, Alves and Silva6), it is advisable to validate the equations for each single specific population(Reference Weijs38). Although postpartum women are a very specific group, they are highly likely to exhibit large variability in factors that might affect REE. Caution should therefore be exercised before generalising the results of this study to postpartum women from otherwise divergent populations.
Unlike Pereira et al.(Reference Pereira, Purcell and Elliott11), we did not stratify and perform BMI group-specific analyses. However, there was a large shift in BMI categories over the postpartum period due to diet treatment. Still, one single equation (HenryWH30−60) performed well, irrespective of changes in weight and lactation status. In addition, equations measuring FFM did not improve accuracy. The results from our analyses are limited to women with pre-pregnancy BMI 25–35 kg/m2 and cannot be extrapolated to a normal-weight population.
Energy output in lactating women
For lactating women it is of crucial importance to acknowledge that the energy content of the human milk is not accounted for in estimations of REE; neither when measured by indirect calorimetry, nor when estimated by predictive equations. Therefore, this energy output, which for exclusively breastfeeding women approximates to 2⋅1 MJ/d(Reference Butte and King3), must always be subsequently added.
Limitations of predictive equations
Predictive equations hold a unique potential as a vital tool for health care providers due to their highly accessible nature. However, even if an equation with a perfect match, in regard to the characteristics of the population and the methods used, were to be selected, certain aspects need to be carefully considered before any credibility is assigned to its estimations. Even the most accurate predictive equations carry a clinically relevant error rate (about 20 %) relative to REE measured by indirect calorimetry(Reference Frankenfield, Roth-Yousey and Compher34). Use of adjusted body weight in predictive equations, as is often done for subjects with overweight and obesity, is discouraged as it has been found to decrease accuracy and drastically increase maximum underestimation errors(Reference Frankenfield, Roth-Yousey and Compher34). Practitioners need be aware of the possible magnitude of errors associated with REE predictive equations, and clinical judgment must be exercised to determine what level of nutrition care should be based on their predictions. Furthermore, energy intake goals based on prediction of REE may need to be adjusted subsequently if weight management is not achieved(Reference Willis, Herrmann and Ptomey39). For individuals in which accurate estimates are of particular importance, REE should always be determined by indirect calorimetry.
Conclusion
The weight-based equation with the highest performance was HenryWH30−60, with an overall mean of 83 % accurate predictions. The HenryWH30−60 equation was highly suitable for prediction of REE at all postpartum visits, and the accuracy was sustained across changes in weight and lactation status, and also in women below the intended age interval. No FFM-based equation was remarkably superior to HenryWH30−60.
Acknowledgements
We thank Elisabeth Gramatkovski and Anna Carin Hagstig for their assistance in data collection. We also thank the participating women for their cooperation.
This work was supported by grants from the Swedish Council for Working Life and Social Research (A. W.; 2006-0339) and the Swedish Research Council (A. W.; K2009-7B-21091-01-03). The funders had no role in the design, analysis or writing of the present article.
A. W., H. K. B. and F. B. designed the research; F. B. conducted the research; S. H. N. analysed data; S. H. N., I. O., H. K. B., A. W. and L. E. wrote the manuscript. All authors approved the final version submitted for publication.
The authors declare no conflicts of interest.
Supplementary material
The supplementary material for this article can be found at https://doi.org/10.1017/jns.2020.16


 Open access