


1 Introduction
After World War I, with the evolution of aircraft and the need for long-distance routes, the process of implementing navigation aids began. In 1925, the first discussions took place on methods that would help pilots navigate, without depending on weather conditions (Portilho and Bukzem, Reference Portilho and Bukzem2015). Several technology have been used for air navigation, mainly radionavigation using ground aids, known as conventional air navigation (ADF, automatic direction finder; VOR, very-high frequency (VHF) omnidirectional range; DME, distance measuring equipment).
The technological advance involving aviation, anchored in the need to adopt safer references to fly and the increase in world air traffic, intensified by globalisation, brought the need to implement new methods of navigation. In this scenario, performance based navigation (PBN), which uses the global navigation satellite system (GNSS), has been adopted to replace the so-called conventional air navigation, enabling the optimisation of airspace. The PBN concept represents a shift from sensor-based navigation to performance-based navigation. In aviation, the GNSS makes it possible to determine the position in time and space by means of satellites, receivers installed in aircraft, and systems for increasing and monitoring signal integrity (ICAO, 2017).
The PBN concept was introduced by ICAO in 2008 due to the need for worldwide standardisation of area navigation (RNAV) and required navigation performance (RNP) procedures that were being applied inconsistently from one country to another and from one region to another (ICAO, 2017). In this sense, PBN is not a new navigation system, but the unification of operational requirements for RNAV and RNP (Pamplona, Reference Pamplona2014).
Conventional navigation (VOR, DME, ADF) makes use of physical ground aids (or ground stations) that emit radio signals which are used by the equipment aboard the airplanes (VOR receiver, DME transceiver, ADF receiver) to calculate the navigation path. Therefore, to perform navigation using radios, the aircraft must be within reach of the radio signals emitted by the ground stations. The RNAV navigation, however, makes use of virtual coordinates, called waypoints, which are defined based on latitude and longitude. The aircraft equipment (mainly the GPS receivers) uses the waypoints information to calculate the navigation path based on received satellites signals. Therefore, RNAV allows the operation of an aircraft on any flight path without relying on ground aids, based on established positions using GPS signals. Figure 1 provides the comparison of the flight path between the conventional navigation and RNAV navigation of an aircraft going from an arbitrary point A to a destination airport at point B. In the RNAV navigation picture, the conventional navigation path is kept in the background with a lighter colour for comparison purpose. It is possible to note that the RNAV navigation is much more efficient in the sense that it does not have the constraint to reach the signals emitted by ground stations, and therefore it can have a more direct flight path.

Figure 1. Difference between conventional navigation and area navigation (RNAV). Source: modified from (ICAO, 2008)
The RNP is an RNAV navigation with the addition of performance monitoring and real-time onboard flight capability alert, maintaining the high level of navigation performance. The aircraft's navigation system is capable of monitoring and alerting on the aircraft's lateral deviations when there is a deviation beyond the limits established in each PBN specification, limiting a region around each trajectory and in each phase of the flight, and thus enabling greater accuracy and safety for navigation. The RNP procedures allow for greater exploitation of modern aircraft navigation systems and have more flexible characteristics than other air navigation procedures. The technology, guided by satellite, makes the flight path more continuous, generating fuel savings in aircraft operation and, consequently, reducing the emission of pollutants into the environment. It also makes it possible to optimise the meteorological minima of the approach procedures, increasing the probability of landing under more degraded roof and visibility conditions.
Due to the advances of PBN, airspaces near airports, known as terminal areas, are becoming increasingly more dense in terms of the number of aircraft. As described in ICAO (2008), within an airspace concept, PBN requirements are affected by the communication, surveillance and air traffic management (ATM) environments, the navaid infrastructure, and the functional and operational capabilities needed to meet the ATM application. In this sense, organisations that deal with technologies aimed at the aeronautical area can be considered complex organisations and must be able to manage the risks that are part of their activities, and several methods have been adopted to study these sociotechnical systems, including the functional resonance analysis method (FRAM) from Hollnagel (Reference Hollnagel2012).
Sociotechnical systems are characterised by the interaction between people and technology, applying to the most varied sectors and fields of activity (Pott et al., Reference Pott, Johnson and Cnossen2005; Ham et al., Reference Ham, Yoon and Han2008; Marshall et al., Reference Marshall, Harrison and Flanagan2009; Verbano and Turra, Reference Verbano and Turra2010). Complex systems comprise different groups of humans, technologies and organisations that may interact with each other in many industrial domains (Tian and Caponecchia, Reference Tian and Caponecchia2020). According to Christoffersen and Woods (Reference Christoffersen and Woods2001), the main characteristics of a complex system are the following.
(a) High degree of interconnection and interdependence between the components of the system, making it difficult for operators to predict the effects of their actions and how they propagate through the system.
(b) Uncertainty and variability in work processes due to the breadth of scenarios, so that it becomes a challenge for operators to make decisions at the right moments so that (sometimes conflicting) goals can be achieved.
Righi et al. (Reference Righi, Saurin and Wachs2015) provides a broad literature review on resilience engineering and its relation with complex sociotechnical systems. The authors identified research areas and proposed a research methodology for resilience engineering (RE). One of the definitions of RE identified by the authors that is related to complex sociotechnical systems is the one provided by Hollnagel et al. (Reference Hollnagel, Woods and Levenson2006), which says that ‘resilience engineering aims to enhance the ability of a complex socio-technical system to adapt or absorb disturbance, disruption and change’. The FRAM method proposed by Hollnagel (Reference Hollnagel2012), which will be used in the development of this paper, uses RE concepts to perform risk assessment of complex sociotechnical systems.
Given the level of safety required in the entire complex sociotechnical system involving aviation and the relevance of the benefits arising from an RNP procedure for the better use of increasingly crowded airspace, this paper seeks to address and analyse how this procedure is performed with the main participants. There is no intention in this paper to go deeper into all the activities involved in this procedure, but rather to focus on understanding how variability and complexity manifest themselves at the time of the aircraft's approach to the airport.
Evaluating the safety of RNP approach procedures is crucial for aviation safety as it directly impacts the safety of aircraft operations during this phase of flight. RNP procedures rely on advanced satellite-based navigation systems and onboard avionics to ensure accurate navigation during the approach phase. However, errors or malfunctions in these systems can lead to inaccurate navigation and potentially dangerous situations for aircraft, passengers and crew. Additionally, RNP procedures are continually evolving with the implementation of new technologies, which can introduce new safety risks. RNP approach procedures are often used in challenging terrain and weather conditions, as well as a wide variety of operational scenarios due to local characteristics, increasing the risk of accidents if safety hazards are not identified and addressed. Furthermore, the human factor associated with the RNP approach procedure may also affect the navigation performance, as Pilots may be the ones flying the aircraft and Air Traffic Controllers are responsible for providing safe separation between the aircraft. Therefore, evaluating the safety of RNP approach procedures is essential to identify and mitigate any potential hazards and ensure that the procedures meet stringent safety standards, but also contribute to the efficiency and sustainability of air transportation.
A few works have performed safety analysis of RNP procedures using different techniques and evaluating different aspects separately. Most of the papers involve an evaluation of PBN navigation in a more broad way, not restricted to RNP approach procedures. Pamplona and Jorge (Reference Pamplona and Jorge2019) perform a qualitative analysis of human factors related to the introduction and use of PBN procedures in aviation. The authors perform an academic literature review that focuses on the main human factors related to flight safety and operating in a PBN environment, concluding that the crew should be totally focused on the navigation procedures and when deviations occur, act quickly to avoid accidents and also that the correct understanding of what was requested and what is expected to be performed is important in the interaction between the flight controller and aircrew (Pamplona and Jorge, Reference Pamplona and Jorge2019). Tian et al. (Reference Tian, Wan, Chen and Yang2015) propose a method for safety assessment of PBN airspace operational planning, which is a computational model that combines the airspace conflict risk in the hierarchy of PBN airspace operation and with Air Traffic Controller (ATC) workload. In this work, the authors use a computational model to provide a quantitative analysis of PBN navigation. The authors conclude that in the operational planning, flight safety can be improved by adopting strategies such as changing aircraft separation, reducing air traffic flow and dynamic sectorisation (Tian et al., Reference Tian, Wan, Chen and Yang2015).
Fowler and Meyerhoff (Reference Fowler and Meyerhoff2018a, Reference Fowler and Meyerhoff2018b) provide a two-part study in which the authors describe a qualitative safety assessment of a new ATM operational concept – RNP parallel approach transitions (RPATs) – at a hypothetical major international-hub airport. Their paper outlines the safety specification of the new concept, which involves the use of a navigation system (RNP) that allows aircraft to approach the runway in parallel while maintaining safe separation (Fowler and Meyerhoff, Reference Fowler and Meyerhoff2018a). The authors developed a qualitative model in which they provide a safety assessment framework, based on hazards identification and risk assessment. The safety specifications include safety objectives, safety requirements and safety performance indicators. Rodrigues et al. (Reference Rodrigues, de Oliveira, de Oliveira Moraes and Marini-Pereira2022) also study the aircraft parallel approach, evaluating the operations at Sao Paulo Guarulhos airport. Their paper presents a safety analysis of a GNSS parallel runway approach operation at Guarulhos International Airport in Brazil, using a qualitative method called system-theoretic accident model and processes/systems-theoretic process analysis (STAMP/STPA). The safety analysis considers potential hazards related to equipment malfunction, communication failure, human error and weather conditions. The risks associated with these hazards are assessed using a quantitative risk analysis methodology. Their paper also provides recommendations for further safety improvements, including the use of backup navigation systems and the implementation of procedures to mitigate the risks associated with adverse weather conditions. The authors conclude that STAMP/STPA has proved to be a reliable method to assess hazards and their mitigation means (safety requirements) in the air traffic context (Rodrigues et al., Reference Rodrigues, de Oliveira, de Oliveira Moraes and Marini-Pereira2022).
The purpose of this paper is to perform a safety analysis of the RNP approach procedure. To address and understand the different interactions amongst the main participants, the first part of this paper performs an analysis using the FRAM methodology, which presents itself as a new alternative to traditional safety analysis. To address the performance variability resulting from FRAM, the second part of this paper applies the BBN methodology, which allows a quantitative assessment and evaluates the variability found in the FRAM analysis. Since FRAM is a qualitative approach, a few papers have addressed how to treat the performance variability that arises from the FRAM analysis, such as the combination with fuzzy networks (Hirose et al., Reference Hirose, Hideki, Hollnagel, Hill, Sawaragi and Slater2020) and Monte Carlo simulation (Patriarca et al., Reference Patriarca, Di Gravio and Costantino2017; Macêdo et al., Reference Macêdo, Cardoso Júnior and Silva2021). Also, combinations of BBN and other methods were performed by some authors, in which the second method was used to provide the relations and interdependencies among the parts involved in the analysis. Carvalho et al. (Reference Carvalho, Oliveira and Cardoso Junior2021) used the Delphi method and Bayesian networks in the evaluation of the influence of fatigue on occurrences of air traffic involving the process of practical instruction, and demonstrated that this combination can be a tool for risk assessment.
FRAM is a qualitative method that identifies system functions and interactions between them, while BBN is a probabilistic graphical model that represents uncertain relationships between variables. Combining these two methods can provide a more comprehensive analysis of the safety of complex systems, such as the RNP approach procedure, by allowing for the incorporation of both qualitative and quantitative data. The FRAM analysis allows to incorporate different aspects for complex systems, for example, human behaviour, technological systems and organisational structures, and qualitatively assess the different impacts the performance variability of those aspects can have on the overall performance of the complex system. The BBN analysis allows for the quantification of cause and effect relations identified for the complex systems. Those cause and effect relations may be analysed using models that identify the coupling of different aspects of the complex system, such as FRAM. A model that combines FRAM and BBN allows then for a more accurate assessment of the risks associated with the complex system, as well as an identification of potential safety improvements, since both models complement each other: FRAM provides the cause and effect relations and the possible performance variability sources (and also provide qualitative safety recommendations), and BBN quantifies those relations and provides numerical analysis allowing for more safety recommendations. The objective of this work is also to evaluate whether the combination of FRAM and BBN is suited for the safety analysis of RNP approach procedures and whether it produces good safety recommendations.
2 Literature review
2.1 Functional resonance analysis method
FRAM is a method that aims to understand how systems actually work and how variability spreads between their functions, aiming to develop more resilient systems (de Carvalho, Reference de Carvalho2011).
According to Hollnagel (Reference Hollnagel2012), FRAM is based on four principles: (1) principle of equivalency (success and failure). The assumption that different kinds of consequences do not need different kinds of causes, but the same explanation can be used in many – if not all – cases; (2) principle of approximate adjustments. The assumption that people continually adjust what they do so that actions match conditions; (3) principle of emergency. As they have a specific and identifiable cause, not all results can be explained; (4) principle of resonance. In cases where it is not possible, or reasonable, to base explanations on the principle of cause–effect, functional resonance can be used to describe nonlinear iterations and results.
Hollnagel (Reference Hollnagel2012) defines functional resonance as a detectable outcome that emerges from unintended interactions of the normal variability of multiple signals. Functional resonance provides a means of understanding outcomes that are non-causal (emerging) and nonlinear (disproportionate) in a way that makes prediction and control possible.
The application of the FRAM methodology consists of four steps (Hollnagel, Reference Hollnagel2012) which can be adapted as needed: (1) identification and description of the essential functions of the system. For this, the FRAM model uses the six aspects that are illustrated in Figure 2 of inputs, outputs, preconditions, resources, time and control. These aspects allow one to map how resources and preconditions are related to each other, providing a better understanding of how the work is being carried out in practice; (2) identification of performance variability. This step involves analysing the influence of different factors on the characterisation of the result (output) and observing the impact generated by these influences on the overall functioning of the system. In other words, this step is summed up in observing the impact of a given feature on other feature(s) of the same or different functions. This is because the variability of one aspect can affect the performance of others; (3) aggregation of variability. Once variability is identified, we must understand its dimension. Here, different aspects of variability will be analysed, seeking to demonstrate which aspects influence the others negatively or positively. Therefore, the focus is limited to understanding what are the chain reactions of the variability of different functions, reflected in the stability or instability of the system as a whole. This step focuses on examining specific model instances to understand how the potential variability of each function can become resonant, leading to unexpected results, as stated by the functional resonance process; (4) variability management. This step is summarised by the search for possible solutions for managing occurrences of uncontrolled performance variability (or functional resonance), which can occur in different ways. This last step consists of monitoring and managing performance variability, identified by the functional resonance in the previous steps. Performance variability can lead to both positive and negative results. The most fruitful strategy is to amplify the positive effects, facilitating their occurrence without losing control of activities, and dampening the negative effects, eliminating and preventing their occurrence.

Figure 2. Representation of an activity or function in the functional resonance analysis method (FRAM) and its six characteristic features. Adapted from Hollnagel et al. (Reference Hollnagel, Hounsgaard and Colligan2014)
According to Hollnagel (Reference Hollnagel2012), the description of the system, through the FRAM, involves detailing functions and aspects. Functions are the means used to achieve a certain result. The aspects characterise six dimensions of the functions, namely input, output, preconditions, resources, control and time.
One of the limitations of FRAM is the study of uncertainties. Some authors explore this by combining FRAM with other methods. Patriarca et al. (Reference Patriarca, Di Gravio and Costantino2017) proposes a semi-quantitative framework based on Monte Carlo simulation for an ATM system. The authors used the FRAM method to define the functions of the system, the coupling among functions and the variability of those functions. They then combined the variability results with Monte Carlo simulation to provide numerical results. The authors concluded that more than numerical results for the evaluation, their model could support the safety investigation process.
Another study performed by Hirose et al. (Reference Hirose, Hideki, Hollnagel, Hill, Sawaragi and Slater2020) explored the FRAM limitations combining the method with fuzzy networks. The paper tested the use of fuzzy sets and fuzzy logic to represent variability propagation in FRAM models. The authors provided a generic FRAM model and used fuzzy sets to demonstrate the propagation of variability from upstream to downstream functions. They concluded that the combination of the two methods is very promising and that this methodology can be further explored.
2.2 Bayesian belief networks
According to Noguerol (Reference Noguerol2002), there are several techniques capable of dealing with problems involving uncertainties, where the following stand out: case-based reasoning, artificial neural networks, coding correlation, fuzzy logic and Bayesian networks. Bayesian networks are distinguished by their ability to handle masses of sometimes incomplete data and the ability to learn from causal relationships, being the method chosen in this work for the quantitative representation of the variability found in the functions that make up the aircraft navigation system (RNP).
The BBN can be understood as one of the statistical theories that help in finding solutions to problems where there is no absolute certainty of evidence, where probability interprets the degree of belief of an event. For Noguerol (Reference Noguerol2002), Bayesian methods allow the quantitative representation of this degree of belief about the evidence and manipulate them according to the laws of classical probability.
According to Marques and Dutra (Reference Marques and Dutra2002), a system that can act in situations of uncertainty must be able to assign reliability levels to all sentences in its knowledge base, and also establish relationships between the sentences. Within this context, two main approaches can be used: logical reasoning and probabilistic reasoning. Logical reasoning considers prior knowledge, drawing its conclusions from it. In situations where the entire scope of the problem is not previously known, probabilistic reasoning appears as a good solution. The benefit of probabilistic reasoning is that it provides security for agents to make rational decisions, even when there is not enough information.
Bayesian networks were developed in the 1970s, with the purpose and ability to coordinate bidirectional inferences, emerging as a generic representation scheme for uncertain knowledge, according to Noguerol (Reference Noguerol2002). The main idea is to use a restricted representation, where only interacting groups are described, calculating the probability of an event occurring conditioned to the occurrence of another, eliminating the need to use a huge table of joint probabilities which list the probabilities of all possible combinations of events, since most events are conditionally independent of each other, and their interactions can be disregarded.
Due to the fact that Bayesian networks are a set of local probabilities associated with each variable and independence relations between these variables modelled by the structure of the network, the number of probabilities in a sample space $\textbf {X}=\{X_1, X_2,\ldots, X_n\}$ can be considerably reduced.
For Marques and Dutra (Reference Marques and Dutra2002), the Bayesian network is a graphical representation of a probabilistic dependency model. The author also defines as a directed acyclic graph (DAG), where the nodes represent the variables (of interest) of a domain and the arcs represent the conditional or informative dependence between the variables. Expert knowledge is used, and with the use of computational resources, uncertainties are demonstrated in the form of cyclic and directed graphs with their probabilistic dependencies between the so-called ‘nodes’ (Moura et al., Reference Moura, Vilar, Correia Neto and Mourato2015).
According to Marques and Dutra (Reference Marques and Dutra2002), the Bayesian network is represented as follows: (1) a set of variables and a set of arcs connecting the variables; (2) each variable has a limited set of mutually exclusive states; (3) variables and arcs form a DAG; (4) for each variable A that has $B_1, \ldots, B_n$ as parents, there is a conditional probability table (CPT) or node probability table (NPT) $P(A\,|\, B_1, \ldots, B_n)$
 . Once the network topology is defined, it is enough to specify the probabilities of the nodes that participate in direct dependencies, and use these to compute the other probabilities that one wishes.
As illustrated and explained by Noguerol (Reference Noguerol2002), the independence of two variables ($X$ and $Y$
 ) can be represented with the paths of the graph that connect $X$
 and $Y$
 , given a third known factor, $Z$
 , as illustrated in Figure 3.

Figure 3. Independence between two variables ($X$ and $Y$
 ) in relation to a $Z$
 factor. Source: the authors
Thus, if the variable $Z$ is known, then $X$
 and $Y$
 are independent, given $Z$
 . This makes it possible to reduce the numerical parameters of the conditioned probabilities. However, the experts’ knowledge base is very important for setting up the network.
In 1991, Charniak (Reference Charniak1991) already presented in AI Magazine, an official publication of the Association for the Advancement of Artificial Intelligence, some factors that could condition the lack of information in a knowledge base, the main ones being as follows.
• Impossibility. In some cases, the work required to insert all the antecedents or consequences that make up a knowledge base, where any inferences about the problem domain can be made, can be very costly.
• Theoretical ignorance. In some cases, the entire domain of the problem is not known.
In this way, dealing with lack of information means dealing with uncertainties. In these cases, it is necessary to use connectives that manipulate levels of certainty and not just Boolean values, true (1) and false (0). For characterisation of situations of uncertainty, we can use graphs representing causal relationships between two events or among more than two events.
Some authors have explored the use of BBNs to perform risk assessment for events. Fenton and Neil (Reference Fenton and Neil2011) evaluates the use of a model using a BBN to provide risk quantification as well as decision support for risk management to overcome the limitations of data-driven statistical approaches and risk registers. According to the authors, ‘the BBN approach helps to identify, understand and quantify the complex interrelationships (underlying even seemingly simple situations), and can help us make sense of how risks emerge, are connected and how we might represent our control and mitigation of them’.
2.3 Required navigation performance
To understand the concepts associated with RNP, one must first understand the concepts associated with RNAV. For air navigation that allows the aircraft to operate on a specific trajectory based on a constellation of satellites or on-board inertial equipment, RNAV capability can be achieved with one or a combination of the aforementioned technologies (ANAC, 2017). In this way, the restrictions that were previously placed by traditional ground navigation aids, where the aircraft needed to bypass the aids, are removed, allowing for flexibility and operational efficiency.
The navigation function uses different aircraft data, such as speed, present position, deviation from the route, destination and magnetic variation, among others, to calculate all the necessary guidance parameters for the aircraft. RNAV allows different types of sensors to be used to acquire and process this information, such as GNSS, DME and inertial systems. Information is shown to pilots via aircraft displays.
Most RNAV systems have a database with procedures published by responsible agencies, in which paths, or air routes, are created using points on the ground (known as waypoints). An RNAV procedure is composed of the combination of different waypoints that lead the aircraft from the departure point to the arrival point. In Brazil, the body responsible for creating, validating and publishing procedures is the Department of Control of Airspace (DECEA), which is part of the Brazilian Air Force (FAB).
During an RNAV procedure, the aircraft system monitors some parameters to ensure information integrity and system performance. RNAV specifications are a set of criteria that must be followed by systems, mainly with regards to position error. An RNAV ‘X’ specification means that the system's lateral position error is expected to be within ‘X’ nautical miles of expected for 95% of the flight time. This means that an RNAV 1 procedure indicates that the lateral position error must be less than 1 nautical mile during 95% of the flight time for that procedure.
The RNP specifications, in turn, are defined as a set of navigation specifications based on an area navigation system (RNAV) that includes the requirement for the aircraft to have a monitoring and alert system for route deviations (ANAC, 2017). Therefore, an RNP procedure is the same as an RNAV procedure with the difference that the system must monitor and issue alerts when the lateral position error is greater than specified for that procedure. For the approach phase specifically, the RNP specification is known as RNP APCH and RNP AR APCH, which have more restricted navigation lateral precisions.
The RNAV and RNP procedure types, as well as the required lateral accuracy and application sites, are shown in Table 1.
Table 1. Application areas and lateral accuracies associated with RNAV and RNP procedures

Source: ANAC (2017)
3 Methodology
In this paper, a FRAM model was developed to represent the actions performed for the execution of an RNP procedure by an aircraft. The different stakeholders are represented in the model and their interactions are described using the aspects input, output, preconditions, resources, control and time for the functions. Using the FRAM Model Visualiser software (https://functionalresonance.com/FMV/index.html), it was possible to visualise the functions and their couplings with the other functions in the RNP procedure, regarding the approach phase of flight. The RNP procedure described in this paper is not restricted to a specific airport. However, the model will be presented based on an RNP procedure being executed in Brazil.
As it is a highly complex system, the study was limited to functions that directly involved the approximation phase, not delving into variability that could occur in functions outside this scope. The description of the functions and the analyses performed were based on reports and procedures published by the aviation agencies (such as the Brazilian ATC Control Department (DECEA)), by an aircraft pilot, by an avionics engineer specialised in RNP navigation and by the experience of a PhD expert in the use of GNSS for aircraft navigation. Table 2 provides the qualifications of the people involved.
Table 2. Professional experience of elicitated professionals

Finally, since the FRAM is a qualitative method, as a complement, a modelling of the BBN was carried out to assess the influence exerted by three functions in the aircraft that are performing the RNP procedure. The FRAM analysis performed in the first part of the paper gives the sources for variability for each function and also the topology for the network (or DAG) with cause–effect relations among the functions, which may be difficult to determine when performing a BBN analysis. The BBN analysis, however, is used to evaluate the variability and uncertainties derived from the FRAM analysis. This is the main reason why the two methods were combined for this safety analysis: they both complement each other on their limitations. For this paper, the BBN analysis was carried out using the NETICA software (https://www.norsys.com/download.html). In this process, the probability values were elicitated with the support of the aforementioned experts in the field.
The following sections present the FRAM model and explain all the factors that were taken into consideration when developing the model. They also present the BBN model that was developed to perform the quantitative evaluation of the qualitative considerations evaluated in the FRAM model.
3.1 FRAM model
The FRAM modelling functions for an RNP approach procedure were organised into preparation (showed in blue), execution (showed in red) and completion (showed in green) functions. This division was made to facilitate the understanding of the model and to clarify the links between the different steps adopted to carry out the RNP procedure. Figure 4 shows the complete FRAM model.

Figure 4. FRAM modelling of RNP approach procedure
As stated in Section 2.3, for an aircraft to perform an RNP procedure, it must be published by agencies responsible for the activity in each country. In the case of Brazil, the responsible body is DECEA and this activity is represented by the function <To Publish RNP approach procedure>. With the procedures published, airlines need to request authorisation for all flights they will carry out and include in the authorisation which procedure they intend to carry out. For each flight, then, the airline needs <To Request flight plan authorisation with RNP approach> to DECEA, which authorises the flight with the procedure based on the occupation of airspace and aircraft characteristics, activity represented by the function <To Authorise flight plan with RNP procedure>.
As seen in Section 2.3, RNP procedures can be performed using different sensors. For the present work, it will be considered that the sensor used is the one based on a satellite (GNSS). In this case, the global positioning system (GPS), a satellite-based system of the American government, was adopted. The activity of providing the GPS signal is represented by the function <To Provide GPS signal> and the output of this signal is used by the aircraft to make the necessary calculations for navigation. This activity is represented by the function <To Acquire GPS signal>. The information acquired by the aircraft's GPS receivers is processed and shown to Pilots on the aircraft's displays, an activity represented by the function <To Show aircraft position based on GPS signal>. Upon arriving at the approach phase of the flight (near the airport), having acquired the GPS signal and with the information shown on the displays, the Pilot requests authorisation to perform the RNP procedure that had been previously authorised by the control agency. The request is represented by the function <To Request authorisation to execute the RNP approach>, which is received by an ATC who analyses all the aircraft present in the region where this aircraft will pass (also known as terminal area), through the function <To Check aircraft position in the airport terminal> , and authorises the execution of the procedure if everything is in compliance, an activity represented by the function <To Authorise execution of RNP procedure>.
After receiving the authorisation, the Pilot starts to execute the RNP procedure and must keep the aircraft on the programmed route for that particular procedure using the GPS signal previously acquired and the information shown on the displays, an activity represented by the function <To Keep aircraft on the programmed route>. As a simplification for the model, it was assumed that the control of the aircraft during the RNP procedure is done by the Pilot manually, with no coupling with the autopilot. This is the main function of the model, as it represents the RNP procedure being executed by the Pilot. As seen in Section 2.3, the RNP specifications provide for the aircraft system to have a way of monitoring the performance of the navigation system (represented by the function <To Monitor system navigation performance>), evaluating the lateral position error and issuing an alert for the crew if the error is greater than allowed. For the approach phase, the system must issue an alert to the crew if the error remains after 10 seconds. The activity of evaluating the error and issuing the alert after 10 s, which is part of the aircraft monitoring system, represented by the function <To Assess aircraft position error and issue alert after 10 s>, is used by the aircraft's alert system, represented by the function <To Alert crew if position error is greater than allowed>. During the entire execution of the RNP procedure by the Pilot, the ATC follows the aircraft through its radars and requests corrections if it identifies that the aircraft has any position error in relation to the published procedure, an activity represented by the function <To Check aircraft position executing procedure RNP>.
At the end of the execution of the RNP procedure, the aircraft is in the final stage of the flight, close to the runway threshold, ready for landing. Thus, the Pilot requests authorisation to land the aircraft from the Air Traffic Controller, an activity represented by the function <To Request landing authorisation>. Upon receiving the request, the ATC checks whether the runway is clear of aircraft, an activity represented by the function <To Check whether the runway is clear>, and also checks the positions of the aircraft around the airport, in case the aircraft that is landing needs to abort the landing and go around (<Check position of aircraft at airport terminal area>). If everything is cleared, the ATC authorises the landing (<To Authorise aircraft landing>) and the Pilot performs the aircraft landing (<To Land the aircraft>).
In this paper, there is no interest in specifically evaluating the preparation activities (<To Publish RNP approach procedure>, <To Request flight plan authorisation with RNP approach>, <To Authorise flight plan with RNP procedure> and <To Provide GPS signal>), so they were considered as background functions. In addition, the completion phase was simplified, since it is not the focus of this paper.
3.2 BBN model
To evaluate the influence of the outputs identified in the modelling obtained through the FRAM method of the functions <To Acquire GPS signal> and <To Check aircraft position executing RNP procedure> in the function <To Keep aircraft on programmed route>, which is the main function in the model, since it represents the aircraft performing the procedure in this study, a Bayesian network analysis of the functions <To Acquire GPS signal>, <To Keep aircraft on programmed route>, <To Show aircraft position based on GPS signal> and <To Check aircraft position executing RNP procedure> is performed.
In addition, it was intended to analyse a variability scenario due to the internal and external factors of the functions <To Acquire GPS signal> and <To Check aircraft position executing RNP procedure> and also evaluate the upstream–downstream couplings of the instantiated functions and the function <To Keep aircraft on programmed route>.
The output of the function <To Acquire GPS signal> represents one of the main resources used during the RNP approach procedure, since without it the aircraft cannot perform the procedure and any type of variability in this output will impact the entire execution of the procedure. The function <To Keep aircraft on programmed route> represents the RNP approach procedure being performed by the Pilot, being the most impacted function by the variability of the previous functions. Furthermore, looking at Figure 4, it is possible to notice that this function is the one that connects the execution cluster to the completion cluster. The function <To Check aircraft position executing RNP procedure>, however, represents one of the main controls performed in the function <To Keep aircraft on programmed route>, since it presents the activity of the Air Traffic Controller that checks the execution of the RNP procedure by the Pilot and which must issue control orders so that the procedure is carried out correctly.
The Bayesian network of the functions <To Acquire GPS signal>, <To Keep aircraft on programmed route>, <To Show aircraft position based on GPS signal> and <To Check aircraft position executing RNP procedure> is shown in Figure 5. The Bayesian network enables a quantitative analysis of the probability of occurrence of variability of functions identified as having an impact on a system.

Figure 5. Representation of the Bayesian network
4 Analysis and results
This section presents the application of the FRAM to visualise the function and its couplings with the other functions that are performed in the RNP procedure regarding the aircraft approach phase, as well as the use of Bayesian networks to quantify the variability found.
4.1 FRAM analysis
The first part of the analysis is to evaluate the FRAM model described in Section 3.1 and perform all the analyses taking into account all the factors affecting each function.
4.1.1 Variability analysis
In this section, internal and external system variability analysis, performance variability analysis and upstream–dowstream analysis will be performed. All analyses were developed in conjunction with experts in the field.
4.1.1.1 Internal and external variability
According to Hollnagel (Reference Hollnagel2012), functions shall be classified as individual, technological or organisational. Each type of function has particular characteristics and distinct sources of variability.
Table 3 lists the FRAM modelling functions related to the RNP approximation procedure, classifying them according to the type of function (organisational, human or technological) and possible sources of internal and external variability. The fifth column indicates the uncertainty (high, medium or low) and the sixth column the range of variability (large, medium or small) if it occurs. Since the model presented is about generalised factors and not a specific scenario, the functions and their performers were treated as general characters with average characteristics. Thus, the sources of variability are not specific and are listed in a generic way.
Table 3. Internal and external variability

Through the analysis of internal and external variability, it was possible to verify how variability can occur in each function, showing the main sources of variability, the probability of occurring and its dimension. One can observe that the human characteristic functions (individual functions) are the ones that have a high probability of generating variability with a high associated amplitude. The organisational functions, however, present a low frequency for variability, but with a high impact if they occur, especially considering that they are the functions considered to be the preparation for the procedure. The only technological function considered with high frequency and amplitudes is the <To Acquire GPS signal>, due to specific factors related to the effects of the ionosphere in South America (effects that occur in the Earth's atmosphere due to the ionosphere layer and that degrade the electromagnetic signal that it refracts due to variations in the amount of free electrons and, consequently, in the formation of the magnetic field at the points where the signals propagate (Kelley, Reference Kelley1989)).
It is possible to observe that the five functions that have variability with high frequency and amplitude are <To Keep aircraft on programmed route>, <To Acquire GPS signal>, <To Check aircraft position at airport terminal area>, <To Check aircraft position performing RNP procedure> and <To Land the aircraft>. Most of the functions are in the execution phase of the RNP procedure.
4.1.1.2 Performance variability
Performance variability analysis aims to identify how the variability of function output can be observed or detected in the sense of how it can affect latter functions, in addition to the characteristics of this variability. In the following analysis, the simple solution proposed by Hollnagel (Reference Hollnagel2012) was used, in which the possible performance consequences caused by variability in terms of time and accuracy are described.
With respect to time, the output of a function can happen too early, on time, too late or not at all. The category ‘not at all’ can be interpreted as an extreme version of ‘too late’, where the output is not produced or produced so late that, for all intents and purposes, it is useless for the later function (Hollnagel, Reference Hollnagel2012). In terms of accuracy, the output of a function can be accurate, acceptable or inaccurate. An acceptable output can be used by the latter function, but it requires some kind of adjustment or variability of the latter function (Hollnagel, Reference Hollnagel2012). The effects of inaccurate outputs are similar to those of acceptable output, but with greater magnitude.
Table 4 presents the possibility of performance variability occurring for the output of each function of the model with respect to time or precision. Possible reasons for this variability were discussed in the previous section (internal and external variability). The probabilities will be characterised as typical, likely, possible and unlikely (highest to smallest possibility of occurring).
Table 4. Performance variability

As shown in Table 4, the outputs of all functions can vary in terms of accuracy and time. This shows that it is important to assess the interaction between functions and how these variability manifest throughout the model.
4.1.1.3 Upstream–downstream variability
The variability of a function can occur through the result of links among functions. The increase or decrease in variability can vary in relation to the time and precision of the output sent by a given function. Also, variability can vary depending on how the output was used by the post function (input, precondition, resource, control or time). This impact can be positive, null or negative, increasing or decreasing the downstream variability of the function.
The upstream–downstream coupling analysis reveals how the variability of the outputs of the previous functions are perceived by the later functions and, consequently, what effects these variability have on their outputs. To perform this analysis, it is necessary to instantiate the model and evaluate the combinations of functions. As the present work aims to evaluate the model using Bayesian networks, this upstream–downstream coupling analysis will be performed quantitatively specifically for certain functions in Section 4.2.
In general, it is possible to evaluate the variability due to upstream–downstream coupling based on the method described by Hollnagel (Reference Hollnagel2012). The model functions were evaluated in general and the result of the variability is shown in Table 5. In the analysis, the symbol V$\uparrow$ means the variability is likely to increase; the symbol V$\downarrow$
 indicates a possibility of the variability decreasing (possible damping); finally, V$\leftrightarrow$
 indicates that the variability will likely remain unchanged. Table 5 indicates the possible change in the variability of the functions according to the time and precision variables, considering the outputs of previous functions being used as input, precondition, resource, control and time of downstream functions.
Table 5. Upstream–downstream coupling variability

Source: the authors, adapted from Hollnagel (Reference Hollnagel2012).
With respect to the outputs of the upper functions being used as inputs to the downstream functions, when the function starts earlier, there may be problems with synchronisation or for processing the information. If the input is used to start the function, then time variability is more important (and timing and delay issues become more evident). If the input is received or operated by the function, then accuracy variability is more important (inaccurate data and information take longer to process and verify).
Taking into account that in many cases, a function cannot be performed unless preconditions are established, if the state of that precondition cannot be determined, the variability of downstream functions can increase. It may be necessary either to wait until the condition is established (leading to a waste of time), or it may be necessary to question the previous function (when and if possible) to see if the condition has already been established (which also leads to a waste of time).
Resources represent something that is necessary to be consumed by a function (Hollnagel, Reference Hollnagel2012). Thus, the lack of the resource or an inaccurate resource can lead to the search for alternatives, at the very least increasing the time spent and introducing a delay in the output of the function. If the alternative is not exactly what the function needs, the output of the function may be less than expected.
When the control of a function is inaccurate, the function may vary and be performed differently than anticipated. When the control is not present, the function may not occur or occur, however inaccurately.
Finally, time represents the various temporal relationships that can influence how a function is performed (Hollnagel, Reference Hollnagel2012). When there is little time, trade-offs or sacrifices will probably occur in the model, which can lead to the non-compliance with respect to certain preconditions, increasing the variability in terms of time (synchronisation) and accuracy (inaccurate outputs).
4.2 Bayesian belief network analysis
The Bayesian network analysis in this paper aims to evaluate the accuracy of the output of functions (accurate, inaccurate or acceptable). By taking into account the variability analysis presented in Section 4.1.1, the probabilities of occurrences in the functions <To Acquire GPS signal>, <To Show aircraft position based on GPS signal>, <To Check aircraft position executing RNP procedure> and <To Keep aircraft on programmed route> were set using the BBN model presented in Section 3.2. First, the probabilities are defined for each function individually. Then, two analyses are performed: one with no influence from the referenced values (no change in the output of functions) and one with influence from the referenced values (changing the output of functions). The complete analysis is shown in the next sections.
4.2.1 Probability calculation for functions
4.2.1.1 Probability calculation of function <To Acquire GPS signal>
The first function to be modelled for setting up the network was the <To Acquire GPS signal function. As previously mentioned, it is a technological function, however, due to factors related to the effects of the ionosphere in South America, the referred function was set with 85% (eighty-five percent) probability of providing a signal ‘Accurate’, 10% (ten percent) probability of providing an ‘Acceptable’ signal and 5% (five percent) probability of providing an ‘Inaccurate’ signal.
The ionosphere can cause delays in radio signal propagation, while in low-latitude regions, large plasma bubble structures generate rapid amplitude and phase signal fluctuations during the early night hours. These plasma irregularities compromise GNSS-based positioning and navigation (de Oliveira Moraes et al., Reference de Oliveira Moraes, Vani, Costa, Abdu, de Paula, Sousasantos, Monico, Forte, de Siqueira Negreti and Shimabukuro2018), especially for users requiring higher accuracy and integrity. However, for the type of procedure studied in this work (RNP, classified as a non-precision approach – NPA), even though some degradation in the signal is considered in this analysis, the influence of the ionosphere at low latitudes is negligible in practical terms, as stated by Marini-Pereira et al. (Reference Marini-Pereira, Pullen, de Oliveira Moraes and Sousasantos2021). This category of approach procedure uses only the horizontal components of positioning, allowing for errors of over 100 m. The ionospheric impact at low latitudes is more significant on augmentation systems, as discussed by Marini-Pereira et al. (Reference Marini-Pereira, Pullen, de Oliveira Moraes and Sousasantos2021), Sousasantos et al. (Reference Sousasantos, Marini-Pereira, de Oliveira Moraes and Pullen2021) and Monico et al. (Reference Monico, de Paula, de Oliveira Moraes, Costa, Shimabukuro, Alves, Souza, Camargo, Prol, Vani, Pereira, de Oliveira Junior, Tsuchiya and Aguiar2022) for the ground-based augmentation system (GBAS).
Figure 6 shows the probabilities for function <To Acquire GPS signal>.

Figure 6. Probabilities included in Netica program for function <To Acquire GPS signal>
4.2.1.2 Probability calculation of function <To Show aircraft position based on GPS signal>
The function <To Show aircraft position based on GPS signal> is a function designed to have a very small variability, 1 misleading event per 1 million hours flown (approximately), that is, even if there is a possibility of an misleading event in the display, it is too small.
This function was scored by taking the variability analysis with a 95% (ninety-five percent) probability of being accurate when it receives an accurate GPS signal. The other probabilities were calculated based on this assumption. Figure 7 shows the probabilities for function <To Show aircraft position based on GPS signal>.

Figure 7. Probabilities included in Netica program for function <To Show aircraft position based on GPS signal>
4.2.1.3 Probability calculation of function <To Check aircraft position executing RNP procedure>
The function <To Check aircraft position executing RNP procedure> is a human function, performed by the ATC, and received, based on the variability analysis, an 85% (eighty-five percent) chance of being accurate, 12% (twelve percent) of being acceptable and 3% (three percent) of being inaccurate. Figure 8 shows the probabilities for this function.

Figure 8. Probabilities included in Netica program for function <To Check aircraft position executing RNP procedure>
4.2.1.4 Probability calculation of function <To Keep aircraft on programmed route>
The function <To Keep aircraft on programmed route> is the most important function of the model, as mentioned above, and it is influenced by both the function <To Check aircraft position executing RNP procedure> and the function <To Show aircraft position based on GPS signal>. Therefore, this function required a more complex identification of probabilities based on the variability analysis, as shown in Figure 9.

Figure 9. Probabilities included in Netica program for function <To Keep aircraft on programmed route>
4.2.2 Bayesian network without interference in referenced probabilities
In this section, the Bayesian network was calculated without interference in the reference probabilities defined in Section 4.2.1. As shown in Figure 10, based on the probabilities calculated using the variability analysis, the system proved to be reliable, with a low probability of inaccuracy in the functions analysed by the Bayesian network.
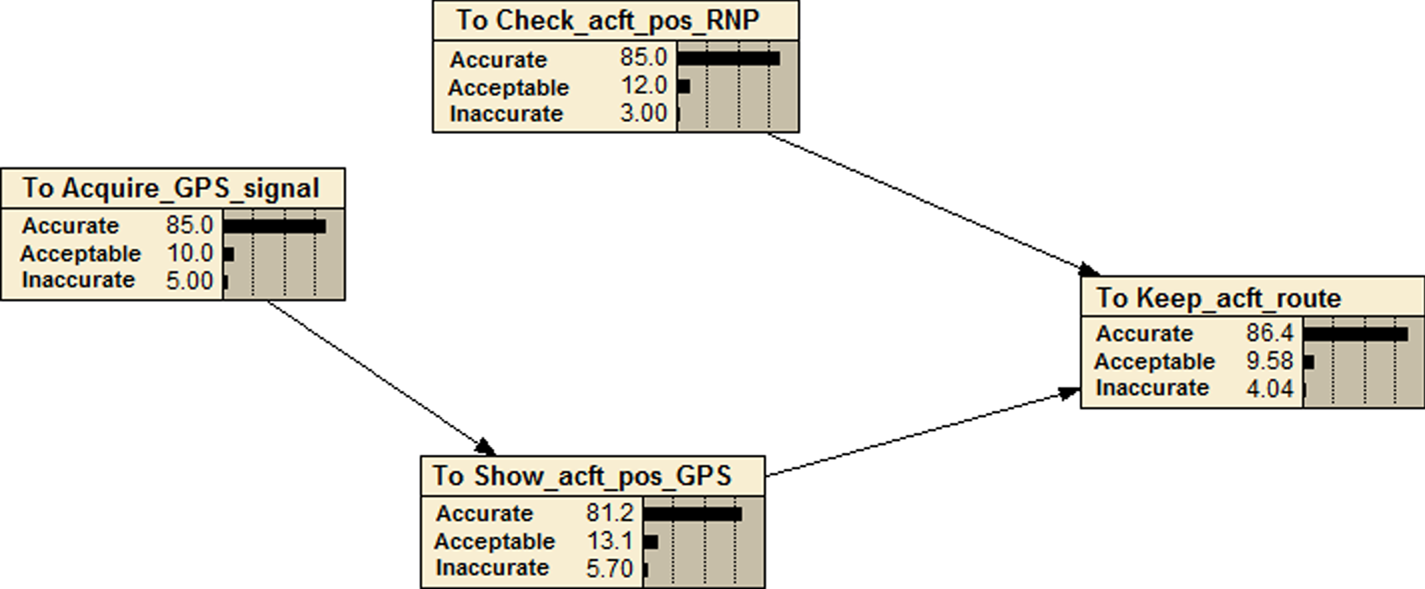
Figure 10. Bayesian network without interference on referenced probabilities
4.2.3 Bayesian network with interference in referenced probabilities
To assess the impact of the ATC performance and the signal provided by the GPS in the function <To Keep aircraft on programmed route>, 100% accuracies were stipulated in the functions <To Check aircraft position executing RNP procedure> and <To Acquire GPS Signal>, separately (Figures 11 and 12) and, finally, together (Figure 13).

Figure 11. Bayesian network with 100% accuracy probabilities in function <To Check aircraft position executing RNP procedure>
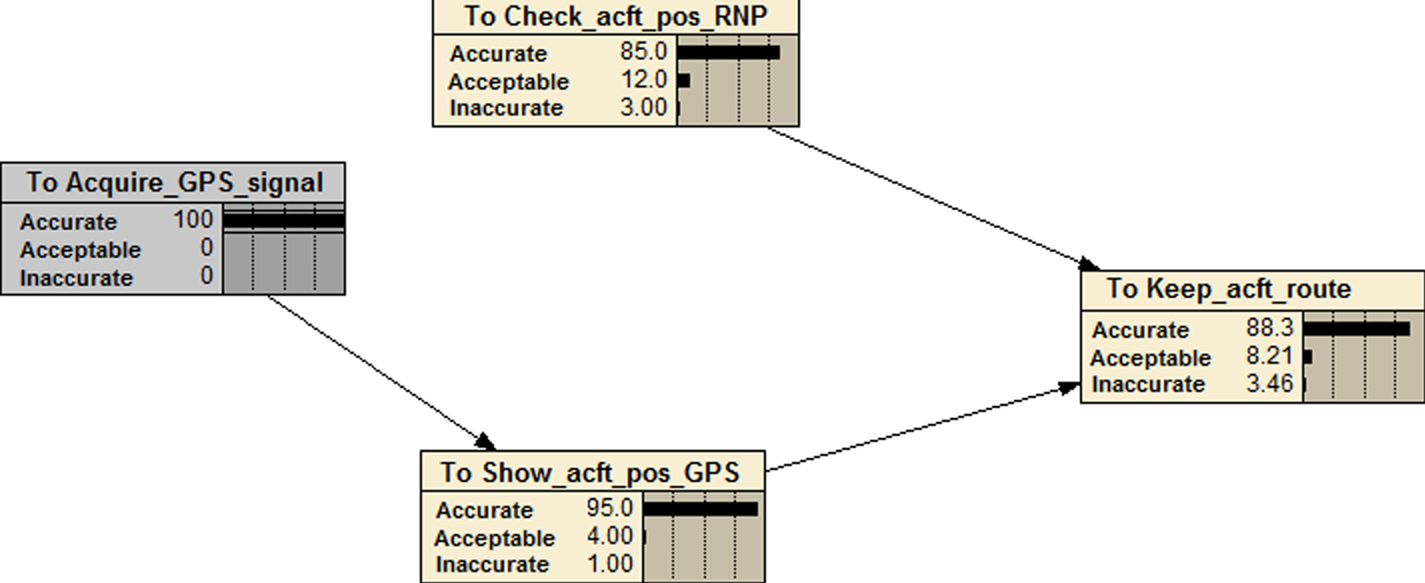
Figure 12. Bayesian network with 100% accuracy probabilities in function <To Acquire GPS signal>

Figure 13. Bayesian network with 100% accuracy probabilities in functions <To Check aircraft position executing RNP procedure> and <To Acquire GPS signal>
4.2.4 Bayesian network results
The observed variations calculated in Sections 4.2.2 and 4.2.3 are presented together in Table 6.
Table 6. Bayesian network variabilities impacting the function <To Keep aircraft on programmed route>

From the results obtained, it was possible to observe that when adopting 100% accuracy in the function <To Acquire GPS signal>, the impact on the accuracy of the function <To Keep aircraft on programmed route> is greater than when adopting 100% in the function <To Check aircraft position executing RNP procedure>, being superior only when 100% accuracy is adopted in the functions <To Acquire GPS signal> and <To Check aircraft position executing RNP procedure>. The same behaviour is observed in the inaccuracy factor, which is smaller when operating with 100% accuracy in the <To Acquire GPS signal> function, and lower only when adopting 100% accuracy in the <To Acquire GPS signal> and <To Check aircraft position executing RNP procedure>. Thus, it can be inferred that when considering overall good outputs for an aircraft flight path on the RNP approach procedure (combination of accurate and acceptable), the GPS signal has more influence, albeit small, in the function <To Keep aircraft on programmed route> than the variability in human performance of the ATC.
The results also show that when considering 100% accuracy in the functions <To Acquire GPS signal> and <To Check aircraft position executing RNP procedure>, the output of the function <To Keep aircraft on programmed route> still yields 3$\cdot$ 15% probability for inaccuracy. This means that the human variability of the Pilot performing the procedure may still be a source of inaccuracy in the aircraft flight path. This means that when performing the procedure, the Pilot must stay focused on the navigation procedures and be aware of the information provided by the GPS and the monitoring instructions provided by Air Traffic Control.
It can observed from the values obtained that, in general, the results of the analysed functions are quite satisfactory, with the sum of the items ‘accurate’ and ‘acceptable’ above 95$\cdot$ 98%. This result confirms the need for accuracy that involves the entire aeronautical system.
It was possible, through the use of the BBN modelling, to make a brief analysis of the upstream–downstream coupling of the function <To Show aircraft position based on GPS signal> and verify how much the upstream function <To Acquire GPS signal> resonates through the system, impacting the function <To Keep aircraft on programmed route>. A more accurate GPS signal means more accurate information will be provided to the crew about the aircraft's position, which in turn will lead to more accuracy for the aircraft performing the RNP procedure.
4.2.5 Bayesian network backpropagation analysis
One interesting evaluation that can be performed with the model is to do a backpropagation on the BBN, in which we assume that the output of the last function in the network (which is the one we are interested in evaluating since it represents the aircraft being maintained on the route) is 100% accurate, 100% acceptable or 100% inaccurate. This can be an interesting approach to investigate an accident in which the aircraft was performing an RNP approach procedure to show who (or what) had the most significant contribution (in a ceteris paribus condition).
This section provides this analysis. More than the results presented here, the purpose of this section is to demonstrate the viability of using the combination of FRAM and BBN for accident investigations.
Figure 14 provides the BBN analysis assuming the output of function <To Keep aircraft on programmed route> as 100% accurate. It can be seen that an 100% accurate output on this function would represent accurate outputs of 86$\cdot$ 2% for <To Check aircraft position executing RNP procedure>, 83$\cdot$
 6% for <To Show aircraft position based on GPS signal> and 86$\cdot$
 9% for <To Acquire GPS signal>. The compilation of the results for backpropagation of output 100% accurate in function <To Keep aircraft on programmed route> is shown in Table 7.

Figure 14. Bayesian network backpropagation with output 100% accurate in function <To Keep aircraft on programmed route>
Table 7. Backpropagation of BBN with output of <To Keep aircraft on programmed route> as 100% accurate

The results show that for an output 100% accurate of the function <To Keep aircraft on programmed route>, the combination of accurate and acceptable outputs from the function <To Check aircraft position executing RNP procedure> is greater than from the function <To Acquire GPS signal> (97$\cdot$ 58% compared to 96$\cdot$
 91%). This means that the monitoring of the ATC exerts greater influence than the GPS signal, when assuming an aircraft flight path 100% accurate in the RNP approach procedure.
Figure 15 provides the BBN analysis assuming the output of function <To Keep aircraft on programmed route> as 100% acceptable. It can be seen that a 100% acceptable output on this function would represent accurate outputs of 78$\cdot$ 0% for <To Check aircraft position executing RNP procedure>, 65$\cdot$
 7% for <To Show aircraft position based on GPS signal> and 72$\cdot$
 9% for <To Acquire GPS signal>. The compilation of the results for backpropagation of output 100% acceptable in function <To Keep aircraft on programmed route> is shown in Table 8.
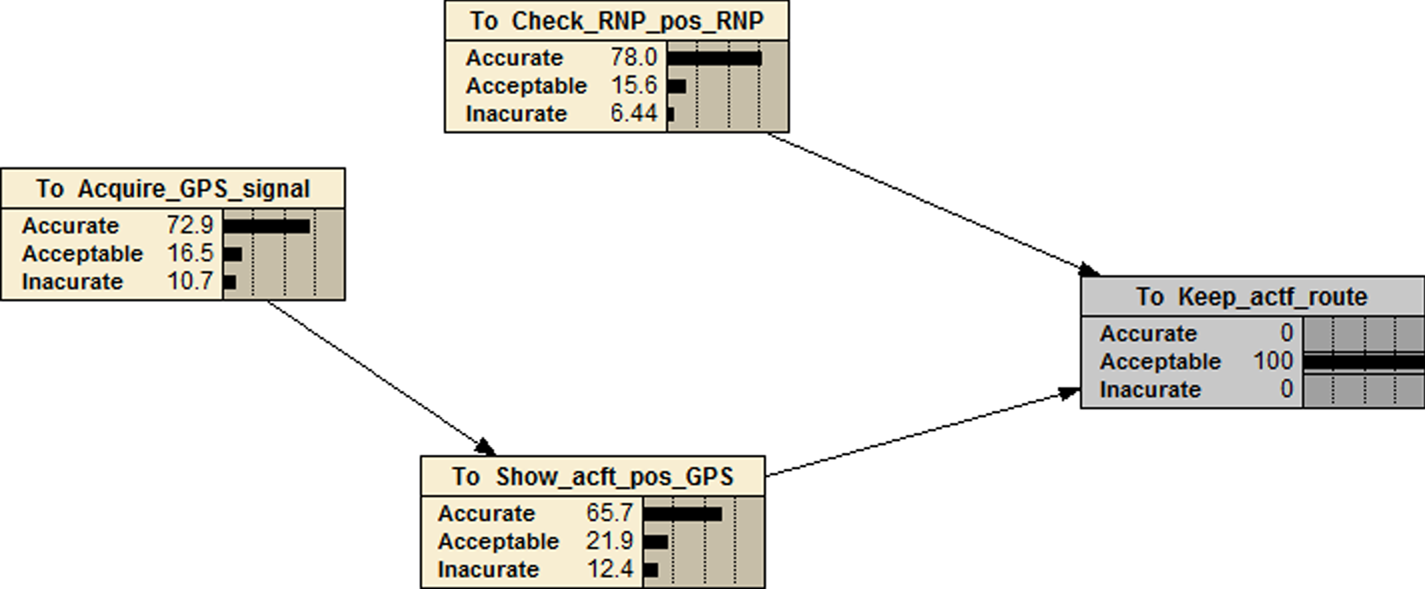
Figure 15. Bayesian network backpropagation with output 100% acceptable in function <To Keep aircraft on programmed route>
Table 8. Backpropagation of BBN with output of <To Keep aircraft on programmed route> as 100% acceptable

Figure 16 provides the BBN analysis assuming the output of function <To Keep aircraft on programmed route> as 100% acceptable. It can be seen that a 100% inaccurate output on this function would represent accurate outputs of 77$\cdot$ 0% for <To Check aircraft position executing RNP procedure>, 66$\cdot$
 3% for <To Show aircraft position based on GPS signal> and 72$\cdot$
 8% for <To Acquire GPS signal>. The compilation of the results for backpropagation of output 100% inaccurate in function <To Keep aircraft on programmed route> is shown in Table 9.

Figure 16. Bayesian network backpropagation with output 100% inaccurate in function <To Keep aircraft on programmed route>
Table 9. Backpropagation of BBN with output of <To Keep aircraft on programmed route> as 100% inaccurate

The results show that for an output 100% inaccurate of the function <To Keep aircraft on programmed route>, the inaccurate output from the function <To Check aircraft position executing RNP procedure> is lower than from the function <To Acquire GPS signal> (97$\cdot$ 31% compared to 14$\cdot$
 90%). This means that the GPS signal exerts greater influence than monitoring of the ATC, when assuming an aircraft flight path 100% inaccurate in the RNP approach procedure.
5 Conclusions
This paper presents a safety analysis for the RNP approach procedure using a combination of FRAM method and BBN analysis. The FRAM analysis performed in the first part of the paper gives the sources for variability for each function and also the topology for the network (or DAG) with cause–effect relations among the functions, which may be difficult to determine when performing a BBN analysis. The BBN analysis, however, is used to evaluate the variability and uncertainties derived from the FRAM analysis. This is the main reason why the two methods were combined for this safety analysis: they both complement each other on their limitations. One of the objectives of this work was to evaluate if the combination of FRAM and BBN is suited for the safety analysis of RNP approach procedures and if it produces good safety recommendations.
The FRAM modelling performed allowed a detailed understanding of the functioning of an RNP approximation procedure. It also allowed for the description of how performance variability may appear during an RNP approach procedure and how this resonates through the system. Once the main functions of the system were identified, it was possible, with the support of experts in the area, to describe and analyse its couplings and variability.
As a complement to the method, Bayesian belief networks were used as a compact representation of a probability conjunction table applied in 04 (four) functions, among which, the function <To Keep the aircraft on the programmed route> is considered the most important for the execution of the RNP procedure.
The main conclusions and contributions of the present work are as follows.
• It was observed that the GPS signal is an important factor for the success of the referred procedure. Therefore, it is suggested that more in-depth studies be carried out on satellite navigation systems, seeking technologies that can reduce the occurrence of signal loss.
• When considering overall good outputs for aircraft flight path on the RNP approach procedure (combination of accurate and acceptable outputs), the GPS signal has more influence, albeit small, in the function <To Keep aircraft on programmed route> than the variability in human performance of the ATC.
• When 100% accuracy is adopted in the functions <To Acquire GPS signal> and <To Check aircraft position executing RNP procedure>, the output of the function <To Keep aircraft on programmed route> still yields 3$\cdot$
 15% probability for inaccuracy. This means that the human variability of the Pilot performing the procedure may still be a source of inaccuracy in the aircraft flight path. This means that when performing the procedure, the Pilot must stay focused on the navigation procedures and be aware of the information provided by the GPS and the monitoring instructions provided by Air Traffic Control.
• The monitoring of the ATC exerts greater influence than the GPS signal, when assuming an aircraft flight path 100% accurate in the RNP approach procedure.
• The GPS signal exerts greater influence than monitoring of the ATC, when assuming an aircraft flight path 100% inaccurate in the RNP approach procedure.
• Regarding the importance of the actions of Air Traffic Controllers for the described system, it is suggested that studies are needed aimed at control actions to be developed and standard procedures to be followed to minimise changes that could affect the performance of RNP approaches.
• Overall, combining FRAM and BBN offers a more holistic approach to safety analysis of RNP approach procedures, allowing for the evaluation of different aspects affecting the complex system. This combination can also lead to more informed decision-making, providing qualitative and quantitative analyses allowing for more complete safety recommendations, and consequently improving the safety of air navigation in those procedures.

As a restriction, the application of the BBN has been performed on 04 (four) functions of the FRAM model. Despite the results that the method offers, a more in-depth study of the variability probabilities is required to obtain calculations more consistent with reality, requiring the participation of different aviation specialists in different fields of expertise.
The combination of the FRAM method and BBN analysis can be found as a powerful tool for the safety analysis for aviation. Further development of the model presented in this paper can be performed to evaluate the influence of other stakeholders. Also, the combination of FRAM and BBN can be used for aviation accident investigations, to identify which function (and player) had the biggest contribution in the event.
Conflict of interest
The authors declare that they have no conflict of interest.


