


I. INTRODUCTION
Physical properties of solution treatable alloys strongly depend on their thermal treatment because solubility, distribution of solute atoms, and microstructure in these alloys can vary significantly. An optimum strength, hardness, and toughness can be tailored by solution strengthening, precipitation hardening, and microstructural ripening with proper thermal treatments for specific applications.Reference Shivkumar, Ricci, Keller and Apelian1–Reference Zhang, Zheng and John3 Some of these alloys, such as Ti6Al4V, Inconel 718, and AlSi10Mg, are popular in laser- or electron beam-Reference Murr4 based additive manufacturing (AM). When these powders are subjected to fast melting and rapid solidification in the AM process, a quenched, nonequilibrium microstructure is developed. This paper investigates the change of thermal properties as a function of temperature in thermal treatments for an AM fabricated AlSi10Mg part as its microstructure progressively evolves from its nonequilibrium state.
The AlSi10Mg alloy offers a low melting point,Reference Murray and McAlister5 good weldability, and improved mechanical properties after proper thermal treatment.Reference Shivkumar, Ricci, Keller and Apelian1–Reference Zhang, Zheng and John3 This specific composition is located at the hypoeutectic region of the Al–Si phase diagram close to its eutectic point; therefore, it has a narrow solidification range between its liquidus and eutectic temperaturesReference Vora, Mumtaz, Todd and Hopkinson6—permitting a tighter dimensional control for building complex shapes and overhang structures. These features are highly desirable for powder bed, laser- or electron beam-based AM processes. The addition of Si further improves corrosion and fatigue resistance after heat treatment.Reference Brandl, Heckenberger, Holzinger and Cuchbinder7 Mg is added to enhance its mechanical strengthReference Caceres, Davidson, Griffiths and Wang8 and impact performance by the formation of finely dispersed β″ and β′ Mg2Si precipitatesReference Jacobs9–Reference Matsuda, Naoi, Fujii, Uetani, Sato, Kamio and Ikeno12 through solution and aging processes. Additional benefits such as high strength to weight ratio, sound strength and hardness, and good thermal conductivity make AlSi10Mg alloy particularly attractive for automobile, aerospace, heat exchanger, and structural applications.
When AlSi10Mg powder is subject to fast melting and rapid solidification in an AM process, it produces an ultrafine, textured, divorced eutectic cellular structure.Reference Holesinger, Carpenter, Lienert, Paterson, Papin, Swenson and Cordes13,Reference Yang, Rodriguez, Deibler, Jared, Griego, Kilgo, Allen and Stefan14 The fast quenching increases the solubility of Si in the primary Al phaseReference Yang, Rodriguez, Deibler, Jared, Griego, Kilgo, Allen and Stefan14–Reference Prashanth, Scudino, Klauss, Surreddi, Lober, Wang, Chaubey, Kuhn and Eckert16 and enhances the efficacy of solution hardeningReference Yang, Rodriguez, Deibler, Jared, Griego, Kilgo, Allen and Stefan14 in this alloy. This combination produces superior hardnessReference Jacobs9,Reference Martens, Dedry, Deuter, Rigo, Lecomtebeckers and Bourell17–Reference Thijs, Kempen, Kruth and Van Humbeeck21 as compared to conventional solution treated, quenched, and thermally aged high-pressure die casting parts.Reference Pedersen and Arnberg2,Reference Zhang, Zheng and John3 The unique, nonequilibrium microstructure imparted by the AM process evolves significantlyReference Caceres, Davidson, Griffiths and Wang8,Reference Yang, Rodriguez, Deibler, Jared, Griego, Kilgo, Allen and Stefan14,Reference Takata, Kodaira, Sekizawa, Suzuki and Kobashi22 during post-AM heat treatment and the material progressively moves toward its equilibrium state. A sequential change develops, including Si exolution, precipitation formation, collapsing of cellular structure, and microstructure ripening.Reference Yang, Rodriguez, Deibler, Jared, Griego, Kilgo, Allen and Stefan14 The evolution changes the size, morphology, length scale, and distribution of nanosized precipitates and cellular structureReference Prashanth, Scudino, Klauss, Surreddi, Lober, Wang, Chaubey, Kuhn and Eckert16,Reference Yan, Hao, Hussein, Young, Huang and Zhu18,Reference Fiocchi, Tuissi, Bassani and Biffi23,Reference Li, Li, Liu, Zhang, Zhou, Wei, Yan and Shi24 and has a profound effect on mechanical properties such as microhardness. These changes, typically in the nano- or submicron scale, are comparable to the averaged electron and phonon mean-free paths, therefore, bearing crucial implications to the heat transfer processes and the electrical conductivity and are important for practical engineering applications.
Aluminum has an excellent thermal conductivity which ranks 2nd highest among common metals. Lightly alloyed aluminum alloys such as Al 6061 and AlSi10Mg inherit the high conductivity, making them useful for lightweight heat exchanger and other thermal management applications. Because of thermal agitation, heat conduction in metals is intrinsically impeded by the scattering of electrons and phonons in the lattice as characterized by the reduction of their mean-free paths through umklapp processes.Reference Kittel25 Extrinsic features such as foreign atoms and dislocations that can cause strong anharmonic vibrations in the lattice will act as scattering centers and are effective in reducing thermal conductivity. Boundaries and interfaces between dissimilar phases or different crystal orientations can also contribute to the loss in thermal transport. In this as-built AM part, the presence of supersaturated solute atoms, precipitates, as well as the cellular walls, grain boundaries, and fused zone boundaries can all add to the scattering and collision processes for electrons and phonons. The efficacy of these scattering events strongly depends on their length scale, distribution, and continuity in the microstructure. This work continues our previous microstructural evolution studyReference Yang, Rodriguez, Deibler, Jared, Griego, Kilgo, Allen and Stefan14 to correlate changes in microstructure with thermal properties of an AM fabricated AlSi10Mg part. The results are important for exploiting and managing thermal properties of the solution treatable alloys uniquely produced by the AM process.
II. EXPERIMENTAL PROCEDURE
A pre-alloyed AlSi10Mg powder (EOS GmbH, Krailling, Germany) consisting of 9.0–11.0 wt% of Si, 0.2–0.45 wt% of Mg, <0.55 wt% of Fe, <0.45 wt% of Mn, <0.15 wt% Ti, and trace amount of impurities such as Ni, Zn, Sn, and Cu (all less than 0.1 wt%) was used for AM. Parts were fabricated by selective laser melting (SLM) on an EOS M280 machine. Samples for scanning electron microscopy (SEM) and thermal characterization were cut by wire electrical discharge machining (EDM) from a one-inch-cube fabricated by GPI prototype and Manufacturing Service (Lake Bluff, Illinois). The specific slices for the in-plane and the out-of-plane samples refer to the specimens cut from the XY and XZ plane, respectively, with build direction Z.
Heat capacity (C p) was measured by differential scanning calorimetric analysis (DSC; TA Instruments, Q2000, New Castle, DE) in the temperature range of −50 to 500 °C at a heating rate of 20 °C/min under 50 mL/min flowing nitrogen. The temperature of the instrument was calibrated against the melting temperatures of indium and tin standards, while C p was calibrated to a sapphire standard. Calibration results indicate that the average error in the measurements was about 0.4%.
Thermal mechanical analysis (TMA; TA Instruments, Q4000, New Castle, DE) was used to determine the coefficient of thermal expansion in the temperature range from −50 to 500 °C with heating rate of 1 °C/min under flowing nitrogen. The TMA was calibrated with an aluminum cylinder standard (TA Instruments) and the experimental error was below one percent over the entire temperature range.
The bulk density (ρ) was measured by Archimedes method (ASTM C-830). The average density of the one-inch-cube at room temperature was 2.671 ± 0.001 g/cm3. Because a slight anisotropic response was observed in TMA measurements, the variation of density with temperature was corrected with TMA data from both X (or Y) and Z directions.
Thermal diffusivity (α) was measured by using a Netzsch LFA 467 Hyperflash (NETZSCH-Geratebau GmbH, Selb, Germany) in the temperature range of −50 °C to 500 °C under flowing nitrogen. Data were collected after holding for 4 min at the designated temperature. The instrument was calibrated against a NIST electrolytic iron standard, yielding an average error of 7%. Thermal conductivity, λ(T), at different temperatures can then be calculated by
 $$\lambda \left( T \right) = \rho \left( T \right) \cdot {C_{\rm{p}}}\left( T \right) \cdot \alpha \left( T \right)\quad .$$
Based on the DSC results (Sec. III.A), a set of temperatures were selected for the annealing process to assess the change in microstructure and thermal properties as a function of temperature. The samples for SEM study were annealed in the DSC under flowing nitrogen to prevent oxidation. The heating and cooling rates were set at 20 °C/min, and samples were held at the designated temperatures (slightly lower than the thermal anomalies in Fig. 1) for 15 min to capture microstructural evolution without incurring extended aging. A sample annealed at 450 °C was soaked for 30 min to ripen its microstructure for comparison purposes. The microstructural evolution of the divorced eutectic cellular structure in the as-built AM part was studied by a high-resolution SEM (Supra 55VP Gemini FE-SEM, Zeiss International, Oberkochen, Germany).
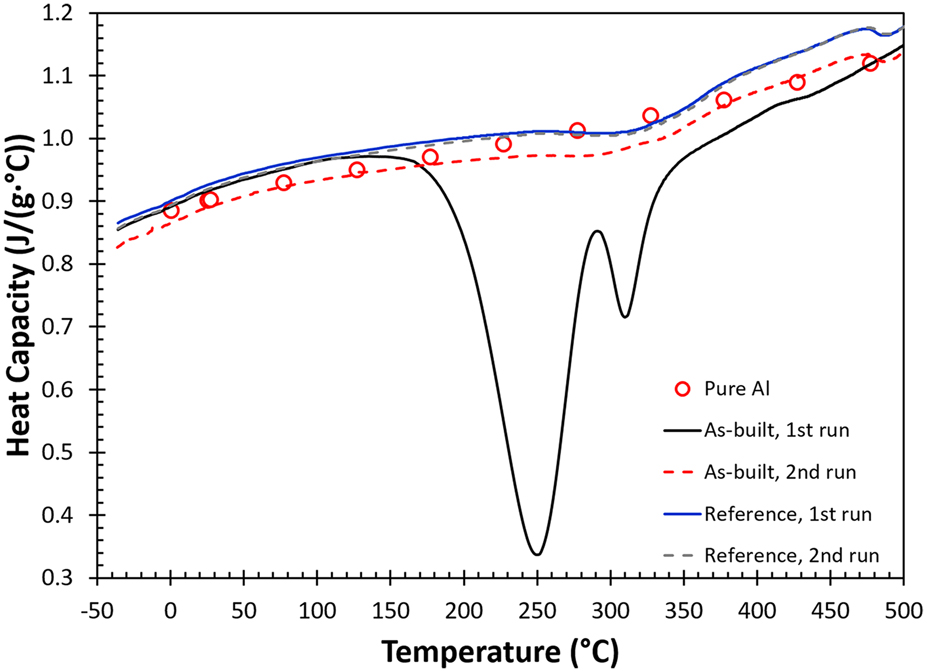
FIG. 1. DSC measurements for AM fabricated AlSi10Mg samples, including as-built, reference and pure aluminum (red open circles) at a scan rate of 20 °C/min under flowing nitrogen.
Repeated DSC, TMA, and thermal diffusivity measurements under the same conditions were performed to study the change in physical properties after first thermal cycle. For comparison purposes, a second set of samples with the same starting powder and the same processing parameters, but having been thermally annealed at 300 °C for 2 h after fabrication following the vendor’s recommendation, are used as reference (results are compared in Figs. 1, 4, and 5).
III. RESULTS
A. Heat capacity
The heat capacity curve determined by the DSC shows a double exothermic peak on the first heating for the as-built AM part illustrated by the black solid line on Fig. 1. These two exothermic events peaked at 250 and 310 °C completely disappear during the second heating cycle (red dashed line), and the heat capacity increases moderately as temperature rises. A set of heat capacity values for pure aluminum (red circles) at different temperatures are added to Fig. 1 as a reference.Reference Chase26 The results indicate that after heating to 450 °C for 15 min, the change in heat capacity with respect to temperature for the as-built sample in the second run is close to that of pure aluminum and the heat capacity value approaches to the classical value of 3R [R: gas constant or C p ∼ 0.924 J/J/(g °C)]. The results for the reference sample during first and second heating are given as the solid blue and dashed gray lines, respectively. These two curves are coincident except that the two exothermic events observed in the as-built sample during the first run are absent. This immediately indicates that these exothermic events are unique and are the result of the AM process. These curves are slightly above the curve obtained in the second heating measurement for the as-built specimen and follow the exact same trend and characteristics in terms of change in curvature and small kinks observed at different temperatures (310 and 470 °C). Reasons for the small disparity observed among these measurements are not clear, but demonstrate that an additional annealing treatment during the first heating cycle will avert the two major exothermic events observed in the as-built part.
B. Thermal expansion and density
The thermomechanical responses plotted with the changes in physical dimension (ΔL/L o, L o: original sample length) versus temperature (T) during the first (dashed lines) and the third (solid lines) heating runs are given in Fig. 2, and blue and red curves represent data collected in the in-plane (X) and the built (Z) directions, respectively. The results indicate that the thermomechanical strains during the first heating cycle in both directions are complicated and nonlinear, and the responses in the X and Z axes are slightly different. The slope of the thermomechanical response, i.e., the coefficient of thermal expansion or CTE (d(ΔL/L o)/dT), varies for different temperature ranges. In the first run, the thermal expansion is linear in both directions up to 150 °C. Above this temperature, CTEs in these directions increase rapidly, then between 220 and 250 °C the CTEs gradually decrease, and finally above 350 °C, the thermal expansion becomes linear with temperature again. During the second run (not shown), these changes disappear and the responses in both directions are almost identical to the third run, except that there is a slightly upward bend in the X direction near 470 °C coinciding with the kink observed in DSC measurements. In the third run, the thermal expansion behavior in both directions is well behaved, where the CTEs hold constant from room temperature up to 300 °C then the CTE in the Z direction increases again at higher temperatures. Therefore, the behavior observed in the first heating run must be imparted by the AM process. The small changes in physical dimensions after heating should be taken into consideration in AM fabrication for tightly tolerance applications. After the first thermal cycle, the averaged CTE value between room temperature and 350 °C is 23.5 ppm/°C, which is closer to the reported value of a pure aluminum (23.6 ppm/°C)Reference Hidnert and Krider27 at room temperature. The thermomechanical response for the reference sample is isotropic and almost identical to the third run for the as-built sample in the Z direction.
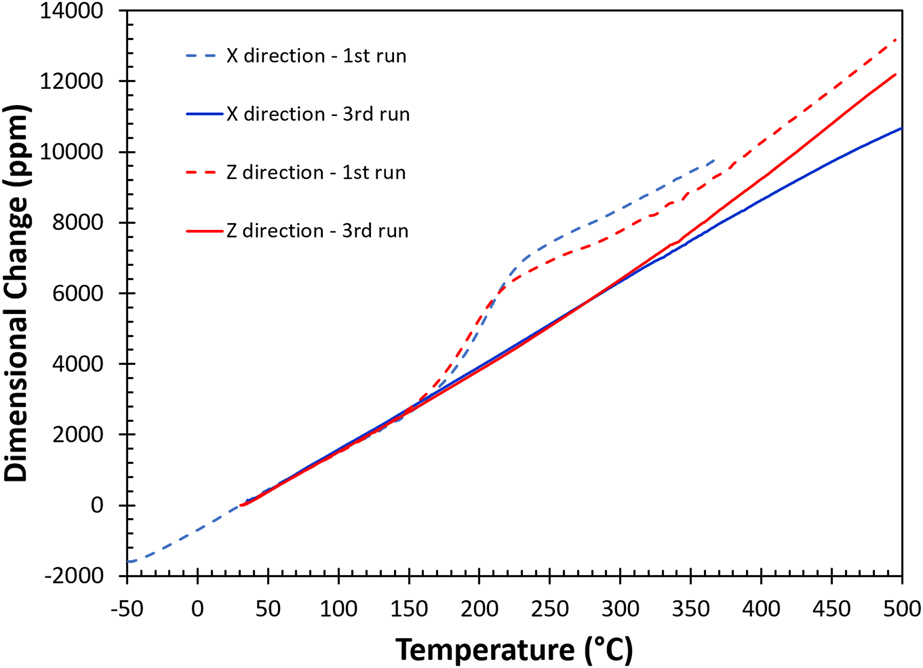
FIG. 2. The thermomechanical responses of AM fabricated AlSi10Mg sample. Blue line and red line are the thermally induced dimensional changes in the X (in-plane) and Z (build) directions, respectively.
The density of these specimens was measured according to ASTM C-380, using the Archimedes’ method. Each specimen was measured three times, and the averaged densities of as-built and reference specimens at room temperature were 2.671 ± 0.001 g/cm3 and 2.646 ± 0.002 g/cm3. The variation of density with temperature, ρ (T), is calculated based on the thermal expansion measurement and is plotted in Fig. 3. Note that there is a nonlinear transition in bulk density for the as-built sample between 150 and 275 °C during the first thermal treatment (solid diamonds), and finally the bulk density shows a monotonic decrease in the third heating cycle (open squares) due to volumetric thermal expansion.
FIG. 3. The change of density as a function of temperature calculated from thermomechanical responses in Fig. 2.
C. Thermal diffusivity
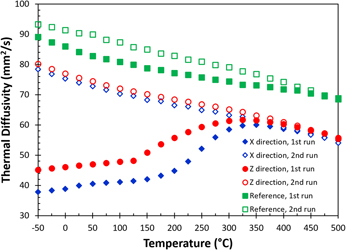
All the thermal diffusivity [α(T)] data at different temperatures are given in Fig. 4, including data measured in the X (blue diamonds) and the build (Z, red circles) directions for the as-built sample, as well as for the reference sample (green squares). The solid and the open symbols are data collected in the first and the second heating measurements, respectively. The results show that there is a significant change in thermal diffusivity for the as-built part during the first heating cycle. The thermal diffusivity nearly doubles at room temperature after the first heating cycle. During the first measurement, the thermal diffusivity increases almost linearly up to 150 °C. Above 150 °C, the thermal diffusivity increases rapidly and is similar to the data for the second run at 350 °C. The thermal diffusivities of the first and the second runs eventually merge at temperatures above 425 °C. A similar trend is also observed in the reference sample, but the difference between the first and the second runs is relatively small. All the thermal diffusivity data collected in the second heating runs show a monotonic decrease with increasing temperature from −50 to 500 °C. Additionally, the thermal diffusivity of the reference sample is always greater than that of the as-built samples. The monotonic decrease in thermal diffusivity with respect to the increase in temperature is expected as both electron and phonon scattering increased with thermal agitation.
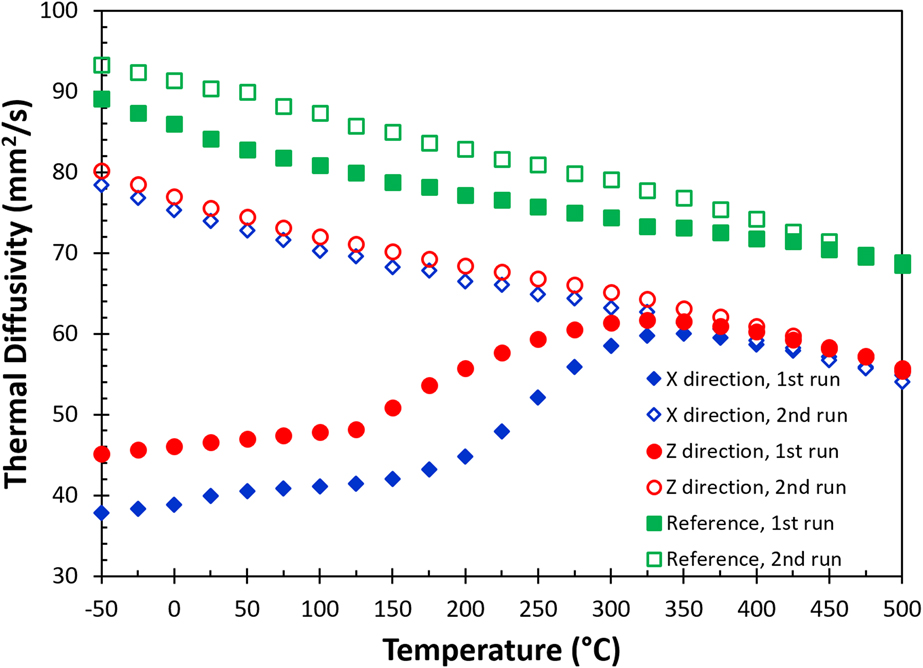
FIG. 4. The change of thermal diffusivity as a function of temperature in the in-plane (X) and the build (Z) directions for AM fabricated AlSi10Mg parts. Data include measurement from first and second runs, as well as a reference sample (see text).
D. Thermal conductivity
The calculated thermal conductivity [Eq. (1)] as a function of temperature for the as-built (blue diamonds for the X direction, and red circles for the Z direction) and the reference sample (green squares) is shown in Fig. 5. Additionally, thermal conductivity data of pure aluminumReference Ho, Powell and Liley28 at different temperatures (open black circles) are added as references. The data indicate that pure aluminum has a higher thermal conductivity compared to the reference and the as-built samples. This simply illustrates the effect of alloying on heat transfer where solute atoms such as Si and Mg effectively act as scattering centers to reduce electron and phonon mean free paths, but it is not sufficient to explain for data collected in the first measurement for the as-built part. The results also show that the thermal conductivity of pure aluminum, the reference sample, and the second run of the as-built sample is relatively insensitive with respect to the change in temperature between −50 and 500 °C. The observation suggests that data collected in this temperature range are close or above the Debye temperature (θD) of the alloy where the mean free path of phonons is approaching the lattice parameter, therefore, limiting the heat transfer. The fact that the as-built sample shows a much lower thermal conductivity below 150 °C indicates that additional scattering centers or processes in the AM built part must contribute to the impedance of the heat transfer process.
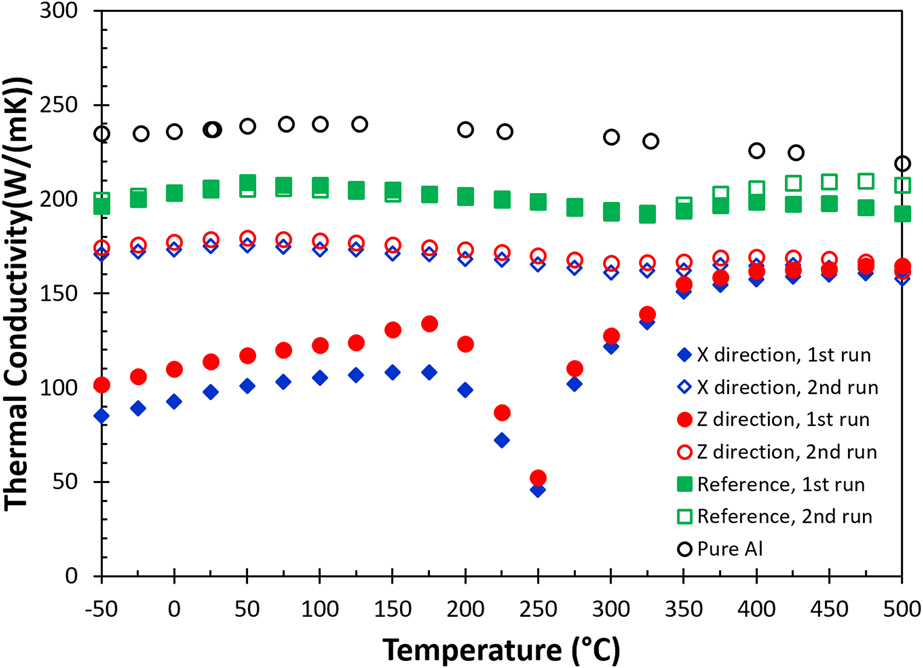
FIG. 5. The change of thermal conductivity as a function of temperature for the AM fabricated AlSi10Mg alloy.
In much the same way as the thermal diffusivity differs for the X and Z directions for the as-built part, there is a slight difference in thermal conductivity between the in-plane (X) and the build (Z) directions during the first heating cycle, where the thermal conductivity is lowest in the in-plane direction. During the first heating measurement, the thermal conductivity curve of the as-built sample increases almost linearly with temperature until 150 °C, then dips into the lowest value at 250 °C and gradually recovers around 350 °C, and finally levels off above 425 °C. The drastic change in the thermal conductivity curve in the first run between 175 and 350 °C for the as-built sample simply reflects the heat capacity contribution from the exothermic events, according to Eq. (1). Like the thermal diffusivity for the as-built sample, the thermal conductivity at −50 °C has almost doubled after the first heating cycle. This highlights the drastic impact on thermal properties imparted by the AM process.
E. Microstructure evolution
The rapid solidification of the melting pool in a laser-based AM process produces a unique microstructure for the AlSi10Mg alloy which can be described at three different levels, including (i) freeze zones, (ii) grains, and (iii) cellular structure. The freeze zones are formed during a transient solidification period where latent heat is removed from the top melting pool causing partial re-melting and coarsening of the bottom layer during the consecutive additive process. The average freeze zone in the as-built sample varies from 100 to 200 µm separated by a roughly 20 µm thick freeze zone boundary.Reference Yang, Rodriguez, Deibler, Jared, Griego, Kilgo, Allen and Stefan14 The size and the thickness of the freeze zone and boundaries can be varied by processing parameters used in the AM process. In general, the size of the freeze zone and its boundaries do not change significantly and these boundaries progressively disappear when the temperature is increased above 450 °C.Reference Yang, Rodriguez, Deibler, Jared, Griego, Kilgo, Allen and Stefan14 Inside these freeze zones are crystallographically textured, elongated grains preferentially aligned in the solidification direction. The average length and width of these elongated grains are 42 µm and 13 µm, respectively. There is no appreciable change in the average length and width of the grains below 307 °C, but they increase moderately to 67 and 16 µm at temperature above 307 °C.Reference Yang, Rodriguez, Deibler, Jared, Griego, Kilgo, Allen and Stefan14 Details of the change in microstructure for the freeze zone and grains at different temperatures are described in a previous publication.Reference Yang, Rodriguez, Deibler, Jared, Griego, Kilgo, Allen and Stefan14 Embedded in these grains is an elongated, three-dimensional networked cellular structure imparted by the rapid solidification process. Since below 300 °C, the changes in thermal diffusivity and thermal conductivity are more drastic while the microstructural variations in freeze zone and grain structure are trivial, the microstructural evolution in this study will be focused on the change in the finest cellular structure as a function of temperature.
High-resolution SEM images in Fig. 6 show the microstructural evolution of the cellular structure under different thermal annealing conditions. Figures 6(a) and 6(b) give the view of cellular structure in the XZ and XY planes for the as-built part, respectively. These images are taken far from the freeze zone and the grain boundaries, representing the general cellular morphology structure without the interferences of these boundaries. The formation of this divorced cellular structure is due to the rejection of excess Si into the solidification front which decreases the solute concentration and the degree of constitutional undercooling, resulting in a continuous, interconnected Al and Si cellular structure from rapid solidification process from the melt. The average cellular size in the length and width direction are 1650 and 442 nm on the XZ plane and the average wall thickness is about 65 ± 21 nm.Reference Yang, Rodriguez, Deibler, Jared, Griego, Kilgo, Allen and Stefan14 Figure 6(b) shows an almost equiaxed cellular structure in the XY plane, in contrast with an elongated structure in the build direction [Fig. 6(a)]. Therefore, the number of cell walls per unit distance/area is greater in the X direction than in the Z direction. Note that the interior of these cells is almost free of nanosized Si precipitates. When the sample was annealed at 240 °C, the number of equiaxed nanoscale precipitates increased dramatically as illustrated in Fig. 6(c). Most of these precipitates are in the 10–14 nm range and are uniformly distributed in all areas inside the cellular structure. The averaged distance between these nanoprecipitates is about 10–20 nm. The formation of these dispersed nanoprecipitates is attributed to the exolution of Si from supersaturated primary Al—a fertile ground for precipitate formation.Reference Yang, Rodriguez, Deibler, Jared, Griego, Kilgo, Allen and Stefan14 This exolution process (i.e., out diffusion of solute atoms from host lattice) also contributes to the thermomechanical anomaly in the TMA measurement (Sec. III.B). The cellular walls begin to collapse and break into slightly larger, equiaxed particles at 282 °C [Fig. 6(d)], and the density of those nanoprecipitates within the primary Al phase decreases. It is believed that these large triple wall joints, triggered by the formation of β′-Mg2Si, break these regions into small particles (discussed in Sec. IV), instead of forming a large spheroidized island. Surprisingly, these Si particles coarsen and progressively align and evenly separate in the solidification direction when temperature increases from 282 to 307 °C as shown in Fig. 6(e). The alignment of these Si particles is not observed in the in-plane image (not shown). The coarsening and the increase of the distance between these particles is indicative of the initial stage of microstructure ripening. When the temperature reaches 450 °C, coarsening prevails, as large Si particles grow at the expanse of finer precipitates through Oswald ripening. These matured, large precipitates start showing a hexagonal morphology and only a few fine precipitates can be observed [Fig. 6(f)]. The total number of these particles per area decreases and the distance between particles increases enormously, compared to the microstructure observed at lower temperatures.
FIG. 6. SEM images for microstructure evolution of the divorced eutectic cellular structure for an AM fabricated AlSi10Mg parts. SEM micrographs for the as-build sample from XZ plane (a) and XY plane (b), and images of XZ planes which have been thermally annealed at 240 °C (c), 282 °C (d), 307 °C (e), and 405 °C (f).
IV. DISSCUSSION
The first DSC measurement for the as-built part in Fig. 1 reveals two unexpected exothermic events peaked at 250 and 310 °C. These events vanish when the sample was measured during the second heating cycle. The appearance of these exothermic peaks was first reported by Butta and was attributed to the formation of β″ and β′ precipitates in a solution treated and fast quenched commercial 6061 alloy.Reference Butta and Allen29 The kinetics of precipitate formation was later investigated in lower Si containing aluminum alloys.Reference Daoudi, Triki and Redjaimia30,Reference Baoudi, Triki, Redjaimia and Yamina31 Additional exothermic peaks were also reportedReference Butta and Allen29 in conventional solution treated, fast quenched samples with one below (depends on compositions) and one above (∼480 °C) this temperature range. These events correspond to the formation of Guinier–Preston zones (or GPZs) at a lower temperature and a thermal equilibrium β phase at a higher temperature.Reference Butta and Allen29 Small kinks observed on the DSC curves near 480 °C during DSC measurements in both as-built and reference samples may be an indication of the latter event. However, the low temperature event (i.e., GPZ formation) was absent in AM fabricated AlSi10Mg parts in our studyReference Yang, Rodriguez, Deibler, Jared, Griego, Kilgo, Allen and Stefan14 and other studiesReference Holesinger, Carpenter, Lienert, Paterson, Papin, Swenson and Cordes13,Reference Yan, Hao, Hussein, Young, Huang and Zhu18,Reference Takata, Kodaira, Sekizawa, Suzuki and Kobashi22,Reference Fousova, Dvorsky, Michalcova and Vojtech32 Additionally, the nanoscale precipitates observed in the primary α aluminum are not intermetallic compounds but pure Si.Reference Yan, Hao, Hussein, Young, Huang and Zhu18,Reference Fousova, Dvorsky, Michalcova and Vojtech32 The disparity can be attributed to the differences in microstructure and chemical distribution during the quenching/solidification process. In a conventional solution treated alloy, in addition to a dendritic solidification structure, the primary α aluminum forms a homogenous solid solution with maximum levels of Mg and Si as predicted by solubility and alloy composition limitsReference Zhang, Zheng and John3 while the rapid solidified AM part develops a unique cellular microstructure with inhomogeneous compositions and different phases due to chemical partitioning or microsegregation. The oversaturated, homogenously distributed Mg and Si atoms in the quenched solid solution may be able to migrate locally and form these nanoscale GPZs to minimize the overall lattice strain at low temperature.Reference Meyers and Chawla33 In the AM fabricated part, the primary α Al inside of the cellular structure is supersaturated with Si and most of the Mg and trace impurities are preferentially located in the cellular walls and triple junctions.Reference Holesinger, Carpenter, Lienert, Paterson, Papin, Swenson and Cordes13,Reference Yan, Hao, Hussein, Young, Huang and Zhu18,Reference Fousova, Dvorsky, Michalcova and Vojtech32 If the cellular structure remains intact at low temperatures, the deficiency of Mg in the primary α Al will prevent the formation of Mg and Si rich GPZs. Above the Debye temperature of Al (θD ∼ 150 °C, Table I) where Si diffusion becomes active, Si exolution occurs and forms uniformly dispersed nanosized Si precipitates in the α aluminum as illustrated by Fig. 6(c) as well as supporting evidence from the change in thermal expansion, the exolution of Si with in situ X-ray structural refinement,Reference Yang, Rodriguez, Deibler, Jared, Griego, Kilgo, Allen and Stefan14 as well as the energy dispersive X-ray spectroscopy imagingReference Fousova, Dvorsky, Michalcova and Vojtech32 and the selective area diffraction pattern from transmission electron microscopy.Reference Yan, Hao, Hussein, Young, Huang and Zhu18 The precipitation of smaller Si atoms from the Al lattice releases the extra stored elastic strain energy in the lattice and constitutes the first exothermic event peaked at 250 °C. In a similar manner, the formation of needle-shaped Mg5Si6 β″ precipitatesReference Matsuda, Naoi, Fujii, Uetani, Sato, Kamio and Ikeno12 below 240 °C in the primary α Al phase observed in the quenched solid solution is also prohibited in the AM part because Mg atoms are still locked in the cellular structure and have not been released. When the temperature rises above 275 °C, Mg starts reacting with Si and likely forms a Mg2Si β′ phase locally. The reaction takes place at the Mg-rich regions and triggers the collapse of the cellular structure as shown by the SEM image in Fig. 6(d). Therefore, the second exothermic event is most likely associated with the formation of Mg2Si β′ precipitates causing the collapse of cellular walls and spheroidization at triple junctions. Although the observed exothermic events between 150 and 350 °C are similar for the AM produced part and the solution treated and quenched Al–Si based alloys, the underpinning mechanisms for microstructural evolution is different due to rapid solidification induced phase separation and chemical distribution in the microstructure. The coincidence of these events between 150 and 350 °C shown in DSC measurements simply manifest the fact that both intermetallic (β″ or β′) and nano-Si precipitate formations are governed by a diffusion controlled mechanism to relieve the stored elastic strain energy imposed by the foreign solute atoms. This change occurs above the Debye temperature where the thermally activated diffusion process becomes active.
TABLE I. Room temperature material properties for aluminum and Al Si10Mg alloy from the literature* and calculation (Appendix).
The changes observed in thermomechanical measurements, shown in Fig. 2, are correlated with two exothermic events reported in the DSC measurements. This simply reflects both changes are closely related to the lattice vibrations and energy content in a bulk material. After the initial linear response between room temperature and 150 °C, beginning around 145 °C, the thermal mechanical response starts deviating from linear, and peaking at 250 °C. This coincides with the onset of the first exothermic Si exolution reaction (∼150 °C) and is evidenced by the dramatic increase in the number of these nanoscale Si precipitates uniformly distributed within the cellular cells after temperature increased to 250 °C [Fig. 6(c)]. The exolution of Si atoms from the supersaturated α Al lattice increases the lattice parameterReference Yang, Rodriguez, Deibler, Jared, Griego, Kilgo, Allen and Stefan14,Reference Yan, Hao, Hussein, Young, Huang and Zhu18 and shows an increase of the CTE in the temperature range from 150 to 250 °C. By the same token, the release of a relatively small amount of the larger Mg atoms above this temperature causes a slight decrease of the CTE. When these excess solute atoms have been released and form Si or intermetallic precipitates, the thermal expansion behavior stabilizes and becomes linear again. The thermomechanical response mirrors previous X-ray structural refinement studies.Reference Yang, Rodriguez, Deibler, Jared, Griego, Kilgo, Allen and Stefan14,Reference Prashanth, Scudino, Klauss, Surreddi, Lober, Wang, Chaubey, Kuhn and Eckert16 More importantly, the change observed in thermomechanical response is not a result of residual stresses or microstrains from the rapid solidification AM process, but from the supersaturation of Si in the quenched primary α phase in these small specimens.Reference Yang, Rodriguez, Deibler, Jared, Griego, Kilgo, Allen and Stefan14
The formation of supersaturated Si in the Al lattice and the 3-dimensionally interconnected cellular structure can lead to increased anharmonicity in thermally induced lattice vibrations and an increased frequency of collisions and scatterings, resulting in a lower thermal conductivity for the as-built AM part. The effects arise from differences in mass, binding energy, and from the elastic strain field when solute atoms substitute in the host lattice, and cause increased collisions of electrons and phonons at static boundaries such as cellular walls, grain, and freeze zone boundaries. Therefore, the exolution of Si, the formation of precipitates, and the collapse of the cellular structure, as well as microstructure ripening can significantly affect the thermal resistance as the microstructure evolves. The effect of microstructure evolution can, therefore, be treated in terms of the mean free path (l) related to the average wave length before collisions and the frequency of scattering events by these microstructural features. The general heat transfer behavior can then be discussed in terms of total mean free path (l total). Because the inverse mean free paths for different scattering events in the as-built AM part are additive
 $${1 / {{l_{{\rm{total}}}}}} = {1 / {{l_{{\rm{phonon}}}}}} + {1 / {{l_{{\rm{electron}}}}}} + {1 / {{l_{{\rm{impurity}}}}}} + {1 / {{l_{{\rm{celluar}}\;{\rm{wall}}}}}} + {1 / {{l_{{\rm{grain}}\;{\rm{boundary}}}}}} + {1 / {{l_{{\rm{freeze}}\;{\rm{zone}}\;{\rm{boundary}}}}}} + \ldots \quad ,$$
the change of l total will be weighted heavily by processes with smaller mean free paths such as phonon and electron, as well as the effect of solid-solution impurities and smaller microstructural features such as participates and cellular structure, as these mean free paths are typically in the submicron range. Additionally, atomic level defects such as dislocations and low-angle boundariesReference Takata, Kodaira, Sekizawa, Suzuki and Kobashi22 can also cause phonon scattering, but will not be discussed here as their population and distribution were not studied in this work. Larger features such as grains (15–40 μm) and freeze zone (100–200 μm) boundaries, separated by tens to hundreds of microns, can also contribute to the scattering, but their contribution to the l total will be relatively small and might be negligible at low temperatures. Using this conventional approach, it will help to qualitatively explain the effect of microstructure evolution on heat transfer.
To embrace the discussion of microstructural evolution on heat transfer, a first-order calculation for phonon and electron mean free paths is exercised. These are intrinsic scattering mechanisms in metallic materials. By comparing these mean free paths with the length scale of different microstructural features, a correlation between microstructural evolution and change in heat transfer can be established.
From sound velocities and physical relationships (Appendix), the Debye temperature and the average phonon mean-free-path (l phonon = 3α/v) for pure aluminum are calculated and given in Table I. The calculated Debye temperature is consistent with the literature value (i.e., 428 K or 155 °C) and the calculated phonon mean-free-path at room temperature is 80.0 Å. When these values are compared with the as-built AM part based on the acoustic measurements,Reference Jacobs9 a slightly lower Debye temperature (409 K or 136 °C) is calculated and a shorter average phonon mean-free-path (39.8 Å) is obtained. These changes can be attributed to the lower sound velocity or elastic modulus measured by acoustic measurements.Reference Yang, Rodriguez, Deibler, Jared, Griego, Kilgo, Allen and Stefan14 The fundamental reason for the lower calculated modulus is unclear but it has been consistently reported by several studies of the as-built AlSi10Mg part.Reference Kempen, Thijs, Van Humbeeck and Kruth34 At this length scale, the dominating scattering event that can effectively contribute to the l total is the shortest mean free path from supersaturated Si in the lattice (or l impurity). For example, assuming that there is only 1 at.% Si added to the FCC Al (4 atoms/unit cell), the average distance between the phonon scattering centers due to the presence of these solute atoms is only less than three unit cells apart which is about 21 Å. In fact, the total amount of supersaturated Si in the primary α Al can easily exceed 1 at.% as illustrated by the change in microstructure from almost precipitate-free [Figs. 6(a) and 6(b)] to a full development of finely dispersed Si precipitates in the primary aluminum after exolution at 240 °C for 15 min [Fig. 6(c)]. BoseReference Bose and Kumar15 has also demonstrated a significant amount of excess of Si (>10 at.%) which can be preserved in a rapidly solidified thin Al–Si alloy film. Additionally, it has been demonstrated that AM by laser powder bed fusion more effectively produces a supersaturation of Si in the primary α aluminum than copper mold casting and melt spinning processes due to its faster cooling rate.Reference Marola, Manfredi, Fiore, Poletti, Lombardi, Fino and Battezzati35 As the amount of saturated solute atoms increases, the average distance between nearest neighboring scattering centers will quickly decrease. Therefore, alloying can effectively reduce heat transfer in materialsReference Kingery, Bowen and Uhlmann36 by decreasing the phonon mean free path. For the as-built AM part, the formation of supersaturated primary α aluminum is the major cause for the low thermal diffusivity and low thermal conductivity in the solution treatable AlSi10Mg alloy. As temperature increases and Si exolution occurs, the nucleation process of nanoscale precipitates in the aluminum lattice will progressively reduce the amount of scattering centers and increase phonon and electron mean free paths, therefore, enhancing the heat transfer. This is evidenced by the monotonic yet moderate increase (first measurement, solid legends) in thermal diffusivity and the thermal conductivity between −50 and 150 °C and the progressive increase in hardness with time by annealing at temperature below 150 °C.Reference Fousova, Dvorsky, Michalcova and Vojtech32 The increase in heat transfer with increasing temperature is uniquely related to the change in microstructure, as both thermal diffusivity and thermal conductivity are expected to decrease due to the increase of collisions between electrons and phonons as temperature increases in this temperature range. This is illustrated by the second measurement (hollow symbols) when some of these scattering centers are removed by thermal treatment at high temperatures. Features such as cellular walls and the shape of the cellular structure can also contribute to the overall scattering events as the total quantity of these features are copious in the sample. This is clearly demonstrated by the differences in thermal diffusivity and thermal conductivity between the in-plane (XY) and build (Z) directions. The smaller equiaxed cellular structure on the XY plane (average cellular size of ∼442 nm) will produce more scattering events than the elongated cellular structure on the XZ plane (1650 nm in length). Therefore, the oversaturated solute atoms and the cellular structure control the phonon and electron scattering and limit the thermal diffusivity and thermal conductivity. As the temperature approaches 150 °C, slightly above the Debye temperature, the phonon mean-free path should remain constant as lattice vibrations reach its maximum cut-off frequency (or mean-free path reduces to 2.74 Å) where vigorous lattice vibrations can significantly increase the lattice diffusion. This enhancement of diffusion above the Debye temperature is demonstrated by the fast decay of hardness for AM fabricated AlSi10Mg specimens at higher temperatures (i.e., 160 and 180 °C).Reference Fousova, Dvorsky, Michalcova and Vojtech32 The increased diffusion results in the rapid growth of precipitates as shown by the first exothermic reaction [Figs. 6(a)–6(c)], and further increases the mean-free paths for phonons and electrons. This leads to a fast increase in the thermal diffusivity. Concurrently, because of the exothermic reaction, the product of thermal diffusivity, density, and heat capacity results in a large dip in thermal conductivity curve in Fig. 5. Close to 300 °C, the cellular structure collapses so the slight difference in thermal transfer in X and Z directions disappears. This is where the microstructure begins to lose its control on heat transfer where the freeze zone boundaries start to disappear and the microstructure continues to ripen as temperature increases. This is because the length scale of these microstructure features is far greater, and the number of interfaces are less so their contribution to the overall scattering process become trivial. Thus, the thermal diffusivity and thermal conductivity will decrease as temperature increases. After the part has been heated up to 500 °C, closer to the solution treated temperature, the part is partially homogenized. During the second run, the thermal responses are well behaved where the thermal diffusivity monotonically decreases and thermal conductivity remains almost constant with temperature in this temperature range. In comparison to the reference sample (green squares) and the aluminum (open black circle), the as-built part heat treated at 500 °C for 15 min still possesses a slightly lower thermal diffusivity and thermal conductivity. The difference is still unclear, but it highlights the importance of the thermal treatment on heat transfer.
The electron mean-free-path and the thermal conductivity of a pure aluminum metal at room temperature can be estimated from the electron velocity above its Fermi level, the average time between collisions, and electrical conductivity of the element (Appendix). The calculated thermal properties due to electron and phonon scattering are given in Table I. The results of this first-order analysis show that the calculated thermal conductivity is 267.7 W/(m K) based on the Wiedemann–Franz law, and the calculated electron average mean-free path is 145 Å. The calculated thermal conductivity is slightly greater than the measured data (237 W/m K) presumably due to a lower calculated Lorentz factor (L = λ/σT). When a small amount of alloying atoms are introduced, these solute atoms will produce additional phonon scattering due to the anharmonic vibration in the lattice which effectively reduces the electron mean-free-path. A similar argument can be used for the introduction of lattice imperfections from a rapid quenching. Jordovic et al.Reference Jordovic, Nedeljkovic, Mitrovic, Zivanic and Maricic37 studied the effect of annealing on electrical resistivity of a rapid quenched AlSi10Mg alloy from the melt and observed an abrupt decrease in the relative electrical resistivity [ρ(T)/ρ(27 °C)] between the measured values with respect to the resistivity at room temperature during heating (Fig. 7, solid dots) in comparison to a solution treated specimen (open dots). The observation was attributed to the healing of chaotically distributed dislocations and microstrains in the alloy between 200 and 300 °C, leading to improved overlapping between 2p and 3s electron subshells of neighboring Al atoms, thereby increasing electron density at the Fermi level in the alloy. Their analysis further suggests that the abrupt change in resistance involved a fast thermally activated healing process and a slow diffusion control process which may involve atomic diffusion. However, this healing argument by removing lattice imperfections was solely supported by electrical measurement without any microstructural investigation and support. It is likely that the diffusion mechanism such as Si exolution and microstructural evolution reported in the previous section should have significant impacts on the observed electrical behavior because the change of relative resistivity in their measurements matches all the thermal events, temperatures, and microstructure evolutions reported in this study. Our calculated electron average mean-free-path (145 Å) in pure aluminum is comparable to the distance between cellular walls (200–500 nm), but much longer than the distance between the nanoprecipitates. Therefore, the scattering of electrons at the cellular walls will dominate thermal impedance processes for electrons. Other contributions from grain and freeze zone boundaries can play a minor role in heat transfer but the probability of scattering electrons at these locations is much lower. Above 350 °C, electrons can move more freely without incurring significant collisions due to the collapse of three-dimensional interconnected cellular walls. Interpretations based on this study of microstructural evolution, changing in the electron mean free path, can explain the resistivity changeReference Jordovic, Nedeljkovic, Mitrovic, Zivanic and Maricic37 reported by Jordovic.
FIG. 7. The change of relative resistance [i.e., ρ(T)/ρ(27 °C)] as a function of temperature for a melt spinning, rapidly quenched (solid circles) thin ribbon and a conventional prepared (open circles) AlSi10Mg alloy. (Data are adopted from original figure with permission from Ref. Reference Jordovic, Nedeljkovic, Mitrovic, Zivanic and Maricic37).
These results clearly illustrate the effect of microstructural evolution on thermal properties of an AM fabricated, solution treatable AlSi10Mg part. Heat transfer in these rapidly solidified alloys made by AM processes can drastically decrease when the length scale between solute atoms and microstructure features are close to the electron and phonon means free paths. This provides a unique capability for AM processes to produce large size, ultra-low and slightly anisotropic heat transfer, and extremely hard materials for thermal shielding used below the Debye temperature of the base metal. Conversely, heat transfer can be improved by introducing a proper thermal annealing process after manufacturing because the number of these scattering centers can be progressively reduced as the microstructure ripens. Therefore, the heat transfer properties and possibly the electrical conductivity of AlSi10Mg fabricated parts, can be tailored by thermal treatments above its Debye temperature. It is believed that some other popular solution treatable alloys, such as Inconel 718 and Ti6Al4V, may possess the same characteristics as AlSi10Mg alloy and their thermal properties are similarly impacted by rapid solidfication in the AM process and they also may be tailored by microstructural evolution through proper thermal annealing.
V. CONCLUSION
Rapid solidification of solution treatable alloys in AM processes produce a nanosized cellular structure and a supersaturated lattice and imparts an ultra-low thermal diffusivity and thermal conductivity that cannot be easily produced by conventional solution treated and quenched processing of the same alloy. A large quantity of microstructural features close to the electron and phonon mean free paths can significantly reduce the heat transfer properties of AM produced parts. During a thermal treatment above the Debye temperature, microstructural evolution including exolution, precipitate formation, and collapsing of cellular walls and microstructure ripening progressively reduces the phonon and the electron scattering centers and revitalizes the thermal properties. This work illustrates the effect of microstructural evolution on the thermal properties for an AM fabricated AlSi10Mg part and implications are important for other AM produced parts based on popular solution treatable alloys such as Ti6Al4V and Inconel 718 for thermal applications.
ACKNOWLEDGMENTS
The authors would like to thank Amy Allen for SEM and Sandia LDRD office for programmatic support. Sandia National Laboratories is a multi-mission laboratory managed and operated by National Technology and Engineering Solutions of Sandia, LLC, a wholly owned subsidiary of Honeywell International Inc., for the U.S. Department of Energy’s National Nuclear Security Administration under contract DE-NA0003525.
APPENDIX
The mean free path of electron in pure aluminum can be calculated by
 $${I_{\rm{e}}} = {V_{\rm{F}}}\tau \quad ,$$
where I is the man free path, V F is the velocity of the electron above Fermi level, and τ is the average time between electronic collisions. The Fermi velocity can be calculated by
 $${V_{\rm{F}}} = \sqrt {{{2{E_{\rm{F}}}} / {{m_{\rm{e}}}}}} \quad ,$$
where the E F is the Fermi energy and m e is the effective mass of electron (9.11 × 10⁻³¹). The Fermi energy at zero Kevin is given by
 $${E_{\rm{F}}} = {\eta \over {2{m_{\rm{e}}}}}\left( {{{3N} \over {8\pi V}}} \right)\quad ,$$
where N/V is the free electron density and η is the Plank’s constant. The average time between collision τ is determined by the mass of the electron, the number of atoms per unit volume, electrical resistivity (ρ), and the electron charge (e)
 $$\tau = {{{m_{\rm{e}}}} \over {\rho n{e^2}}}\quad .$$
The thermal conductivity K can be estimated by the Wiedemann–Franz law
 $$K = {{\sigma T} \over 3}{\left( {{{\pi k} \over \varepsilon }} \right)^2}\quad ,$$
where σ is the electrical conductivity and k is the Boltzmann constant.
(i) Phonon calculation
Phonon mean free path (l p) above Debye temperature can be estimated by
 $${l_{\rm{p}}} \approx {{3\lambda } \over {{C_{\rm{v}}}\nu }} = {{3\alpha } \over \nu }\quad ,$$
where, C v is the volumetric heat capacity, ν is the sound velocity in the medium, measured longitudinal (νL: 6453 m/s) and the shear (νs: 3119 m/s) sound velocities by the following relationship,
 $$\nu = {\left[ {{1 \over 3}\left( {{2 \over {{\nu _{\rm{s}}}^3}} + {1 \over {{\nu _{\rm{L}}}^3}}} \right)} \right]^{{{ - 1} / 3}}}\quad .$$
(i) Debye temperature (θD)
 $${\theta _{\rm{D}}} = {{\eta \nu } \over {2k}}\root 3 \of {{{6N} \over {\pi V}}} \quad ,$$
where k is the Boltzmann constant.


 Open access