


I. INTRODUCTION
Abundant in nature, as exemplified by bones, bamboos, and mollusk shells, Reference Seidel, Lyons, Blumer, Zaslansky, Fratzl, Weaver and Dean1–Reference Ortiz and Boyce11 mesoscale heterogeneous material systems are more efficient and adaptive to thermal and mechanical environments than their statistically homogeneous counterparts. The mesostructures in natural materials are designed through the evolutionary processes on a large time-scale, where multiple design goals, such as weight reduction, mechanical performance (e.g., contact resistance, damage localization, and bending resistance), growth and health, etc., are taken into account. Similarly, engineers can design the mesoscale distribution of materials or porosity to significantly improve the mechanical performance. Engineering applications are often associated with highly nonuniform stress fields resulting from the convolution of component geometries, loading conditions, and environmental changes. By introducing a mesoscale pattern of internal material distribution, the stress fields will be redistributed. Material properties can be allocated to areas most in need, rendering tremendous material efficiencies as compared to parts that are statistically homogeneous at the macroscale. Reference Torquato12,Reference Torquato13 The most representative engineering mesostructured system is a functionally graded material. The graded mesoscale material distribution delays the onset of plastic yielding and failure for a given thermomechanical load, and reduces the driving force for crack growth along and across an interface. Reference Suresh and Mortensen14–Reference Suresh and Mortensen16 A mesostructured material system is not limited to a distribution of different constituent materials or their mixtures but can also be a distribution of the same material with different microstructures. Reference Choi, Detor, Schwaiger, Dao, Schuh and Suresh17,Reference Allahyarzadeh, Aliofkhazraei, Rouhaghdam and Torabinejad18 For example, metals with a gradient in grain size or twin density can be fabricated by surface treatment or torsion, showing high strength and high ductility simultaneously. Reference Lu19–Reference Wei, Li, Zhu, Liu, Lei, Wang, Wu, Mi, Liu, Wang and Gao22
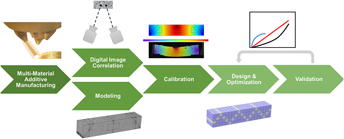
In spite of showing promise in engineering efficiency, the mesostructure in engineering materials has rarely been a pure result of computational design, but is a compromise between the design ideal and manufacturing constraints. Thanks to the recent progress in advanced manufacturing, especially multi-material additive manufacturing, Reference Bourell, Leu and Rosen23–Reference Tino Stankovic, Egan and Shea27 mesostructure control is becoming available for a wide variety of materials, including polymers, metals, and composites. Reference Bourzac, Savage, Owens and Scott28–Reference Hofmann, Roberts, Otis, Kolodziejska, Dillon, Suh, Shapiro, Liu and Borgonia32 Figure 1 shows two types of mesoscale heterogeneous material systems readily fabricated by multi-material additive manufacturing. The left side shows a material system with gradient properties by mixing multiple constituent materials and controlling the volume ratios. For polymers, such systems have been demonstrated in inkjet 3D printing Reference Bourell, Leu and Rosen23 ; for metals, such systems have been demonstrated in directed energy deposition, especially in laser engineered net shaping (LENS). Reference Balla, DeVasConCellos, Xue, Bose and Bandyopadhyay31–Reference Banerjee, Collins, Bhattacharyya, Banerjee and Fraser34 The right side shows a second type of mesoscale heterogeneous material systems, where each material voxel is assigned to be a specific constituent material. Such a material system can be fabricated by multi-nozzle extrusion, Reference Yan, Xiong, Hu, Wang, Zhang and Zhang35,Reference Khalil, Nam and Sun36 inkjet 3D printing, Reference Mueller and Daraio37,Reference Tian Chen and Shea38 or directed energy deposition. Reference Balla, DeVasConCellos, Xue, Bose and Bandyopadhyay31–Reference Banerjee, Collins, Bhattacharyya, Banerjee and Fraser34
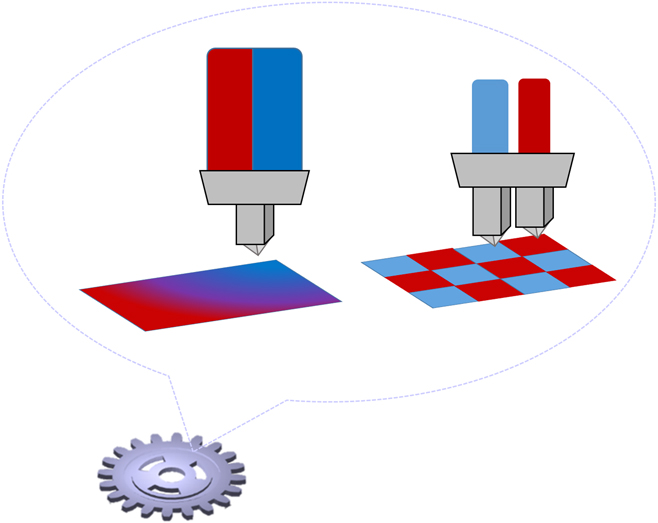
FIG. 1. An illustration of multi-material manufacturing of mesostructured materials: (left) a gradient of the material properties by mixing multiple constituent materials and (right) selective deposition of individual constituent materials.
Since multi-material additive manufacturing provides a unique pathway to implementing an arbitrary mesoscale material distribution, Yu, Cross, and Schuh Reference Yu, Cross and Schuh39 proposed to use computational optimization schemes for mesostructure design. By investigating the resistance to contact loading and bending as examples, they showed that significant improvement in material efficiency, load bearing capacity, and weight saving can be achieved by properly distributing the mechanical properties across the component. In that work, the optimal material distribution was determined not by trial and error or intuition of the trend but by a rigorous global optimization process using a metaheuristic optimization algorithm. Reference Yang, Gonzalez, Pelta, Cruz, Terrazas and Krasnogor40,Reference Yang41 These discussions were only from a theoretical perspective, and no experimental work was performed for model calibration and validation.
While many previous approaches assumed that the mechanical response of a mesostructured system can be simulated with mechanical properties of the individual constituent materials measured from uniaxial tension testing, Reference Mueller and Daraio37,Reference Tian Chen and Shea38 we found that this type of prediction can severely deviate from the reality. This is primarily because external loading results in a multi-axial stress state in each material voxel of the heterogeneous mesostructured system. Using uniaxial tension tests to measure the constitutive equation is valid only when the following criteria are met: (i) the materials exhibit symmetric behavior in tension and compression, i.e. the mechanical behavior is not pressure-dependent; (ii) the materials are isotropic. Reference Bower42 In multi-material additive manufacturing, neither is the case. In addition, the thermal and thermomechanical processes in fabrication of mesostructured systems can differ significantly from the fabrication of a single material tensile bar, Reference Gibson, Rosen and Stucker24,Reference King, Anderson, Ferencz, Hodge, Kamath, Khairallah and Rubenchik43–Reference Gebhardt46 which can lead to profound differences in the microstructure and the resultant material parameters. Therefore, it is essential to directly calibrate the effective material parameters during deformation of the mesostructured material systems.
The goal of this study is to propose and demonstrate an experiment-informed framework for mesoscale material design in multi-material additive manufacturing. Upon mechanical loading, the local deformation of the material system is characterized using digital image correlation (DIC) for the surface material voxels or digital volume correlation (DVC) for the internal material voxels, Reference Bay, Smith, Fyhrie and Saad47–Reference Sutton, Yan, Tiwari, Schreier and Orteu51 and is modeled using constitutive approaches and simulated with 3D finite element modeling (FEM) (i.e., mesomechanical constitutive modeling Reference Kafka52 ). Calibration of the voxel-level deformation between the simulation and in situ mechanical characterization determines the effective parameters in the constitutive equations for each constituent material in the multi-material system. The mesoscale material distribution can then be optimized for a given application by coupling global optimization algorithms with the calibrated model. We demonstrate and validate the design framework using a beam-shaped mesostructured material system made from a hyperelastic material and a linear elastic material, which is fabricated using dual extrusion-based additive manufacturing.
II. THE PROPOSED DESIGN FRAMEWORK
The proposed design framework consists of six major components: (i) fabrication of heterogeneous material systems with pre-defined mesostructure designs, (ii) deformation mapping using DIC or DVC, (iii) modeling of the deformation behavior of the mesostructured material systems, (iv) model calibration using voxel-level deformation data, (v) mesostructure design and optimization for given applications, and (vi) manufacturing and experimental validation of the optimal mesostructure. These components and their roles in the proposed design framework are illustrated in Fig. 2.

FIG. 2. Flowchart of the proposed framework for mesostructure design in multi-material additive manufacturing.
A. Fabrication of mesostructured systems using multi-material additive manufacturing
A heterogeneous material system with a pre-defined mesostructure design is readily fabricated using multimaterial additive manufacturing technologies, such as multi-material inkjet 3D printing, multi-nozzle extrusion, and the LENS process. The mesoscale material distribution is generated by the computer-aided design files and implemented during the manufacturing process, in which each voxel is assigned to a given material or a mixture of multiple constituent materials with controlled volume ratios. To avoid changes in material distribution by interdiffusion, postprocessing heat treatment is generally not used. As a result, the local material properties strongly depend on the processing parameters; material parameters from conventional databases are not accurate to use for materials fabricated by multi-material additive manufacturing.
B. Deformation mapping using DIC or DVC
The deformation of a mesoscale heterogeneous material system cannot be fully characterized using a single stress–strain relationship, because two different mesostructured material systems can have the same stress–strain curve under axial loading. Instead, characterization of the local deformation at the material voxel level is necessary. In a mesoscale heterogeneous material system, the deformation of surface material voxels can be characterized using DIC, Reference Pan, Qian, Xie and Asundi50 whereas the deformation of internal material voxels can be characterized using DVC, Reference Bay, Smith, Fyhrie and Saad47 e.g., through X-ray tomography. The 2D image contrast in DIC comes from black and white speckling on the surface of the material. The 3D image contrast in DVC, either absorption contrast or phase contrast, Reference Zhu, Zhang and Barbastathis53 comes from the mesoscale heterogeneity in the material systems.
C. Modeling of the deformation behavior of the mesostructured material systems
The success of mesostructure design and optimization depends on the capability of accurately modeling the deformation behavior. Once the constitutive behavior of each material voxel is known (e.g., linear elastic, elastic–plastic, or hyperelastic), the deformation of the material system can be simulated using finite element analysis. The part properties in additive manufacturing strongly depend on processing conditions. The values of material parameters from the conventional material databases are not suitable as they generally do not include information for additively manufactured parts. It is thus critical to calibrate the effective material parameters in a mesostructured material system from experiments.
D. Model calibration using voxel-level deformation data
In additive manufacturing, the thermomechanical condition can differ significantly in fabrication of a single material tensile bar or sheet, as compared to fabrication of a mesoscale heterogeneous material system consisting of multiple materials. Therefore, it is inappropriate to first calibrate the parameters for each constituent material (e.g., using uniaxial tension or biaxial tension) and then apply the calibrated values to model the mesostructure. Instead, we directly measure the mesoscopic mechanical response of the heterogeneous material system. Through the error minimization algorithm that accounts for thousands of data points from in situ DIC and FEM, accurate material parameters can be determined.
E. Mesostructure design
After model calibration, mesostructure optimization can be performed, which involves the computation of a deformation-related objective function with each iteration adopting a different mesostructure design. While deformation can be simulated using finite element analysis, the mutation of the mesostructure design between neighboring iterations and the acceptance criteria of the new design are defined using global optimization algorithms. Because this process involves calling a ‘black box-like’ FEM solver, metaheuristic global optimization algorithms such as genetic algorithms, Reference Tino Stankovic, Egan and Shea54 particle swarm optimization, Reference Kennedy and Eberhart55 and simulated annealing Reference Yu, Cross and Schuh39,Reference Cross, Woollam, Shademan and Schuh56 are used to identify the optimal mesostructure.
F. Validation
The last component in the proposed design framework is to experimentally validate the optimization results, so the figure of merit (i.e., objective function in optimization) can be compared for the optimal and conventional mesostructured material systems. The validation involves fabrication of a material system with various mesostructure designs using multi-material additive manufacturing as well as mechanical testing.
In this article, we demonstrate the proposed design framework using a rectangular beam-shaped material system consisting of a stiff and a compliant polymeric material, which is fabricated using dual extrusion-based additive manufacturing. Within the deformation range of this work, the stiff material displays linear elastic behavior, while the compliant material displays hyperelastic behavior. The effective parameters in the constitutive models are calibrated by matching the deformation data of ∼3000 surface material voxels from in situ DIC measurement and FEM, when the beam is subjected to three-point bending. The optimal mesostructure for the maximum bending resistance is then determined based on the calibrated model and validated using experiments.
III. EXPERIMENTAL PROCEDURES
Mesostructured beams of dimensions of 20 × 20 × 100 mm were fabricated using a Lulzbot Taz 6 3D printer (Aleph Objects, Inc., Loveland, Colorado) with dual extrusion nozzles. The nozzle temperature was 225 °C and the scanning speed was 12 mm/s for both nozzles. The two constituent materials are the stiff Taulman Bridge Nylon filament (Material S; taulman3D, Saint Peters, Missouri) and the compliant polyurethane-based NinjaTek NinjaFlex filament (Material C; Ninjatek, Manaheim, Pennsylvania). Material S and Material C are proprietary materials, and there are no available databases providing information regarding their properties and parameters. These specific materials were chosen for their printability and significant difference in stiffness. Multiple distributions of these materials were created and tested under three-point bending using a 5969 Instron (Instron, Norwood, Massachusetts) at a constant rate of 0.5 mm/min. The loading contacts were located 10 mm from each edge on the bottom and centered on the top.
During three-point bending, the deformation of surface voxels on the beam was characterized using DIC (Dantec Dynamics Q-400, Dantec Dynamics, Inc., Skovlunde, Denmark). With two cameras, the displacement in all three directions can be monitored in situ. Prior to testing, the samples were coated with a layer of white paint and then coated with a random speckling of black paint. This helped to determine the local displacement by tracking changes in the gray value pattern in small neighborhoods. As a result, the deformation for a total of ∼3000 surface voxels was measured on the beam.
IV. DEFORMATION MAPPING OF THE MESOSTRUCTURED BEAMS USING DIC
Finite element analysis has shown how the strain and stress fields can be sculptured by distributing the constituent materials to maximize the resistance to failure. Reference Yu, Cross and Schuh39,Reference Jin and Batra57–Reference Arciniega and Reddy61 However, this has not been characterized in situ or confirmed experimentally. DIC enables the tracking of deformation for surface material voxels upon loading and allows for visualization of the interactions between the mesoscale material domains and the resultant strain or stress redistribution. DIC-based deformation mapping can also be fed back into finite element models to calibrate the effective material parameters, from which the mesostructure can be computationally optimized for a given application.
As examples, Fig. 3 shows the deformation distribution of three mesostructured beams ((a), (c), (e)) at the same beam deflection of 5 mm. From in situ DIC measurement, the magnitude (shown by color) and direction (shown by lines) of the maximum normal strain of surface material voxels are shown in (b), (d), (f) accordingly. The beam in (a) is made of the pure compliant polymer (Material C) with the maximum tensile strain occurring at the center of the bottom surface, as shown in (b). This is expected for a homogeneous material under three-point bending. The beam in (c) consists mostly of the stiff polymer (Material S) with the small compliant domains (made of Material C) showing high local strains, as shown in (d). The beam in (e) has the opposite material distribution, and therefore an opposite contrast in the strain distribution image, as shown in (f). Comparing the maximum normal strain at the center of the bottom surface in (b) and (f), it is interesting to note that the high tensile strain observed in the former is significantly reduced in the latter, owing to the presence of a small rectangular stiff material domain in the beam center that effectively redistributes the local strain field. From in situ DIC measurement, these examples show and confirm how distributing the constituent materials can impact the local deformation of a mesostructured material system, and why optimizing the mesostructure for desired applications is of great importance.

FIG. 3. Three mesostructured beams. (a), (c), and (e): the mesostructure designs; (b), (d), and (f): the maximum normal strain distribution measured by DIC.
V. MODEL DEVELOPMENT AND CALIBRATION
Mesostructure design requires accurate modeling of the deformation behavior of a mesoscale heterogeneous material system. For the current study, two questions need to be answered:
-
(i) Which types of constitutive behavior best describe Material S and Material C?
-
(ii) What are the effective material parameters in the constitutive equations?
Answering the first question requires a closer examination of the mechanical behavior of individual constituent materials. With that answer, the second question can be addressed by calibrating the model using the voxel-level deformation data from in situ DIC measurement.
A. Constitutive behavior of individual constituent materials
To understand the constitutive behavior of individual constituent materials, we first characterize Material S and Material C by uniaxial tension testing. Figure 4 shows that Material S displays elastic–plastic behavior with the linear regime up to axial strain of 6%, whereas Material C displays typical hyperelastic behavior with a nonlinear stress–stretch relationship. For Material S in the linear elastic regime, the Young’s modulus is measured as E S = 190 MPa and the Poisson’s ratio is measured as νS = 0.46. For Material C, the deformation can be described using the Mooney–Rivlin model (five parameter) Reference Rivlin and Saunders62 that gives the relationship between the strain energy density W S and I 1, I 2, which are the first and second invariant of the unimodular component of the left Cauchy–Green deformation tensor Reference Bower42 :
 $${W_{\rm{S}}} = {C_{10}}\left( {{I_1} - 3} \right) + {C_{01}}\left( {{I_2} - 3} \right) + {C_{20}}{\left( {{I_1} - 3} \right)^2} + {C_{02}}{\left( {{I_2} - 3} \right)^2} + {C_{11}}\left( {{I_1} - 3} \right)\left( {{I_2} - 3} \right)\quad ,$$
where C ij (i, j = 0, 1, 2) are the five fitting parameters. Fitting the engineering stress versus stretch curve in Fig. 4(b) gives the five fitting parameters: C 10 = −2.38, C 01 = 5.37, C 20 = 0.004, C 02 = 0.69, and C 11 = −0.012 MPa.

FIG. 4. (a) The stress–strain curve (solid) for the stiff material from a uniaxial tension test plotted alongside the slope in the linear elastic region (dashed). (b) The stress–stretch curve (solid) obtained through a uniaxial tension test that demonstrates the hyperelastic nature of the compliant material, which is plotted alongside the fitted curve (dashed) using the Mooney–Rivlin model (five parameter).
As discussed in Sec. II.D, the values of E S and C ij (i, j = 0, 1, 2) determined from single material calibration in Fig. 4 cannot be used as effective material parameters for mesostructure design. In dual extrusion, the thermal and thermomechanical processes differ in fabrication of a single material as compared to fabrication of a beam with two polymers. This can lead to different microstructure and material parameters between the single and multi-material parts. In addition, the hyperelastic Material C is pressure-dependent, so the material parameters cannot be determined by a single uniaxial tension test.
B. Calibration using the voxel-level deformation data from DIC
We calibrate the effective parameters for Material S (Young’s modulus E S and Poisson’s ratio νS) and Material C [fitting parameters C ij (i, j = 0, 1, 2)] by matching the voxel-level deformation data from FEM to that from in situ DIC measurement. The FEM is conducted using COMSOL Multiphysics Solver (COMSOL Inc., Stockholm, Sweden) equipped with the nonlinear structural mechanics module. The best calibration condition is achieved when the average displacement difference between DIC and FEM is minimized for all the surface material voxels.
Using a mesostructured beam with 3/4 volume fraction of Material S and 1/4 volume fraction of Material C as the model system [see Fig. 5(a)], we conduct the calibration for different loads up to P = 800 N. Under these loads, we have confirmed that the beam deformation is reversible using DIC measurement so that the deformation of Material S is within the elastic range. For a given set of effective material parameters, we calculate the average displacement difference, $\overline {\Delta S}$
, and use it as the objective function, which is to be minimized. For the current study, each in situ DIC measurement gives the in-plane displacement for N ∼ 3000 surface material voxels in a mesostructured beam. The objective function can be written as
$\overline {\Delta S}$
, and use it as the objective function, which is to be minimized. For the current study, each in situ DIC measurement gives the in-plane displacement for N ∼ 3000 surface material voxels in a mesostructured beam. The objective function can be written as
 $$\overline {\Delta S} = {{\sum\limits_{i = 1}^N {\sqrt {{{\left( {u_i^{{\rm{DIC}}} - u_i^{{\rm{FEM}}}} \right)}^2} + {{\left( {v_i^{{\rm{DIC}}} - v_i^{{\rm{FEM}}}} \right)}^2}} } } \over N}\quad ,$$
where u and v refer to the horizontal and vertical displacement, respectively. The superscript DIC and FEM refer to the data obtained from in situ DIC measurement and from FEM, respectively.
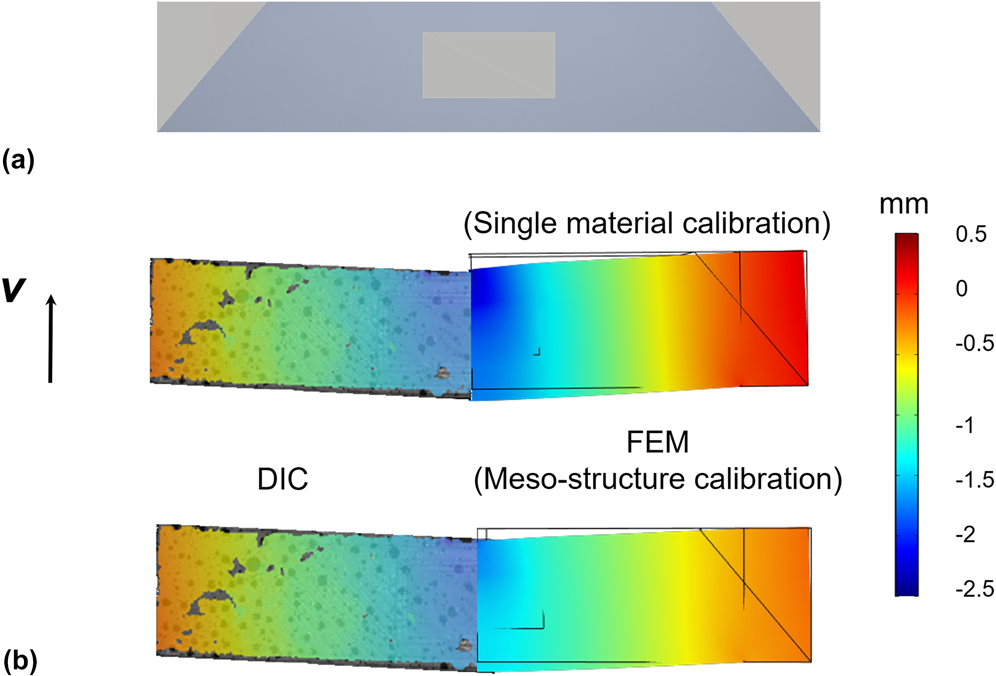
FIG. 5. (a) An illustration of the mesostructured beam used for calibrating the material parameters. (b) A comparison of the vertical displacement at P = 500 N measured by DIC to (top) FEM prediction based on single material calibration and (bottom) FEM prediction based on mesostructure calibration.
The calibration is accomplished by searching for the best set of effective material parameters [E
S, νS, and C
ij
(i, j = 0, 1, 2)] that minimizes $\overline {\Delta S}$
. Such an optimization process is performed by coupling the finite element solver with metaheuristic optimization algorithms via the MATLAB LiveLink software package. A simulated annealing algorithm is used to mutate the parent set of effective material parameters [E
S, νS, and C
ij
(i, j = 0, 1, 2)] in each iteration k.
Reference Lamberti63,Reference Moita, Correia, Martins, Soares and Soares64
If the objective function decreases, the new set of material parameters will be accepted; if the objective function increases, the new set of material parameters will be accepted with a finite probability, depending on the ratio of the change in the objective function
$\overline {\Delta S}$
. Such an optimization process is performed by coupling the finite element solver with metaheuristic optimization algorithms via the MATLAB LiveLink software package. A simulated annealing algorithm is used to mutate the parent set of effective material parameters [E
S, νS, and C
ij
(i, j = 0, 1, 2)] in each iteration k.
Reference Lamberti63,Reference Moita, Correia, Martins, Soares and Soares64
If the objective function decreases, the new set of material parameters will be accepted; if the objective function increases, the new set of material parameters will be accepted with a finite probability, depending on the ratio of the change in the objective function $\left[ {\overline {\Delta S} (k + 1) - \overline {\Delta S} (k)} \right]$
to a temperature parameter T (the value of T exponentially decreases in each iteration). This algorithm allows for occasional acceptance of inferior values so that the search can effectively escape from local minima and rapidly move through valleys in the search space. We use the fitting parameters in Fig. 4 as the starting variables; after ∼100 iterations, the objective function converges, and the effective material parameters are calibrated as E
S = 164 MPa, νS = 0.4, and C
10 = −1.90, C
01 = 2.68, C
20 = 0.008, C
02 = 0.35, C
11 = −0.019 MPa.
$\left[ {\overline {\Delta S} (k + 1) - \overline {\Delta S} (k)} \right]$
to a temperature parameter T (the value of T exponentially decreases in each iteration). This algorithm allows for occasional acceptance of inferior values so that the search can effectively escape from local minima and rapidly move through valleys in the search space. We use the fitting parameters in Fig. 4 as the starting variables; after ∼100 iterations, the objective function converges, and the effective material parameters are calibrated as E
S = 164 MPa, νS = 0.4, and C
10 = −1.90, C
01 = 2.68, C
20 = 0.008, C
02 = 0.35, C
11 = −0.019 MPa.
Figure 5(b) compares the calibration approaches using the voxel-level deformation data in the mesostructured beam and using the single material data in Fig. 4. The left side shows the distribution of vertical displacement (v) in the DIC data under P = 500 N, whereas the right side shows the FEM prediction based on (upper) single material calibration and (lower) mesostructure calibration. Notably, mesostructure calibration using the voxel-level deformation data leads to a much more accurate prediction and should be used for mesostructure design in the optimization step. Quantitatively, the prediction error $\overline {\Delta S}$
decreases from ∼30% of the average total displacement with single material calibration to ∼10% with mesostructure calibration.
$\overline {\Delta S}$
decreases from ∼30% of the average total displacement with single material calibration to ∼10% with mesostructure calibration.
Although the calibration was performed using only one mesostructure design, our preliminary calibration exercises suggest a weak correlation between the mesostructure and calibration results. This suggests that the influence on the optimization results is also inconsequential. If the correlation between calibration results and mesostructure design is significant, a data-driven approach needs to be used to quantify this correlation, and to establish a surrogate model. Reference Higdon, Gattiker, Williams and Rightly65,Reference Besag, Green, Higdon and Mengersen66 However, even a strong correlation will not affect the structure of the proposed framework; once the correlation is properly determined, it can be inserted as an additional procedure during the iterative optimization.
VI. MESOSTRUCTURE DESIGN
A. Computational optimization
With the calibrated model, we can design the mesostructure for a given application. The goal here is to determine the optimal distribution of Material S and Material C for the maximum bending resistance, while maintaining 3/4 volume fraction of Material S and 1/4 volume fraction of Material C as in the model system for calibration. The objective function that is to be minimized is defined by the beam center deflection. The beam is then divided into 80 material domains, each with dimensions of 5 × 5 × 20 mm. The best material distribution is found using a simulated annealing algorithm through the COMSOL–MATLAB LiveLink software package, a similar approach to what is used for model calibration. The simulated annealing algorithm mutates the initial distribution for every iteration by randomly selecting 30 domains on the left half of the beam and assigning them the calibrated parameters of Material S while assigning the remaining 10 domains the calibrated parameters of Material C. These domains are then reflected across the center line to provide a symmetrical part for every iteration. By forcing every predicted design to be symmetrical, the number of iterations necessary to reach the optimal design is significantly reduced.
Even with different initial material distributions, the objective function converges at the same value after 1000–1500 iterations, as shown in Fig. 6(a). The best distribution of Material S and Material C determined by computational optimization is shown in Fig. 6(b), which has a beam center deflection of 2.85 mm at 500 N. This result is physically meaningful and intuitive; a heavier distribution of the stiff polymer near the loading regions maximizes the resistance to bending. The von Mises stress distribution in Fig. 6(c) shows that the presence of the stiff polymer effectively shields the compliant polymer from high local stresses in the optimal mesostructure design.
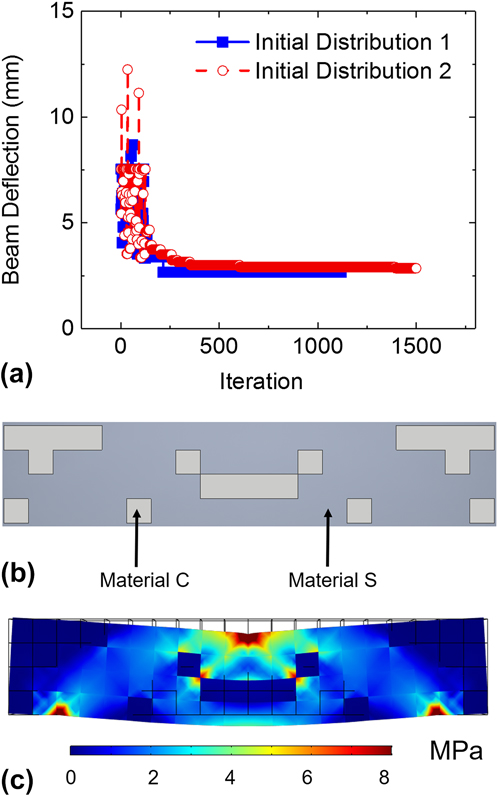
FIG. 6. (a) Evolution of the objective function in simulated annealing, with two different initial material distributions. (b) The optimized mesostructure design to minimize the deflection during three-point bending. (c) An illustration of the von Mises stress distribution in the optimized structure, showing the concentration of stress in the stiff material domains.
B. Experimental validation
To validate the computational optimization results, three beams with different mesostructures but with the same volume fractions of Material S and Material C, are manufactured and subjected to a three-point bending test. The first sample is the optimal design shown in Fig. 6, the second sample is the design used for model calibration in Sec. V, and the third sample is a layered structure. Figure 7(a) shows the printed sample surface, with the regions of Material C highlighted in gray. The load versus displacement for each sample is shown in Fig. 7(b), which confirms that the optimized structure (the first sample) yields the least amount of deflection at 500 N. Furthermore, the experimentally measured deflection at the center point, 2.81 mm, is very close to the predicted value of 2.85 mm from the calibrated model. By contrast, the prediction using the uniaxial, single material calibration yielded a deflection of 2.41 mm, again demonstrating the importance of mesostructure calibration. The second sample also has high bending resistance, though still lower than the first sample below 500 N, with the measured beam center deflection of 2.95 mm. This result is not surprising, because this mesostructure design also has a high concentration of the stiff polymer near the loading regions to resist bending. The significance of the optimization can be more readily observed when comparing the optimized sample to the sample with a layered structure, which experiences over 7 mm of deflection.

FIG. 7. (a) Pictures of three manufactured beams: (from top to bottom) the first sample with the optimized mesostructure; the second sample with the mesostructure used for calibration; the third sample with a layered mesostructure. The material domains of the compliant polymer are highlighted in gray. (b) The load versus displacement curves for the three samples, showing the minimum deflection in the optimized beam.
It should be noted that the load–displacement curves for the first and second design intersect at ∼600 N. From this point on, the second design outperforms the optimized design. Our optimization was performed at 500 N. While the optimal design was the best for the particular loading condition, it is not necessarily optimized for all bending conditions. Even so, this demonstrates the ability of the framework to achieve high performance for a specific loading condition based on the intended application.
VII. CONCLUSION
In summary, we propose and demonstrate a framework for mesostructure design in multi-material additive manufacturing. The framework consists of both experimental and theoretical components including fabrication, in situ characterization of local deformation, modeling, model calibration, mesostructure optimization, and experimental validation. We show that DIC is an effective tool to characterize the deformation of surface material voxels providing sufficient data points for model calibration. Compared to single material calibration, mesostructure calibration leads to a much better prediction of the deformation behavior. Coupling the calibrated model with metaheuristic optimization algorithms such as simulated annealing, we can optimize the mesostructure for specific applications. We demonstrate this design framework using mesostructured beams consisting of a compliant polymer and stiff polymer. We optimize the material distribution for maximum bending resistance at a given load and then validate the computational results using three-point bending experiments.
Although we use a polymeric material system as the example, this framework can be applied to other material systems, such as gradient metals or mesostructured composites. Different constitutive equations should be used to characterize the specific constituent materials. For example, strain hardening models should be applied for high strength and high ductility metals. In addition, the target problems are not limited to deformation, but can include thermal expansion, energy dissipation, thermomechanical coupling, or even multiphysics problems.


 Open access