


I. INTRODUCTION
The synthesis of novel nanostructured alloys obtained from forced solid solutions in different immiscible systems (i.e., Cu–Ag, Cu–Fe, Cu–Co, Cu–Nb, Mg–Zr, Cu–Ag–Nb, and Ag–Cu–Ni) using high-pressure torsion (HPT) as the bulk processing technique has been the focus of several recent studies.Reference Edalati, Uehiro, Fujiwara, Ikeda, Li, Sauvage, Valiev, Akiba, Tanaka and Horita1–Reference Bachmaier, Krenn, Knoll, Aboulfadl and Pippan18 These forced solid solutions are not only interesting from a scientific point of view but also for future technical applications. HPT-deformed supersaturated Mg–Zr phases, for example, showed reversible hydrogen storage capability at room temperature.Reference Edalati, Emami, Ikeda, Iwaoka, Tanaka, Akiba and Horita2 These nonequilibrium solid solutions have also been shown to form nanoscale composites upon annealing at elevated temperatures. For instance, isothermal annealing above the decomposition temperature of a single-phase face-centered cubic (fcc) Cu–26 at.% Co alloy produced via “bulk” mechanical alloying using HPT deformation resulted in spinodal-type decomposition and the formation of a nanoscale composite structure.Reference Bachmaier, Pfaff, Stolpe, Aboulfadl and Motz14 The thus-formed microstructures exhibit not only interesting magnetic propertiesReference Bachmaier, Krenn, Knoll, Aboulfadl and Pippan18 but also an enhanced hardness in the annealed states as was measured by microhardness measurements.Reference Bachmaier, Pfaff, Stolpe, Aboulfadl and Motz14 It has been proposed that this phase decomposition mechanism might be used to produce tailored nanostructures with optimized mechanical properties.Reference Bachmaier, Pfaff, Stolpe, Aboulfadl and Motz14 However, a more detailed study of the mechanical properties in the as-deformed and annealed states of the Cu–26 at.% Co alloy, which goes beyond microhardness measurements, is still lacking.
Nanocrystalline materials usually exhibit high strength, often at the expense of ductility. There have, however, been some exceptions reported in the literature and different microstructural concepts, either providing a high strain hardening value and/or strain-rate hardening have been proven beneficial for ductility.Reference Youssef, Scattergood, Murty, Horton and Koch19–Reference Ma, Shen and Wu23 Details of these strategies were discussed in several papers.Reference Ma24–Reference Zhao, Zhu and Lavernia26 Strengthening by spinodal decomposition can be achieved in many different alloy systems, which is known since several decades.Reference Cahn27–Reference Carpenter31 Concurrent strengthening of the Al–Mg alloy by means of HPT and by spinodal decomposition has recently been reported as well.Reference Tang, Goto, Hirosawa, Horita, Lee, Matsuda and Terada32 Similar as in Ref. Reference Bachmaier, Pfaff, Stolpe, Aboulfadl and Motz14, only microhardness was reported in this study providing no detailed information about the mechanical response of the HPT-processed Al–Mg alloy.
Motivated by the promising microhardness of the as-deformed and annealed Cu–Co alloy samples,Reference Bachmaier, Pfaff, Stolpe, Aboulfadl and Motz14 the primary interest of the present work was to study both the mechanical response of the Cu–26 at.% Co alloy by tensile testing, and the influence of the spinodal-type decomposition on the tensile strength and ductility. To accurately and reproducibly probe the mechanical properties, an innovative fabrication method was used for round, small-scale tensile specimens with dimensions proportional to ASTM standard specimens.Reference Rathmayr, Bachmaier and Pippan33,34 An image-based displacement measurement system was applied to measure the strain during tensile testing. This system further enabled the evaluation of true stress–strain curves and strain-hardening behavior. As an additional measure of ductility, the reduction in area was directly determined from the recorded data. Since the decomposition process of the metastable alloys plays a key role in optimizing the mechanical properties, in situ high-energy X-ray diffraction (HEXRD) was used to map changes linked to separating phases during annealing. The HEXRD patterns recorded during annealing thus served as a basis for selecting appropriate annealing temperatures to form the nanoscale composite structure for subsequent tensile testing. The obtained information was further combined with transmission electron microscopy (TEM) investigations of the microstructure. It was shown that a high tensile ductility combined with good strength was achieved in the as-deformed state and that it was maintained during annealing.
II. EXPERIMENTAL
The studied Cu–Co alloys were prepared by HPT deformation at room temperature (25 rotations, 5 GPa pressure, 0.2 rotations/minute). The initial state of the material is a Cu–Co composite consisting of Cu and Co phases with micrometer-sized phase dimensions. The strain applied (equivalent strain ≥220 at a distance ≥1.5 mm from the sample center) is high enough to obtain a steady-state microstructure with a metastable fcc phase and a grain size around 100 nm.Reference Bachmaier, Aboulfadl, Pfaff, Mücklich and Motz15 Synchrotron HEXRD measurements were performed at the PETRA III P07 beamline at the DESY Photon Science facility in Hamburg, Germany.Reference Schell, King, Beckmann, Fischer, Müller and Schreyer35 The in situ annealing measurements were carried out on an as-deformed sample using the quenching and deformation dilatometer DIL805A/D by TA Instruments (New Castle, Delaware) with a beam energy of 100 keV at a distance of 3.5 mm from the sample center.Reference Staron, Fischer, Lippmann, Stark, Daneshpour, Schnubel, Uhlmann, Gerstenberger, Camin, Reimers, Eidenberger, Clemens, Huber and Schreyer36 Heating was performed at 10 °C/min from 25 to 880 °C. A beam spot size of 0.32 × 0.32 mm2 was used to improve the microstructure statistics. The as-deformed samples were subjected to isothermal heat treatments at selected annealing temperatures (150, 400, and 600 °C for 1 h as well as at 400 °C for 7 and 100 h). HEXRD measurements were further conducted on these isothermal annealed samples at a distance ≥1.5 mm from the sample center. All measured HEXRD patterns were analyzed with FIT 2D software (http://www.esrf.eu/computing/scientific/FIT2D/).Reference Hammersley, Svensson, Hanfland, Fitch and Häusermann37
For tensile specimen preparation, HPT samples were cut in half after deformation (and isothermal heat treatments). One round small-size tensile specimen was prepared from each half of a HPT sample using the manufacturing process as described in Refs. Reference Rathmayr, Bachmaier and Pippan33 and 34. The center of the tensile specimen’s gauge length was situated at a radius of 2 mm of the former HPT disk. The geometry of the tensile specimens are proportional to the ASTM standard with a cross-sectional diameter of 0.5 mm and a gauge length of 2.5 mm (ratio of gauge length to gauge diameter of 5), but are smaller than the smallest ASTM specimens.38 Four tensile specimens were tested per investigated state. Tensile tests were performed at room temperature on a tensile testing machine from Kammrath & Weiss (Dortmund, Germany) using a 2 kN load cell and different crosshead speeds between 0.5 and 20 µm/s, which corresponds to strain rates  $\left( {\dot{\varepsilon }} \right)$ ranging from 2.0 × 10⁻⁴ to 8.0 × 10⁻³ s−1. During testing, up to 3.1 frames/s were recorded with a commercial single-lens camera. All tensile data then were evaluated by using automated digital image correlation utilizing MATLAB-based software package (MathWorks, Natick, Massachusetts).Reference Rathmayr, Bachmaier and Pippan33 The strength of the material was measured in terms of the ultimate tensile strength, and the proportional limit stress, representing the stress at a plastic strain of 0.2%, which is defined as the yield strength in this work. As a measure of ductility, the uniform elongation and the reduction in area at fracture were obtained. Additionally, the elongation at fracture was determined. The true strain was calculated using the natural logarithm of the ratio of the instantaneous gauge length to the original gauge length. The true stress was calculated on the basis of the instantaneous cross-sectional area. From true stress–strain curves, the strain hardening exponent and the strength coefficient according to ASTM 64639 were determined. Only those data points in the steady-state plastic flow regime (after yielding but before necking of the specimen) were used. Morphologies of the fracture surfaces were observed by scanning electron microscopy (SEM; LEO 1525, Zeiss, Oberkochen, Germany).
TEM investigations were performed using a TEM/STEM with a cold field emission gun (JEM-ARM 200F, JEOL, Japan) and a JEOL JEM 2011 instrument, both operated at an accelerating voltage of 200 kV. The JEM-ARM 200F was equipped with a STEM Cs corrector (CEOS GmbH, Heidelberg, Germany). To record high-resolution electron energy loss spectroscopy (EELS) maps, a post-column EELS spectrometer (GIF QuantumER™, Gatan, Pleasanton, California) was used. The EELS measurements were carried out with a beam current of 530 pA, a collection semi-angle of 10.4 mrad, a spectrometer entrance aperture of 2.5 mm, and an energy dispersion of 0.25 eV/ch. A drift correction was applied to enhance the image quality. The TEM sample preparation included the following steps: a disk was cut at a radius of 2.5 mm (equivalent strain ∼380), mechanically thinned and polished to a thickness of about 100 μm. Then, mechanical dimpling until the thinnest part reached a thickness of about 10 μm was done. Next, the TEM sample was ion-milled with Ar ions using a Gatan Precision Ion Polishing System (Gatan, Pleasanton, California).
III. RESULTS
A. In situ annealing response and isothermal annealing treatments
The influence of annealing on the microstructural evolution of the as-deformed Cu–26 at.% Co alloy samples was measured by synchrotron HEXRD in situ annealing measurements (Fig. 1). Only peaks of the fcc Cu phase were visible at the lowest temperature. According to the HEXRD data, no phase changes were observed until ∼200 °C. At higher temperatures, the peaks continuously shifted to higher d-spacing. Simultaneously, the intensity distribution broadened. At 600 °C, the shift was quite pronounced, and a wide intensity distribution was visible. In the corresponding in situ HEXRD pattern, the fcc Co phase was detected at 400 °C, while both fcc and hcp Co phases were visible at 600 °C, indicating the decomposition of the single-phase structure. In accordance with the HEXRD data, the annealing temperatures were chosen as follows: 150 °C (no decomposition), 400 °C (beginning of decomposition, different annealing times to obtain different microstructural states), and 600 °C (well-advanced decomposition).
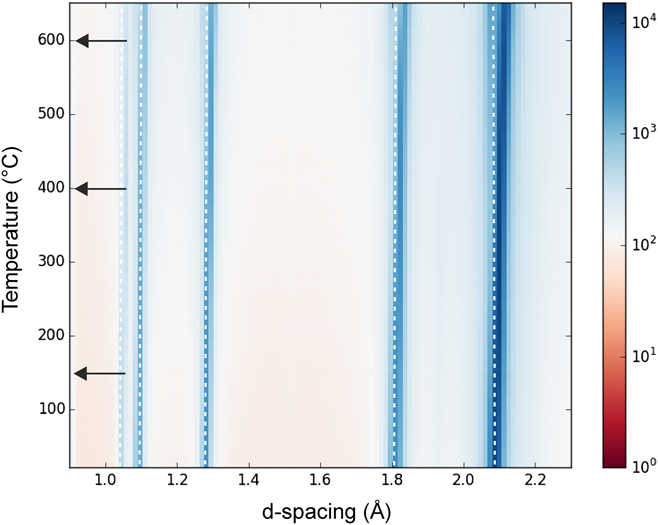
FIG. 1. Synchrotron HEXRD in situ annealing measurements of the as-deformed Cu–26 at.% Co alloy. The white dashed lines mark the highest intensity of each peak at the lowest temperature, and they are only intended as a guide to mark changes in peak positions. Selected isothermal annealing temperatures are marked by black arrows.
Figure 2 shows HEXRD patterns after deformation and subsequent annealing at these different isothermal annealing temperatures and times (marked by black arrows in Fig. 1). A single-phase solid solution with an fcc structure is visible in the as-deformed state and at 150 °C (annealing time 1 h). The peak positions are nearly unchanged in Figs. 2(a) and 2(b). Lattice parameters determined from the 111 peak position are 0.36092 nm and 0.36093 nm for the as-deformed and sample annealed at 150 °C, respectively. After annealing at 400 °C, the Cu peaks shifted to higher d-values with increasing annealing time, resulting in Cu lattice parameters of 0.36140 nm (1 h), 0.36146 nm (7 h), and 0.36154 nm (100 h). After annealing for 7 and 100 h, shoulders on the left side of the Cu peaks were detected in the HEXRD pattern, indicating the presence of fcc Co. Additionally, two weak hcp Co peaks became visible after annealing at 400 °C for 100 h. After annealing at 600 °C for 1 h, the fcc Co phase was clearly evident, and the two hcp Co peaks became clearly visible in the HEXRD pattern.
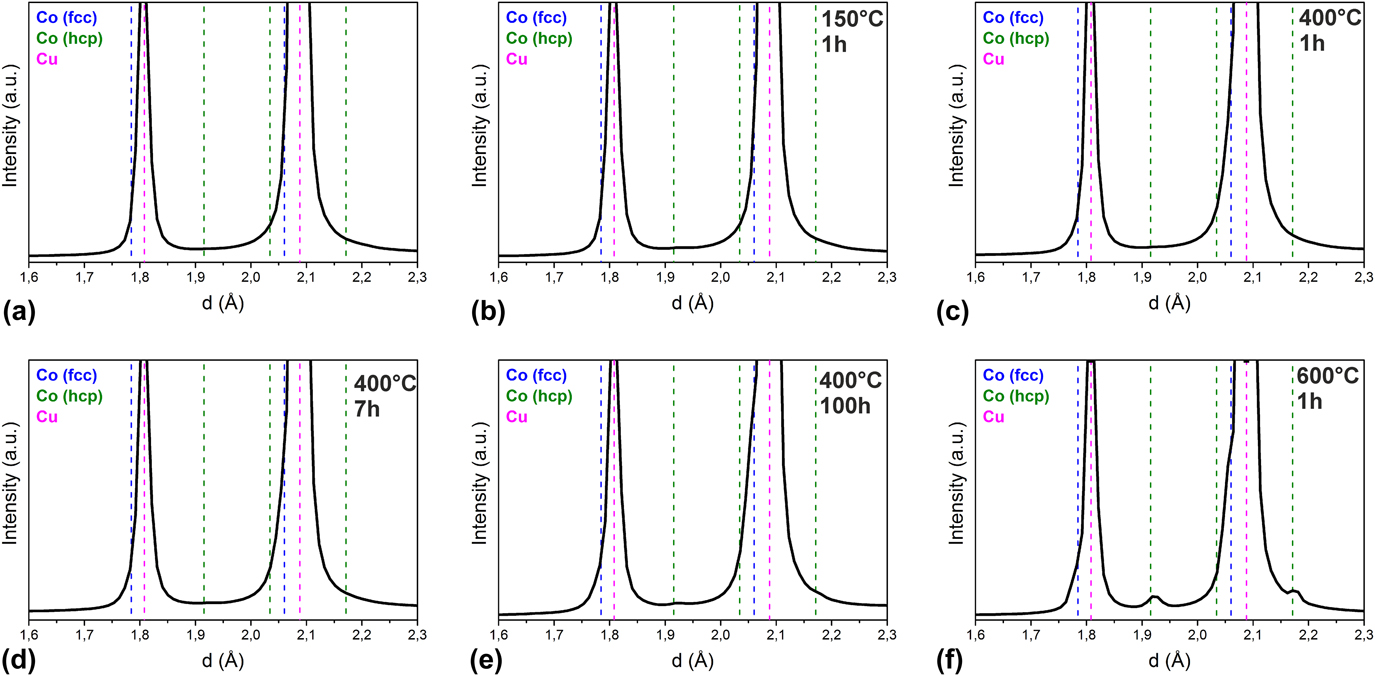
FIG. 2. HEXRD patterns of the Cu–26 at.% Co alloy in the (a) as-deformed and annealed states: (b) 150 °C for 1 h, (c) 400 °C for 1 h, (d) 400 °C for 7 h, (e) 400 °C for 100 h, and (f) 600 °C for 1 h. Peak positions of fcc Co (blue dashed lines), hcp Co (green dashed lines), and Cu (pink dashed lines) are indicated in the plots.
B. Impact on mechanical properties
Tensile tests were performed to determine the influence of the different microstructural states on the mechanical properties of the Cu–26 at.% Co alloy. Characteristic engineering stress–strain curves of the as-deformed and annealed states are shown in Fig. 3(a). Mechanical properties determined from the stress–strain curves of all the tested samples are summarized in Fig. 4. The sample of the as-deformed state (curve 1) and the sample that was annealed at low temperature (150 °C, curve 2) show a similar stress–strain behavior with significant post-necking elongation. Both states further exhibit similar yield and ultimate tensile strengths as well as uniform elongations (Fig. 4). Annealing at 400 °C for different annealing times [curves 3–5 in Fig. 3(a)] led to an increase in the yield and ultimate tensile strengths, with the greatest increase achieved for the samples annealed at 400 °C for 7 h. Simultaneously, the uniform elongation slightly decreased. The yield strength of the sample annealed at 400 °C for 7 h was 956 ± 6 MPa with an ultimate tensile strength of 1019 ± 3 MPa. In addition, a high tensile ductility was still preserved amounting to 4.5 ± 0.2% elongation at fracture. Annealing at 600 °C clearly lowered the yield and ultimate tensile strengths, without a significant change in uniform elongation and elongation to fracture [curve 6 in Fig. 3(a)]. Figure 3(b) shows two characteristic true stress–strain curves of specimens of the as-deformed state and after annealing at 400 °C for 7 h. In the inset of Fig. 3(b), the true stress–strain curves are plotted on logarithmic scale. The majority of the true stress–strain curves fall onto two straight lines in the logarithmic plot. The first line represents the elastic portion of the stress–strain curve. The second line (red) depicts the plastic region of the curve where strain hardening occurs. In the examples shown in Fig. 3(b), linear regression of the plastic region of the curve gives a strain hardening exponent n = 0.2313, a Log10 K = 3.3832, with a R 2 of 0.95 for the as-deformed state and a n = 0.2064, a Log10 K = 3.4003 with a R 2 of 0.93 for the specimen annealed at 400 °C for 7 h. In Fig. 4(d), strain hardening exponents are plotted determined from the logarithmic plots of the true stress–strain curves of all tested states. The strain hardening coefficient of the as-deformed state is highest, with slightly lower but quite similar values for the annealed samples.
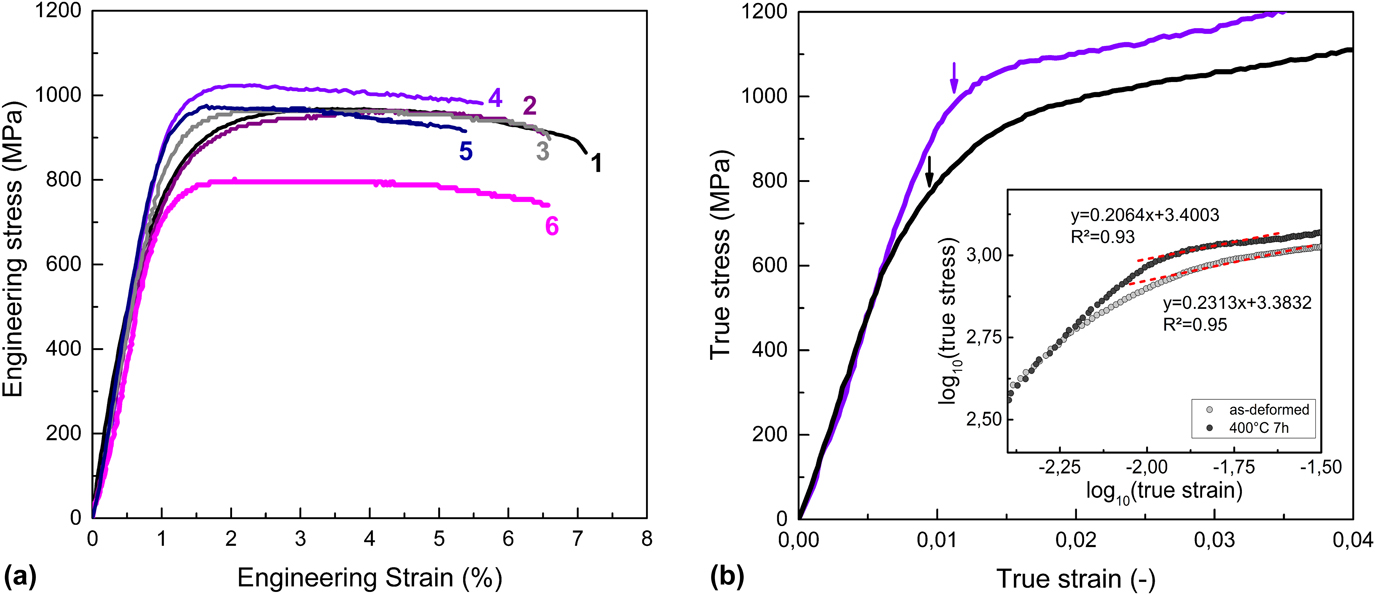
FIG. 3. (a) Engineering stress–strain curves of the Cu–26 at.% Co alloy in the as-deformed (curve 1) and annealed states: 150 °C for 1 h (curve 2), 400 °C for 1 h (curve 3), 400 °C for 7 h (curve 4), 400 °C for 100 h (curve 5), and 600 °C for 1 h (curve 6). All the specimens are tested at a constant strain rate of 1.0 × 10⁻³ s. (b) True stress–strain curves of the as-deformed and at 400 °C for 7 h annealed Cu–26 at.% Co alloy. The yield point is indicated by the arrows. The inset shows the true stress–strain curves plotted on logarithmic scale for the determination of the strain hardening exponent and strength coefficient K. R 2 represents the correlation coefficient of the linear fits.

FIG. 4. (a) Yield strength (filled symbols) and ultimate tensile strength (open symbols) as well as (b) uniform elongation (filled symbols) and elongation to fracture (open symbols) of the Cu–26 at.% Co alloy in the as-deformed (labeled “1”) and annealed states: 150 °C for 1 h (“2”), 400 °C for 1 h (“3”), 400 °C for 7 h (“4”), 400 °C for 100 h (“5”), and 600 °C for 1 h (“6”). (c) Reduction in area and (d) strain hardening exponent n of all tested states.
All tested tensile specimens exhibited ductile fracture with a reduction in area ranging between 16 and 20% [Fig. 4(c)]. Figure 5 depicts the fracture surfaces of the specimens of the as-deformed and annealed states. The micrographs show microductile fracture surfaces with dimpled structures. No brittle fracture features were found anywhere on the studied surfaces. The SEM micrographs of the as-deformed sample and the sample annealed at 150 °C for 1 h [Figs. 5(a) and 5(b)] reveal some larger dimples with a size up to 500 nm surrounded by a smaller sized dimpled surface structure. In some of the larger dimples, inclusions are seen [as indicated by white arrows in Figs. 5(a) and 5(b)]. The specimens annealed at 400 °C also show a complete ductile fracture behavior independent of the annealing time [Figs. 5(c)–5(e)]. The micrograph of the fracture surface of the sample annealed at 600 °C, which is quite similar with larger and smaller dimples visible, is taken at a lower magnification [Fig. 5(f)]. Both types of dimple structures have a larger size compared to the ones observed on the other fracture surfaces.

FIG. 5. Fracture surfaces of the Cu–26 at.% Co alloy: (a) as-deformed state, (b) 150 °C for 1 h, annealed at 400 °C for (c) 1 h, for (d) 7 h and for (e) 100 h, and (f) 600 °C 1 h. The magnification was the same for all micrographs.
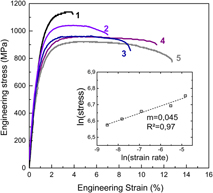
To study the effect of the strain rate on mechanical properties, the as-deformed Cu–26 at.% Co alloy was tested at different strain rates. Figure 6 shows the corresponding engineering stress–strain curves. The yield strength increased with the increasing strain rate. Furthermore, the ultimate tensile strength increased from 920 to 1140 MPa at a strain rate of 2.0 × 10⁻⁴ s−1 to the highest strain rate of 8.0 × 10⁻³ s−1, respectively. At the same time, the elongation to fracture reduced considerably. Figure 7 shows the fracture surfaces of the as-deformed Cu–26 at.% Co alloy sample deformed at the lowest and the highest strain rate. These samples generally showed ductile fracture with a dimpled structure, whereby the size of the dimples decreased with the increasing strain rate. The dimple size at a strain rate of 2.0 × 10⁻⁴ s−1 [Fig. 7(a)] varied from very small ones with a size of about 100 nm to values well above 500 nm. At the highest strain rate of 8.0 × 10⁻³ s−1, dimple sizes were significantly reduced [Fig. 7(b)], and their size is more uniform at the highest strain rate.
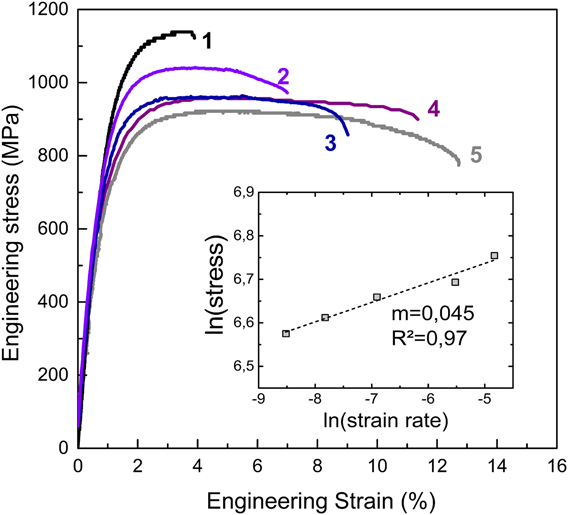
FIG. 6. Engineering stress–strain curves for the Cu–26 at.% Co alloy tested at different strain rates: 8.0 × 10⁻³ s−1 (curve 1), 4.0 × 10⁻³ s−1 (curve 2), 1.0 × 10⁻³ s−1 (curve 3), 4.0 × 10⁻⁴ s−1 (curve 4), and 2.0 × 10⁻⁴ s−1 (curve 5). The inset shows flow stress at 0.2% plastic strain as a function of strain rate plotted on logarithmic scale used to determine strain rate sensitivity m. R 2 represents the correlation coefficient of the linear fit.

FIG. 7. Fracture surfaces of the Cu–26 at.% Co alloy tested at different strain rates: (a) 2.0 × 10⁻⁴ s−1 and (b) 8.0 × 10⁻³ s−1. Please note that the magnification is not the same in both micrographs.
The underlying plastic deformation process can be revealed by investigating the strain rate sensitivity m and the activation volume V* of a material.Reference Taylor40 The m value, written in terms of the activation volume V*, can be calculated byReference Asaro and Suresh41
 $$m = {{\sqrt 3 kT} \over {{V^ * }\sigma }}\quad ,$$
with k being the Boltzmann’s constant, T being the absolute temperature, and σ being the flow stress. The strain rate sensitivity can be calculated as the change in the natural logarithmic uniaxial flow stress (σ) obtained from true stress–strain curves divided by the change in the natural logarithmic strain rate  $\left( {\dot{\varepsilon }} \right)$ as measured in uniaxial tension,Reference Hart42
 $$m = \left( {{{\partial \ln \sigma } \over {\partial \ln \dot{\varepsilon }}}} \right)\quad .$$
The inset of Fig. 6 shows the logarithmic plot of the flow stress as a function of strain rate used to determine strain rate sensitivity m of the as-deformed state. The as-deformed sample exhibited an enhanced strain rate sensitivity, m, of 0.045 with an R 2 of 0.96 of the linear fit.
IV. DISCUSSION
The as-deformed and annealed Cu–26 at.% Co alloy samples exhibited an extremely high tensile strength with yield strength and ultimate tensile strength values between 795–956 MPa and 965–1020 MPa, respectively. In Ref. Reference Krämer, Wurster and Pippan43, the tensile properties of pure HPT deformed bulk Cu and powder Cu are investigated. The tensile yield strength is 480 MPa for HPT-deformed bulk Cu and 630 MPa for HPT-deformed powder Cu.Reference Krämer, Wurster and Pippan43 In Ref. Reference Cheng, Ma, Wang, Kecskes, Youssef, Koch, Trociewitz and Han44, the tensile yield strengths of various nanocrystalline Cu samples (grain size <100 nm) processed by different methods are summarized, which range between ∼150 and 760 MPa. Compared to these values, the Cu–26 at.% Co alloy samples studied by us exhibit higher yield strengths than all reported Cu samples despite the larger grain size.
Even a HPT and cold-rolling–processed Cu–30 wt% Zn alloy sample with a grain size below 20 nm exhibits a factor of 1.4 smaller yield strength of 690 MPa.Reference Zhao, Liao, Horita, Langdon and Zhu22 The high strength of the Cu–26 at.% Co alloy samples is further combined with a good tensile ductility. In the as-deformed state, for example, a uniform elongation of 3.0% with an elongation at fracture of 7.3% was obtained. Only annealing at the highest temperature (600 °C) has a clear effect on decreasing strength but not degrading the tensile ductility significantly (Figs. 3 and 4).
The microstructural characterization by HEXRD revealed that the Cu–Co alloy was composed of a single-phase fcc solid solution in the as-deformed state and at low annealing temperatures even on a large microstructural length scale (Figs. 1 and 2). Using APT, it was shown that decomposition occurred at 400 °C, combined with the formation of a nanoscale composite structure consisting of compositional modulated grains next to pure Co and Cu particles.Reference Bachmaier, Pfaff, Stolpe, Aboulfadl and Motz14 The HEXRD measurements furthermore confirm that these nanoscale composite structures consisted only of fcc Cu and fcc Co, while the equilibrium hcp Co phase has not being detected in the HEXRD patterns except after annealing for 100 h at 400 °C and at the highest annealing temperature of 600 °C.
Plasticity is still dislocation-mediated in the Cu–26 at.% Co alloy since the transition in the deformation mechanism from lattice dislocation activities to grain boundary-mediated processes occurs in (pure) Cu at a much lower grain size (<15–20 nmReference Schiotz and Jacobsen45,Reference Van Swygenhoven, Spaczer and Caro46 ). In the as-deformed condition, one contribution to strength results from the small grain size and the grain boundaries acting as barriers for dislocation motion (Hall–Petch strengtheningReference Hansen47). Highly distorted interfaces containing a large number of dislocations in the as-deformed condition and solid-solution hardening, the solutes building up short-range obstacles to dislocation motion, are additional contributions to the strength.Reference Nazarov, Romanov and Valiev48–Reference Labusch51 Based on Vegard’s law,Reference Vegard52 the unit cell parameters of a solid solution should change linearly based on its composition. According to the lattice parameter shift determined from the HEXRD pattern shown in Fig. 2(a), about 15.0 at.% Co are dissolved in Cu in the as-deformed state. This value is lower than the local compositions determined by APT.Reference Bachmaier, Pfaff, Stolpe, Aboulfadl and Motz14 As already proposed in Ref. Reference Bachmaier, Pfaff, Stolpe, Aboulfadl and Motz14, the Co concentration might somewhat differ from grain to grain, which can lead to the observed differences between APT (atomic-scale chemical analysis) and HEXRD (probing a large volume). The Fleischer and the Labusch model of solid solution hardening further predict only a small strengthening effect due to dissolved Co atoms in Cu–Co alloys.Reference Fleischer50,Reference Labusch51 Using the Labusch model, a maximum of about 170 MPa at 26 at.% Co in Cu (the nominal composition of the alloy) would be achievable in the present alloy, provided that all Co is dissolved in Cu. For 15% Co in Cu as determined from HEXRD measurements, the strengthening contribution due to solid solution hardening is about 120 MPa.
APT investigations have further shown that the forced solid solution is not completely homogeneous inside the Cu grains.Reference Bachmaier, Krenn, Knoll, Aboulfadl and Pippan18 Co is still enriched in nm-sized clusters with sizes of a few nm to a maximum size of 18 nm in the as-deformed state. These Co clusters or particles further retain an fcc structure in the Cu matrix. Small coherent particles significantly increase the yield strength by acting as a barrier for dislocation motion.Reference Dieter53 Once the yield strength is reached, dislocations can glide through these small particles by shearing or cutting them. The critical diameter of a coherent Co particle in a Cu–Co alloy that can no longer be sheared through by dislocations is about 25–35 nm, calculated using the equation of Friedel,Reference Friedel and Argon54 with a shear modulus of 48 GPa, a burgers vector b = 0.255 nm (both for Cu), and with an interfacial energy of coherent Co precipitates in Cu of 230 mJ/m2 or 180 mJ/m2, respectively.Reference Martin, Martin, Doherty and Cantor55 Thus, most of the small Co particles in the as-deformed state can be considered as shearable. The shear stress required for dislocation motion in the presence of small, coherent Co particles further increases with increasing size.
During annealing, a significant decrease in the dislocation density within the grains due to the large number of dislocation sinks (grain boundaries) together with a relaxation of the boundary structure into a more equilibrium-like structure occurs.Reference Oberdorfer, Setman, Steyskal, Hohenwarter, Sprengel, Zehetbauer, Pippan and Würschum56 Deformation of an annealed microstructure thus requires the activation of dislocation sources to realize the plastic strain. Such a dislocation source hardening mechanism has been proposed to cause additional strengthening in nanocrystalline metals after annealing since dislocation emission from grain boundaries in the annealed alloy is impeded due to the recovery process described above.Reference Ma, Shen and Wu23,Reference Huang, Hansen and Tsuji57 As a consequence, higher stress levels to initiate plastic deformation of the annealed microstructures compared to the as-deformed sample should be needed. According to the lattice parameter shift determined from the HEXRD pattern shown in Figs. 2(a) and 2(b), nearly the same amount (about 15.0 at.% Co) are dissolved in Cu in the as-deformed state and after annealing at 150 °C, respectively. From DSC measurements, it is further known that recovery processes indicated by small heat releases already start at low annealing temperatures in the as-deformed Cu–26 at.% Co alloy.Reference Bachmaier, Pfaff, Stolpe, Aboulfadl and Motz14 There is, however, nearly no increase in yield strength between the as-deformed and at 150 °C annealed sample detected [Fig. 4(a)]. Since the contribution from solid solution hardening should be similar and is further quite small (a maximum of 170 MPa if all Co is dissolved in Cu), it can be concluded that the high strength of the as-deformed Cu–26 at.% Co alloy is mainly governed by grain boundary strengthening. In Ref. Reference Tschopp, Murdoch, Kecskes and Darling58, a Hall–Petch plot of multiple nanocrystalline pure Cu samples is given. The obtained yield strengths in our studied single-phase Cu–26 at.% Co alloy are, however, slightly higher than that predicted by Hall–Petch hardening alone (see Fig. 8 in Ref. Reference Tschopp, Murdoch, Kecskes and Darling58). In the study of Medvedeva et al.,Reference Medvedeva, Murthy, Richards, Van Aken and Medvedeva59 negative interfacial Co segregation energies have been calculated by ab initio density-functional calculations. Co might segregate to grain boundaries in the Cu–26 at.% Co alloy resulting in a higher yield strength and hence, an enhanced Hall–Petch coefficient by suppressing dislocation emission from the boundaries, pinning them or hindering relaxation of the dislocation at the boundaries.Reference Ma, Shen and Wu23,Reference Valiev, Enikeev, Murashkin, Kazykhanov and Sauvage60,Reference Tang, Gianola, Moody, Hemker and Cairney61
From APT investigations, it is further known that the phase separation process in the Cu–Co alloy proceeds by a fine scaled spinodal-type decomposition in the grain interior at 400 °C.Reference Bachmaier, Pfaff, Stolpe, Aboulfadl and Motz14 Different strengthening mechanisms due to spinodal decomposition have been proposed in the literature.Reference Cahn27–Reference Carpenter31 Kato et al.Reference Kato, Mori and Schwartz30 considered the origin of strengthening to be internal stress caused by the composition fluctuations and the increase in yield strength can be calculated by
 $$\Delta \sigma = {1 \over {\sqrt 6 }}A\eta G\quad .$$
Here, A is the amplitude of the concentration fluctuation (determined from APT investigations in Ref. Reference Bachmaier, Krenn, Knoll, Aboulfadl and Pippan18), η is the mismatch in the lattice parameter of Cu–Co, and G is taken as the shear modulus of Cu. Equation (3) estimates an additional increase in a yield strength of ∼50 MPa (1 h annealing at 400 °C), ∼110 MPa (7 h annealing at 400 °C), and ∼290 MPa (100 h annealing at 400 °C). The experimentally observed difference in yield strength between the as-deformed and annealed specimens, however, displays no linear dependence of ∆σ on Aη. The yield strength increase of the sample annealed at 400 °C for 7 h is higher, and the yield strength increase of the sample annealed at 400 °C for 100 h is, however, significantly lower than that predicted by the theory.
Thus, the strength after annealing for 7 h might arise from additional factors besides spinodal decomposition. In Fig. 8, a TEM bright-field image of the microstructure after annealing and EELS Co maps of the Cu–26 at.% Co alloy sample after annealing for 7 h at 400 °C are displayed. Large grains and smaller regions with a considerably higher and lower Co or Cu concentration are visible. From the areas marked by the dashed lines, the relative concentration is measured by EELS analysis: area 1 in Fig. 8(b) contains 100% Cu, area 2 is a Co-rich region with 19.8% Cu 80.2% Co, and area 3 is a mixed region containing 75.6% Cu 24.4% Co. Similar relative concentrations (area 4: 74.4% Cu and 25.6% Co, area 5: 40.6% Cu and 59.4% Co, area 6: 100% Cu) are obtained in Fig. 8(c). The microstructure thus contains a range of different features: large mixed grains and smaller pure Cu grains with Co particles inside and near grain boundaries. APT investigations have further shown that the Cu and Co particles are pure in composition and that their size grows with increasing annealing time.Reference Bachmaier, Pfaff, Stolpe, Aboulfadl and Motz14,Reference Bachmaier, Krenn, Knoll, Aboulfadl and Pippan18 These Co particles may have coherent or incoherent interfaces with the Cu matrix phase, depending on their size. Particles visible in the EELS maps in Fig. 8 have a size larger than that calculated according to FriedelReference Friedel and Argon54 and might be considered as nonshearable. Thus, they force dislocations to move around them, which is the classical Orowan hardening mechanism.Reference Dieter53 These Co particles also initiate, drag, and pin dislocations, finally leaving dislocation loops around the particles, which increase the dislocation density, promote the accumulation of dislocations, and permit the occurrence of some strain hardening [Fig. 4(d)].

FIG. 8. (a) TEM bright-field image of the microstructure after annealing for 7 h at 400 °C. EELS Co maps: (b) Size of map: 80 × 80 nm2. The TEM foil-thickness in the area mapped by EELS is measured by the log-ratio technique. An average thickness of 0.69 ± 0.19 nm is determined. (c) Size of map: 125 × 150 nm2, average thickness 0.56 ± 0.31 nm.
After annealing at 400 °C for 100 h, the formation of larger Cu grains is additionally observed in the microstructure.Reference Bachmaier, Pfaff, Stolpe, Aboulfadl and Motz14 Second, there are a number of larger Co and Cu particles (∼50–100 nm) visible in the EELS maps as displayed in Ref. Reference Bachmaier, Pfaff, Stolpe, Aboulfadl and Motz14. These large particles do not contribute to strength by Orowan hardening since they are not located inside the grains and even have a comparable size to the spinodally decomposed Cu grains. However, both, the small Cu and Co grains, contribute to strengthening through a rule of mixture hardening and the increased number of interphase boundaries. After annealing at 600 °C for 1 h, further grain growth and phase separation occurs,Reference Bachmaier, Pfaff, Stolpe, Aboulfadl and Motz14 significantly reducing the strength of the Cu–26 at.% Co alloy.
Considering all observed different microstructural states and their related strengthening mechanism, even greater differences in strength between the as-deformed and annealed Cu–26 at.% Co alloy might be expected. Neither spinodal decomposition nor Co clusters or Cu or Co particles at a later annealing state lead to a dramatic strengthening effect [Fig. 4(a)] and grain boundary strengthening seems to be the main mechanism governing the high strength. This may also be due to the fact that the strength level in the studied Cu–26 at.% Co alloys is already at a very high level and the differences in strength due to the various strengthening mechanisms might not be as clear as, for example, by precipitation hardening in an age-hardenable Al-alloy with much lower initial strength level.
That plastic deformation is dominated by dislocation activities, which is further shown by the ductile fracture of all tested samples. Independent of the microstructural state, all samples exhibited necking and ductile fracture behavior (Fig. 5). A low strain-hardening rate is the main reason for the low ductility of nanocrystalline or ultrafine grained metals.Reference Ma24–Reference Zhao, Zhu and Lavernia26 In the as-deformed (and all annealed) states of the Cu–26 at.% Co alloy, the strength clearly increases with strain, i.e., strain hardening occurs [see Fig. 3(b)]. Thus, all microstructural features present further facilitate strain hardening as the strain hardening coefficient is not significantly altered between the different investigated states [Fig. 4(d)]. The strain hardening coefficients obtained are slightly higher than those obtained for pure Cu with similar grain sizes but still lower than the value of ultrafine grained Cu (n ∼ 0.26, grain size ∼500 nm) and coarse-grained Cu (n = 0.35).Reference Lu62 The obtained values are, however, quite similar to nanotwinned Cu with about 100 nm twin spacing (n increasing from 0.23 for 100 nm to 0.65 for less than 10 nm twin spacing).Reference Lu62
Additionally, the post-necking elongation is noteworthy large for all tested samples [Fig. 2(a)]. From the Hart’s instability criterion, it is known that an elevated strain rate sensitivity improves the tensile ductility by stabilizing uniform tensile deformation to large strains.Reference Hart42 In fcc metals, such as Cu, Al, Ni, and Au, the strain-rate sensitivity will generally increase with decreasing grain size and with increasing cold work.Reference Cheng, Ma, Wang, Kecskes, Youssef, Koch, Trociewitz and Han44 Also in the as-deformed Cu–26 at.% Co sample, an enhanced strain rate sensitivity is observed leading to an enhanced tensile ductility (see Fig. 6). The obtained strain rate sensitivity value is comparable to pure Cu samples at a similar grain size.Reference Tschopp, Murdoch, Kecskes and Darling58 This further indicates that grain boundary diffusion-mediated deformation mechanisms are not present in the studied Cu–26 at.% Co alloy since m is still much smaller than that expected for the plastic deformation process controlled by grain boundary sliding (m = 0.5Reference Lüthy, White and Sherby63) or Coble creep (m = 1.0Reference Coble64). Since an enhanced strain rate sensitivity primarily retards the onset of necking, a relatively small reduction in area is observed in all samples, even though the fracture surface exhibits dimples and ductile features.
V. CONCLUSIONS
In situ HEXRD and tensile testing were performed to evaluate the microstructure–mechanical property relationships of a nonequilibrium Cu–26 at.% Co alloy processed by HPT and its nanoscale composites formed upon annealing due to phase separation. The results can be summarized as follows:
(1) Annealing of the nanocrystalline supersaturated solid solution Cu–26 at.% Co alloy resulted in decomposition and the formation of a nanoscale composite structure consisting of compositional modulated grains next to pure Co and Cu particles.
(2) Both the as-deformed and annealed Cu–26 at.% Co alloy samples combined high tensile strength with a good ductility and a ductile fracture behavior.
(3) The tensile strength of the as-deformed and annealed samples was not strongly influenced by the different microstructural features but seemed to be dominated by the small grain size, i.e., the Hall–Petch effect.
(4) Other strengthening mechanisms operative after decomposition and phase separation exerted less influence on overall strength since isothermal annealing led only to a moderate increase in the tensile strength.
(5) The high ductility of the as-deformed and annealed samples is attributed to their strain hardening capability in combination with an enhanced strain-rate sensitivity.
ACKNOWLEDGMENTS
Funding of this work has been provided by the European Research Council under ERC Grant Agreement No. 340185 USMS. We further gratefully acknowledge the financial support by the Austrian Science Fund (FWF): J3468-N20. The measurements leading to these results have been performed at P07 at DESY Hamburg (Germany), a member of the Helmholtz Association (HGF), under grant-proposal I-20170215 EC. We gratefully acknowledge the assistance by Dr. Staron and Dr. Erdely. We further thank Dr. Arzt for support through the Leibniz Institute for New Materials, Saarbrücken (Germany).


 Open access