


Introduction
In wireless power transfer systems using thermomechanical conversion schemes, such as those described in Ref. Reference Hoff, Hilario, Jawdat, Baros, Dynys, Mackey, Yakovlev, Andraka, Armijo, Savrun and Rittersdorf1, high-temperature bulk susceptor materials are required to convert electromagnetic radiation to thermal power, which is, in turn, converted to electrical power. These susceptor materials take the form of composites formed from a high thermal conductivity ceramic matrix in combination with a radiation-absorbing additive, such as metal particles or lossy ceramic [Reference Taylor and Finch2]. Here, we examine one such system comprising molybdenum particles supported in an aluminum nitride matrix.
In systems such as those investigated in the present study, in which (i) the loading fraction of the radiation-absorbing additive is below the electrical percolation threshold and (ii) the bulk electrical conductivity of the matrix is negligible, dipole relaxation is the predominant loss mechanism [Reference Kasap3, Reference Fischer4]. When these systems are illuminated with electromagnetic radiation in the 1-GHz to 100-GHz regime, the primary polarization mechanisms enabling dipole formation are interfacial polarization (caused by the time-dependent buildup of charge at the metal–insulator boundary), ionic polarization, and electronic polarization [Reference Kasap3].
One example of how such millimeter-wave susceptor materials might be used in a heat exchanger configuration is depicted in Fig. 1. Here, incident electromagnetic energy, in the form of microwave or millimeter-wave radiation, penetrates the surface of the array of lossy ceramic susceptor tiles and is absorbed and converted to heat within the tile bulk. The heat propagates from the tiles through the metallic back plane and gas tube walls and then into the gas, which serves as the working fluid for a heat engine (e.g., a Stirling engine) [Reference Andraka5]. The heat engine drives a generator, enabling the final conversion step to electrical power.
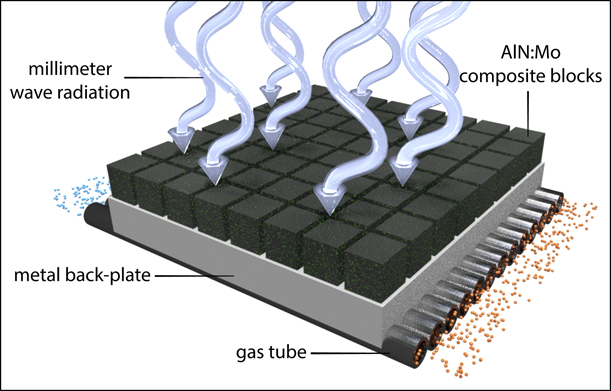
Figure 1: Schematic rendering of a heat exchanger configuration using millimeter-wave susceptor materials.
For ease of system design, the effective dielectric loss of the susceptor composite should be dominated by the additive material. The temperature-dependent dielectric loss of the composite should be as weakly exponential as achievable to limit the likelihood of thermal runaway effects [Reference Parris and Kenkre6, Reference Yakovlev, Allan, Fall, Shulman and Tao7, Reference Gaone, Tilley and Yakovlev8] and to better enable optimization over a wide range of operating temperatures. One material system under investigation for use as a W-band (75–110 GHz) susceptor material is a ceramic composite composed of an aluminum nitride matrix with metallic molybdenum inclusions (AlN:Mo).
The AlN:Mo composite system has several beneficial properties that enhance its viability for employment in applications such as those described earlier. The AlN matrix maintains good thermal conductivity at high temperatures [Reference Savrun9, Reference Hoff, Dynys, Hayden, Grudt, Hilario, Baros and Ostraat10] but is not considered to have the same potential health risks associated with other high thermal conductivity ceramics, in particular, beryllium oxide (BeO) [Reference Balmes, Abraham, Dweik, Fireman, Fontenot, Maier, Muller-Quernheim, Ostiguy, Pepper, Saltini, Schuler, Takaro and Wambach11]. The AlN:Mo system is reported to be stable at high temperatures (≤1000 °C) over a wide range of Mo loading fractions [Reference Khan and Labbe12, Reference Khan and Labbe13, Reference Zhang, Yang, Ma and Du14]. Additionally, AlN and AlN composites are commercially available in bulk quantities and are machinable using standard techniques used for other common ceramics, such as alumina.
To enable the multi-physics modeling [Reference Yakovlev, Allan, Fall, Shulman and Tao7] necessary for design and optimization of the ceramic susceptor tiles to be used in the heat exchanger, key electromagnetic, thermal [Reference Hoff, Dynys, Hayden, Grudt, Hilario, Baros and Ostraat10], and mechanical properties of the susceptor materials must be known at elevated temperatures. The work described herein focuses on the W-band (75–110 GHz) electromagnetic properties of commercially available, hot-pressed AlN:Mo composites in the additive range of 0.25 vol% to 4.0 vol% Mo. AlN:Mo composites with Mo loading in this range have been identified as likely candidate materials for future power beaming experiments by the authors [Reference Hoff, Hilario, Jawdat, Baros, Dynys, Mackey, Yakovlev, Andraka, Armijo, Savrun and Rittersdorf1].
As described in Ref. Reference Yakovlev, Allan, Fall, Shulman and Tao7, multi-physics modeling of ceramic composites in a heat exchanger configuration requires temperature-dependent complex permittivity data (ε′ and ε″) over the temperature range of interest. Here, ε′ is the real portion of the permittivity (also called dielectric constant) and ε″ is the imaginary portion of the permittivity (also called dielectric loss).
Microstructural analysis
Microstructural analysis was performed both on a sample of the Mo powder (additive) provided by the vendor and on a set of AlN:Mo composites with Mo concentrations of 0.25 vol%, 0.5 vol%, 1.0 vol%, 2.0 vol%, 3.0 vol%, and 4.0 vol%. The samples were formed using hot pressing in an inert gas atmosphere at 1900 °C. These are the same ceramic compositions used by the authors in previously published AlN:Mo thermal property studies [Reference Hoff, Dynys, Hayden, Grudt, Hilario, Baros and Ostraat10].
Based on previous X-ray diffraction (XRD) analyses, these hot-pressed AlN:Mo composites are known to have crystalline YAlO2 and Mo2C phases at volume percentages of approximately 6% and 0.5%, respectively [Reference Hoff, Dynys, Hayden, Grudt, Hilario, Baros and Ostraat10]. The YAlO2 phase forms during the sintering process as a byproduct of reactions between Al2O3, present on the surface layer of un-sintered AlN matrix particles, and the sintering aid additive, Y2O3 [Reference Cooper15, Reference Prohaska and Miller16, Reference Jackson, Virkar, More, Dinwiddie and Cutler17] (approximately 5.0 vol%) [Reference Savrun, Nguyen and Gilmore18]. It is also noted that carbon, a common sintering additive [Reference Cooper15, Reference Kurokawa, Utsumi and Takamizawa19] present in the AlN matrix at a loading fraction of 0.5 vol%, was found to react with Mo to form Mo2C in concentration thresholds of approximately 0.5 vol% and independent of increasing Mo concentration [Reference Hoff, Dynys, Hayden, Grudt, Hilario, Baros and Ostraat10]. Beyond this threshold, additional Mo was found to remain in the metallic state.
Microstructural analysis: molybdenum powder additive
XRD analysis indicated that the Mo powder was highly crystalline, with no other materials present [Fig. 2(a)]. Scanning electron microscopy (SEM) images of the Mo powder revealed connected aggregates of roughly spherical particles [Fig. 2(b), insert]. Analysis of Mo powder particle size revealed a log normal distribution with a mean spherical particle size of 1.7 µm [Fig. 2(b)].
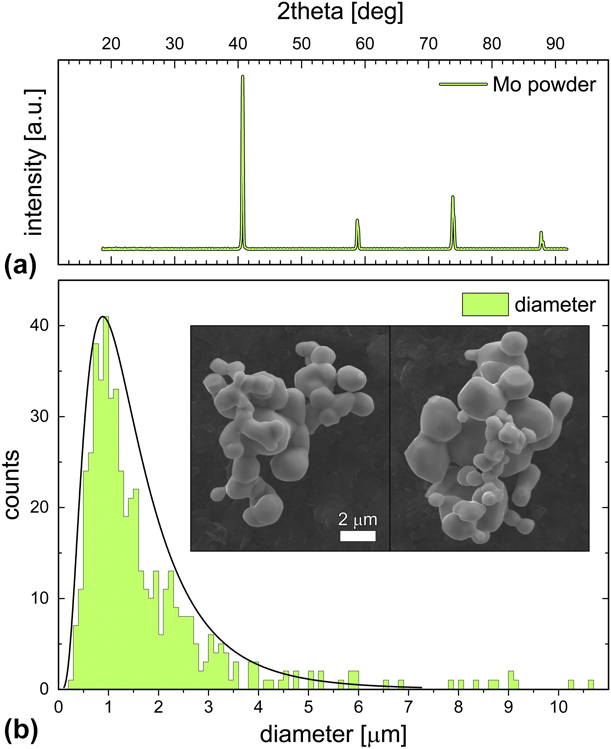
Figure 2: Crystallographic and particle size characterization for Mo powder prior to incorporation into the AlN matrix. (a) XRD indicated highly crystalline Mo with no other crystalline materials detected. (b) Powder aggregates were measured via SEM (inset), and the spherical components of the aggregates were measured to provide the histogram and log-normal distribution curve. The average particle size was determined to be 1.7 μm.
Microstructural and elemental analysis: AlN:Mo ceramic composites
Figure 3 shows representative SEM micrographs acquired using simultaneous acquisition with both a lower (left split) and an upper (right split) electron detector. The left sides of the split panels reveal the surface morphology of the composite materials, whereas the right sides of the panels show the region using a detector that reveals differences in Z# as intensity contrast differences in the micrograph. Here, intensity contrast trends directly with Z# (AlN < Y < Mo); the AlN matrix appears as the darkest pixels in the right-side panels, followed by Y and then Mo, as indicated in Fig. 3.
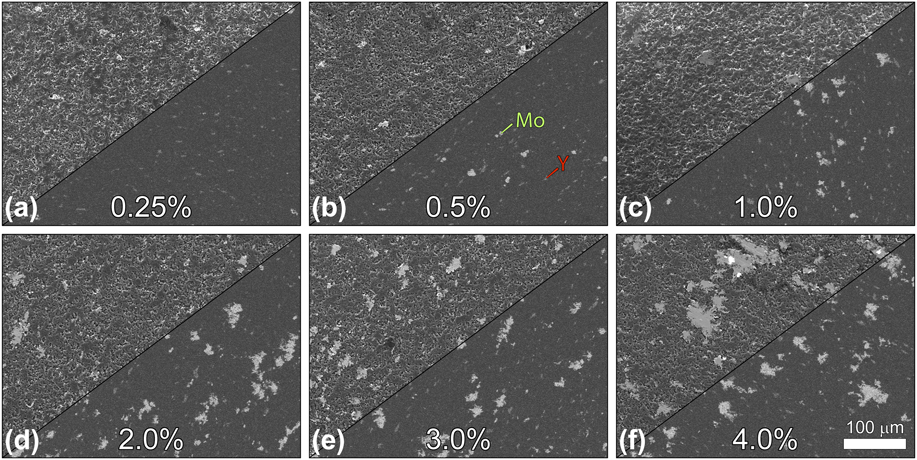
Figure 3: SEM micrographs of AlN:Mo composites with loading percentages (by volume) of (a) 0.25%, (b) 0.5%, (c) 1.0%, (d) 2.0%, (e) 3.0%, and (f) 4.0%. Left split for each loading percentage depicts the region using a detector that is sensitive to topology and atomic weight; right panel splits reveal the region using a detector that has a low sensitivity to topology, allowing differences in Z# to account for the majority of contrast changes across the micrograph. Mo aggregates appear as the brightest pixels in these micrographs, followed by Y and then AlN, as indicated in panel (b).
SEM micrographs of AlN composites with different Mo loadings all showed uneven surface topology with Mo and Y grains distributed throughout the AlN matrix (Fig. 3). The total number of Mo grains increased linearly across the series of Mo loadings (Fig. 4, bars); however, the trend in the grain size distribution within each nominal loading fraction showed a different trend. The pie charts in Fig. 4 show the percent distribution for small (0–1 μm2), medium (1–10 μm2), and large (>10 μm2) molybdenum grains. Whereas the total number of each of these categories increased across the series, the percent composition of small grains grew faster than the percentage of medium and large grains, whose percentages of the total number of grains decreased across the series. The larger rate of growth of the small Mo grain sizes indicates the tendency of the Mo powder to disperse throughout the AlN matrix and presents encouraging results for the prospect of generating similar composites with even higher loading percentages. Studies of AlN:Mo composite systems containing high loading fractions of Mo particle sizes similar to those used in the present study have shown that the expected percolation threshold should be found between 22 vol% and 23 vol% Mo [Reference Khan and Labbe13, Reference Zhang, Yang, Ma and Du14].
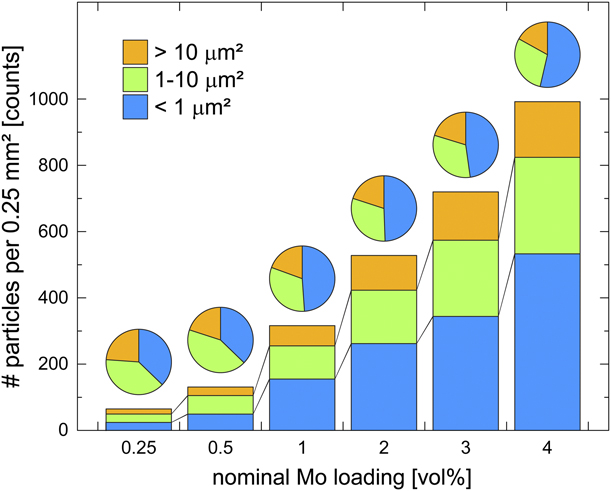
Figure 4: Number of Mo aggregates per 0.25 mm2 of surface area as measured via large-area mapping SEM using a backscatter detector. Aggregate sizes are binned into three size categories: 0–1 μm2, 1–10 μm2, and >10 μm2. Percent composition of each aggregate size domain for each additive loading is represented by the pie charts above each bar. Total number of aggregates increased across the series, but the number of large (>10 μm2) aggregates increased more slowly than the number of small aggregates, leading to a larger percentage of small aggregates in the higher additive concentration regimes.
Elemental composition maps attained via SEM-EDS corroborated the aforementioned dispersion analysis, revealing good dispersion of both Mo and Y aggregates with no notable tendency for the two additive grains to co-localize. Energy-dispersive X-ray spectroscopy (EDS) maps revealed Mo aggregates with very little co-localization of signal from the AlN matrix in their centers, indicating that the majority of each Mo grain retained its purity through the process of incorporation into the AlN matrix. However, the EDS signal for carbon was noted to spike in regions where Mo was present, indicating the presence of at least some Mo2C in these regions and corroborating the XRD results presented previously, which detected crystalline Mo2C via XRD [Reference Hoff, Dynys, Hayden, Grudt, Hilario, Baros and Ostraat10]. Mo2C was formed during the sintering of the composite materials, when carbon present in the matrix reacted with Mo. Carbon is notoriously difficult to resolve via EDS due to issues with poor escape depth and its ubiquitous presence on surfaces. As the beam rasters over the sample surface, graphitizing amorphous carbon on the surface, more carbon migrates in from off-camera, which leads to progressively more noise in the carbon signal over time. As a result, the carbon localization can be difficult to visualize in higher resolution scans such as those presented in Fig. 5. EDS data taken specifically to resolve the carbon signal are presented in the Supplementary material, where co-localization of carbon and Mo aggregates can be more readily visualized.
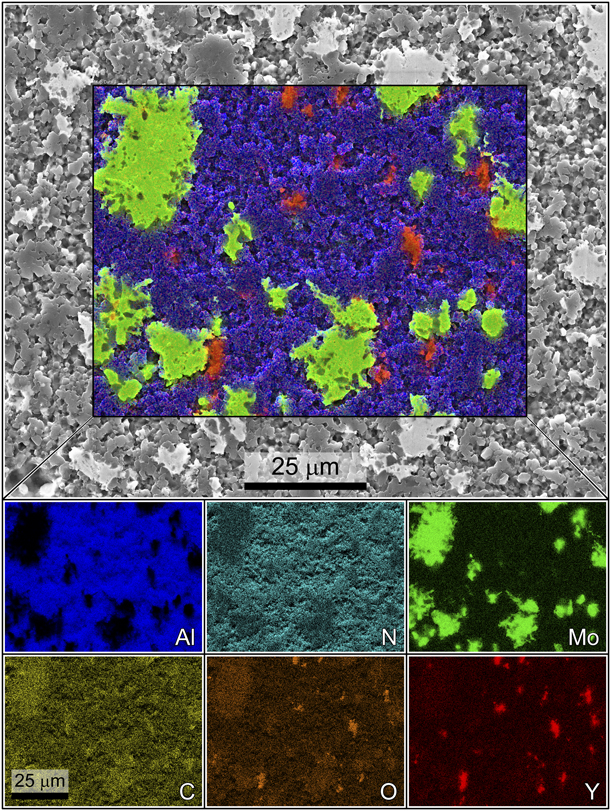
Figure 5: SEM micrograph with elemental composition maps as individual breakout maps by element and as an overlay on the micrograph. Color corresponds to elemental identity as indicated, whereas intensity corresponds to relative concentration for that element. The nitrogen signal is hidden in the overlay for clarity. The carbon signal is artificially inflated by the ubiquitous presence of carbon on surfaces, but some localization is still evident. Lower resolution scans that are more accurate for measuring carbon distribution only are provided in the supplementary material.
Phase refinement of an EDS dataset is presented in Fig. 6(a), where color shading indicates each detected phase region and where the elemental compositions for each of these regions are provided in Fig. 6(b), as indicated. Phase refinement revealed a central grain comprising mostly Mo (yellow) in an AlN matrix. An elemental gradient was observed at the edges of the grain at the interface between Mo and AlN, resolved as discrete regions of progressively decreased molybdenum content and progressively increased AlN content from the aggregate boundary (Fig. 6, yellow to purple to cyan). These finite interfacial zones suggest intermixing of the two phases and will constitute the subject of a more intensive investigation by the authors via transmission electron microscopy. The Y particle resolved in the phase map was largely devoid of AlN signal in its core (Fig. 6, pink), although the region immediately surrounding the yttria particle returned a mixed signal, suggesting the presence of both Y and Al in this interfacial region and corroborating earlier XRD work that resolved the presence of YAlO2 in these composites [Reference Hoff, Dynys, Hayden, Grudt, Hilario, Baros and Ostraat10].
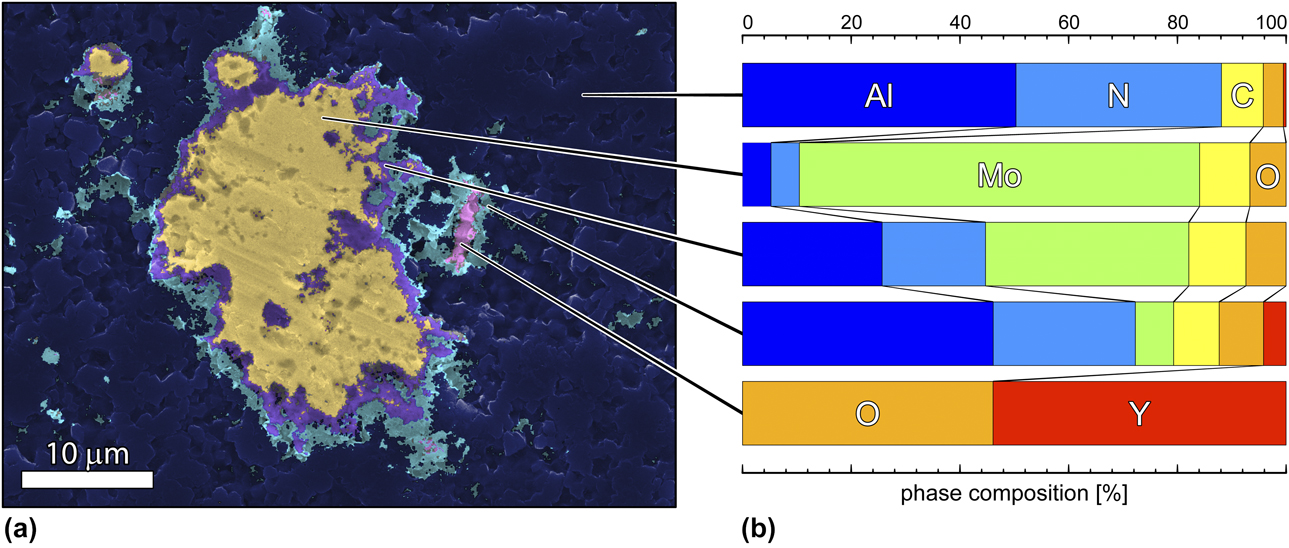
Figure 6: Phase analysis overlain onto an SEM micrograph. (a) The micrograph showing an isolated Mo grain (yellow) and a yttria aggregate (pink) in an aluminum nitride matrix (blue). Detected phase regions are indicated by color. (b) Percent composition for each phase region by element. The edges of the Mo aggregate show evidence of a finite, compositionally mixed region comprising both Mo and AlN (purple and cyan).
Porosity and density examination
Composites of AlN:Mo were prepared for nitrogen physisorption analysis to investigate the extent of internal porosity in AlN composites loaded with Mo at 2 and 3 vol%, and the Brunauer–Emmett–Teller (BET) method was used to determine the apparent surface areas. Negligible N2 uptake was observed, leading to calculated BET surface areas of effectively zero, which indicates the absence of an accessible internal pore network in these composites.
Vendor-provided theoretical density values for the 0.25%, 0.5%, 1.0%, 2.0%, 3.0%, and 4.0% (Mo vol%) samples were 3.31, 3.32, 3.36, 3.43, 3.5, and 3.57 g/cm3, respectively. Based on Archimedes’ density measurements performed previously for these composites [Reference Hoff, Dynys, Hayden, Grudt, Hilario, Baros and Ostraat10], all samples were within 1% of theoretical density.
High-temperature W-band dielectric property analysis
Measurements of complex permittivity at elevated temperatures are generally accomplished using either resonant cavity spectroscopy techniques or the so-called free-space techniques. Resonant cavity spectroscopy involves measurement of frequency and Q-factor perturbations in a resonant cavity mode caused by the presence of a dielectric sample [Reference Ho20, Reference Westphal and Sils21, Reference Calame, Garven, Lobas, Myers, Wood and Abe22]. These perturbation measurements can then be used to calculate the real and imaginary components of permittivity. Modern free-space measurement techniques are typically based on network analysis S-parameter data generated by interacting a probe beam with a flat sheet of sample material [Reference Varadan, Hollinger, Ghodgaonkar and Varadan23, Reference Ho24, Reference Schultz25]. The S-parameter data are then used to calculate the real and imaginary components of permittivity.
Although resonant cavity spectroscopy techniques typically yield measurements with lower uncertainty than free-space techniques [Reference Venkatesh and Raghavan26] (especially for low-loss sample materials), there are several drawbacks to using resonant cavity spectroscopy that make it problematic to use for measurements at W-band frequencies. Because cavity volume and sample size scale with the wavelength used for the measurements, very high-frequency measurements require small sample sizes with specific geometry, potentially making sample preparation difficult [Reference Venkatesh and Raghavan26]. The large, flat material sheets required by free-space techniques are more easily prepared. An additional challenge encountered when using resonant cavity spectroscopy is that heating of the sample, which is in contact with the cavity, requires bringing a portion of the measurement setup to the same temperature as the sample. When using free-space techniques, the sample can be heated in a separated enclosure [Reference Varadan, Hollinger, Ghodgaonkar and Varadan23], provided portions of the enclosure can be made transparent to the probe beam radiation.
Complex permittivity measurements of the AlN:Mo ceramic composites were performed at 95 GHz and at temperatures ranging from 25 to 550 °C using the free-space technique. Complex permittivity, ε*, is defined as shown in Eq. (1).
 $${\varepsilon ^*} = {\varepsilon _0}\left( {{{\varepsilon '}_{\rm{r}}} - {\rm{i}}{{\varepsilon ''}_{\rm{r}}}} \right)\quad ,$$
where ε0 is the permittivity of free space (approximately 8.854 × 10⁻¹² F/m). Relative values of the real portion of the permittivity (dielectric constant) and imaginary portion of the permittivity (dielectric loss) are represented as ε′r and ε″r, respectively. The real and imaginary parts of the relative permittivity are related to the loss tangent of the material, tan δ, by
 $$\tan \;\delta = {{{{\varepsilon ''}_{\rm{r}}}} \over {{{\varepsilon '}_{\rm{r}}}}}\quad .$$
The specific apparatus and data processing methods used for the authors’ complex permittivity measurements are described in detail in Refs. Reference Hilario, Hoff, Jawdat, Lanagan, Cohick, Dynys, Mackey and Gaone27 and Reference Telmer, Hilario, Hoff, Lanagan and Reeja-Jayan28. The samples used for free-space analysis were discs with a diameter of 5.08 cm and thickness of 0.64 cm.
Measured real and imaginary permittivity data for each of the AlN:Mo composite formulations (0.25, 0.5, 1.0, 2.0, 3.0, and 4.0 vol% Mo) are plotted in Fig. 7. The real permittivity for all composites was found to increase by approximately 4% over the 100–500 °C range. The percentage increase in imaginary permittivity was found to be greater (approximately 50%) in the lowest concentration samples (0.25 vol% and 0.5 vol% Mo), compared with approximately 15% in the 4.0 vol% Mo. However, because of the lower starting values of ε″r for the lowest concentration samples, small changes in the dielectric loss of the matrix material occurring at all Mo concentrations would have proportionally greater contributions to changes in the lossyness of the additive [Reference Hilario, Hoff, Jawdat, Lanagan, Cohick, Dynys, Mackey and Gaone27].
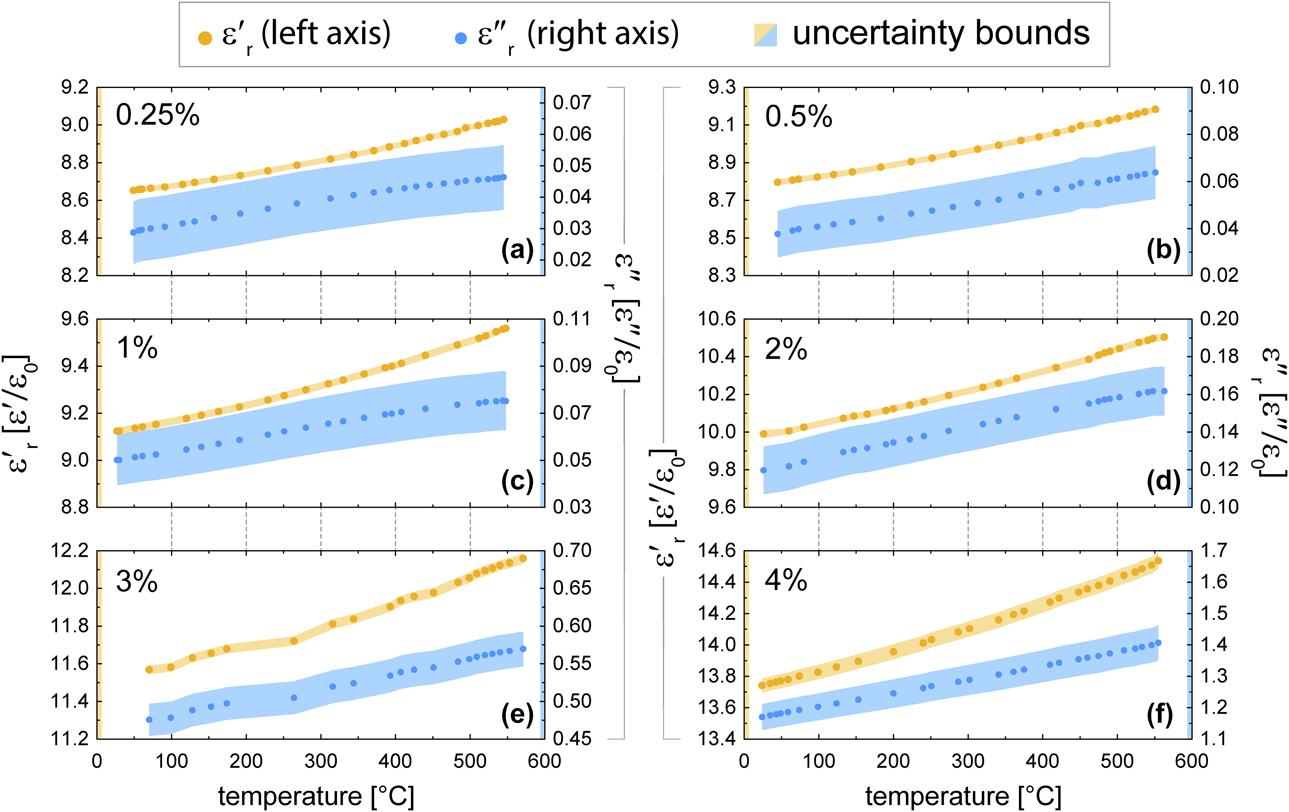
Figure 7: Measured real and imaginary permittivity as a function of temperature for AlN:Mo composite formulations having (a) 0.25 vol%, (b) 0.5 vol%, (c) 1.0 vol%, (d) 2.0 vol%, (e) 3.0 vol%, or (f) 4.0 vol% Mo, as indicated.
Plots of measured real and imaginary permittivity data as a function of Mo concentration are presented in Figs. 8(a) and 8(b), respectively, for temperatures of 100 and 500 °C. Measured values of both real and imaginary permittivity show an exponential dependence on Mo concentration in the evaluated range (0.25 vol% to 4 vol% Mo). Equations for curve fits of the data presented in Fig. 8 are as follows:
 $${{\rm{e'}}_{_{{\rm{r}},100\;^\circ {\rm{C}}}}} \approx 7.49 + 1.06 \times {{\rm{e}}^{\left( {{{{\rm{vol\% }}} \over {2.24}}} \right)}}\quad ,$$
 $${{\rm{e'}}_{_{{\rm{r}},500\;^\circ {\rm{C}}}}} \approx 7.71 + 1.14 \times {{\rm{e}}^{\left( {{{{\rm{vol\% }}} \over {2.26}}} \right)}}\quad ,$$
 $${{\rm{e''}}_{_{{\rm{r}},100\;^\circ {\rm{C}}}}} \approx \left( { - 1.21 + 2.59 \times {{\rm{e}}^{\left( {{{{\rm{vol\% }}} \over {1.04}}} \right)}}} \right) \times 0.01\quad ,$$
 $${{\rm{e''}}_{_{{\rm{r}},500\;^\circ {\rm{C}}}}} \approx \left( { - 0.15 + 2.99 \times {{\rm{e}}^{\left( {{{{\rm{vol\% }}} \over {1.04}}} \right)}}} \right) \times 0.01\quad .$$
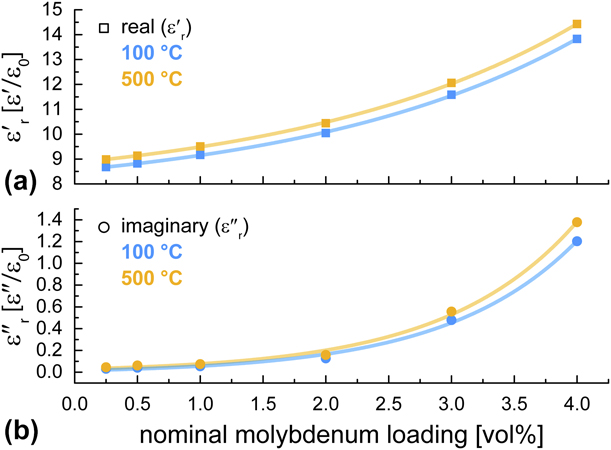
Figure 8: Measured (a) real and (b) imaginary permittivity data as a function of Mo concentration for temperatures of 100 and 500 °C.
The exponential dependence of real and imaginary permittivity on Mo concentration in the evaluated range (0.25 vol% to 4 vol% Mo) enables substantial tunability of the electromagnetic properties of the composite with small changes in composite formulation. An increase in Mo loading from 0.25 vol% to 4 vol% results in an increase in real permittivity of approximately 59% at 100 °C and 60% at 500 °C and an increase in imaginary permittivity of approximately 3785% at 100 °C and 2940% at 500 °C. For the temperature regime evaluated, the temperature-related changes in real and imaginary components of permittivity are relatively modest compared with those driven by Mo loading. For all samples, an increase in temperature from 100 to 500 °C resulted in an increase in real permittivity of approximately 4%. This same temperature increase resulted in increases of imaginary permittivity of 46%, 50%, 38%, 25%, 16%, and 15% for the 0.25 vol%, 0.5 vol%, 1.0 vol%, 2.0 vol%, 3.0 vol%, and 4.0 vol% Mo samples, respectively.
Summary and discussion
To enable the multi-physics modeling [Reference Yakovlev, Allan, Fall, Shulman and Tao7] necessary for design and optimization of the ceramic susceptor tiles to be used in a millimeter-wave powered heat exchanger, key electromagnetic, thermal, and mechanical properties of the susceptor materials must be known at elevated temperatures. As part of the present work, microstructural analysis and bulk dielectric property analysis (real and imaginary permittivity at 95 GHz) were performed for ceramic composites comprising an aluminum nitride matrix with a molybdenum powder additive at temperatures ranging from 25 to 550 °C. Loading percentages over the range of 0.25 vol% to 4.0 vol% Mo were characterized.
For the temperature regime evaluated, the temperature-related changes in real and imaginary components of permittivity were found to be relatively modest compared with those driven by Mo loading. At the lowest Mo concentration (0.25 vol% Mo), the increase from 100 to 500 °C results in a 4% increase in real permittivity and a 46% increase in imaginary permittivity. At the highest Mo concentration (4 vol%), the increase from 100 to 500 °C results in a 4% increase in real permittivity and a 15% increase in imaginary permittivity. Tuning the Mo loading from 0.25 vol% to 4 vol% was found to result in an increase in real permittivity of approximately 59% at 100 °C and 60% at 500 °C and an increase in imaginary permittivity of approximately 3785% at 100 °C and 2940% at 500 °C.
EDS analysis of Mo grains and surrounding regions showed the presence of a mixed-phase layer, containing Mo2C, at the AlN–Mo interface. The Mo2C-containing mixed-phase layer, typically a few micrometers thick, surrounded the Mo grains. It is expected that the electrical conductivity of the layer likely ranges from that of pure Mo2C [Reference Samsonov and Sinel’nikova29] (approximately 1.1 × 10⁶ S/m at 25 °C to 9.1 × 10⁵ S/m at 550 °C) at the Mo grain surface to near-insulating in the AlN bulk. Additional characterization methods, such as conductive atomic force microscopy (AFM), are required to better understand the layer properties and estimate their contributions to the dielectric properties of the composite; however, it is known that in other AlN–carbide systems, such as AlN:SiC, volume fractions on the order of 10% can lead to substantial dielectric loss values.
Methodology
Mo powder was imaged using a JEOL 7100F (JEOL Ltd., Tokyo, Japan) field-emission scanning electron microscope (FE-SEM) following sample preparation by depositing a small amount of powder directly onto the copper tape for imaging. Micrographs of Mo powder were collected at an operating voltage of 15.0 kV and a working distance of 6.0 mm. Mo powder particle diameter measurements were determined using ImageJ software. For crystallinity analysis of Mo powder, XRD was performed using a Bruker D8 Discover diffractometer equipped with a copper tube (l = 0.15418 nm) and a VANTEC-500 2-D detector (Bruker Corporation, Billerica, Massachusetts). XRD spectra were measured with a 2θ range from 25° to 85° in steps of 15° with a collection time of 300 s per step, yielding spectra ranging from 19° to 92° (via the 2D detector). The AlN composites were imaged using a JEOL 7100F SEM equipped with an Oxford X-MAXN 80 detector and AZtec software for energy-dispersive X-ray spectroscopy (EDS), Oxford Instruments, Abingdon, U.K., allowing for elemental composition mapping. Micrographs and elemental composition maps of the AlN composites were collected at an operating voltage of 20.0 kV. EDS data were collected at a working distance of 10.0 mm, and micrographs were collected at a working distance of 4.0 mm using both the lower electron detector and the upper electron detector in the SEM. EDS and phase analysis were performed using Oxford AZtec software. Large-area SEM maps were collected using the Oxford AZtec large area mapping (LAM) feature in combination with the JEOL 7100F microscope. For each Mo loading, a 0.5 × 0.5-mm area was imaged at an operating voltage of 20.0 kV and a working distance of 4.0 mm, using the upper electron detector. Using ImageJ software (National Institute of Health, Bethesda, Maryland), large area maps were smoothed to reduce noise, and then Mo regions within the AlN matrix were identified via thresholding for pixel intensity. The ImageJ Analyze Particles feature was used to determine the number and area of all regions identified as Mo. Because of the limited number of Mo grains present in the 0.25% loading AlN:Mo composite, for this loading percentage, an additional area of 1.5 × 0.5 mm was imaged and used for grain size distribution analysis. For each Mo loading concentration, a minimum of 131 Mo grains were measured for size analysis.
Composites of AlN:Mo were prepared for nitrogen physisorption analysis by degassing under vacuum for 12 h at 350 °C in a Micromeritics Smart VacPrep to investigate the extent of internal porosity in AlN composites loaded with Mo at 2 and 3 vol%. Physisorption measurements were performed at −196 °C on a Micromeritics ASAP 2460 (Micromeritics Instruments, Norcross, Georgia), and the Brunauer–Emmett–Teller (BET) method was used to determine the apparent surface areas.
Supplementary material
To view supplementary material for this article, please visit https://doi.org/10.1557/jmr.2019.177.
Acknowledgments
The authors would like to thank Antonya J. Sanders for help with graphical data representation. B.W. Hoff, M.S. Hilario, and A.E. Baros were funded by the Air Force Office of Scientific Research under FA9550-17RDCOR449 and by the Operational Energy Capability Improvement Fund (OECIF). I. Rittersdorf was supported by OECIF. S.C. Hayden, R.O. Grudt, and M.L. Ostraat were funded by Aramco Services Company. F.W. Dynys was supported by funding provided by the Air Force Research Laboratory. The authors acknowledge helpful discussions with E. Savrun of Sienna Technologies, Inc., and with A. Sayir of the Air Force Office of Scientific Research.


 Open access