


I. INTRODUCTION
Na-based electrochemical cells are raising more interest in both research and industry due to Na abundance and availability. Reference Ghadbeigi, Harada, Lettiere and Sparks1,Reference Ghadbeigi, Sparks, Harada and Lettiere2 To date, sodium beta alumina, Na-β″-alumina, has been identified as the best sodium-ion-conducting electrolyte. The grain size-dependent sodium ion conductivity ranges from 0.2 to 0.35 S/cm for fine and coarse-grained samples, respectively, at 300 °C. Reference Virkar, Miller and Gordon3 The compound Na2O–6.2Al2O3 known as Na-β″-alumina has a rhombohedral structure consisting of three spinel blocks separated by a conduction plane partially filled by mobile sodium ions. The material is useful in a variety of applications. For example, sodium sulfur batteries marketed under the trade name of NAS batteries with a sodium anode and a sulfur cathode utilize beta alumina electrolyte. NGK Inc. (Nagoya, Japan) demonstrated high energy density NAS batteries for load leveling applications. Replacing sulfur with chloride and accepting a planar design has led to the introduction of molten-salt or the so-called ZEBRA batteries (originally named “Zeolite Battery Research Africa” and later termed “Zero Emissions Batteries Research Activity”). Reference Parthasarathy, Weber and Virkar4 Other applications include the alkali metal thermal electric converter which allows for conversion of thermal energy to electrical energy and in the reverse mode, the production of sodium. Reference Weber5
The traditional processing of Na-β″-alumina is reported in early publications. Reference Virkar, Miller and Gordon3,Reference Fredell6 However, the process is cumbersome due to the multiple high-temperature steps required, including encapsulation in Pt crucibles. In addition, the product is vulnerable to moisture and CO2 attack due to the growth of a minority phase of NaAlO2. It is also of low strength due to the exaggerated grain growth. Alternatively, the vapor phase synthesis was developed to circumvent these drawbacks by converting an initial two-phase sintered composite of α-Al2O3 + YSZ into a Na-β″-alumina + YSZ composite. Reference Parthasarathy and Virkar7
The vapor conversion process consists of fabrication of a two-phase sintered composite of α-Al2O3 + YSZ, exposing the composite to a vapor of Na2O by packing the composite in a powder of Na-β″-alumina, and heat treating it at a temperature between ∼1250 and 1400 °C. The composite allows coupled diffusion of Na+ through the Na-β″-alumina and O2− through YSZ, thus facilitating conversion. The process is also applicable to the fabrication of other composites such as sodium zirconium gallate, which showed to be a promising sodium ion conductor as well. Reference Ghadbeigi, Liu, Sparks and Virkar8 In addition, it was shown that alteration of the properties of the vapor phase-synthesized ceramics is possible by doping with aliovalent ions. Reference Ghadbeigi, Szendrei, Moreno, Sparks and Virkar9
The role of YSZ is crucial in the vapor phase process. During the conversion, the condition of electroneutrality necessitates the coupled transport of fluxes of both Na+ and O2− ions in such a way that the flux of Na+ is twice of that of O2−. If the primary sintered pallet is made of only α-Al2O3, the conversion proceeds too slowly. While transport of Na+ is fast in Na-β″-alumina, the O2− diffusion is too sluggish in the Na-β″-alumina. On the other hand, introduction of YSZ in the Na-β″-alumina matrix improves the mechanical properties of the composite as demonstrated by other groups. Reference Viswanathan, Ikuma and Virkar10 Virkar and coworkers achieved strengthening via surface compression by tailoring the ratio of alumina to YSZ or monoclinic zirconia in ceramic membranes. Reference Virkar11–Reference Youngblood and Gordon15 Furthermore, the composite provides an exceptional opportunity to investigate thermodynamics in multicomponent systems. For example, it is possible to use these composites to study the electrochemical properties of the mixed sodium-ion and oxygen ion-conducting membranes.
Anisotropic properties of Na-β″-alumina and Na-β-alumina ceramics were reported previously. Reference Byckalo, Rosenblatt, Lam and Nicholson16 In Na-β-alumina cylindrical samples prepared by slip casting, an anisotropy factor of up to 40 in ionic conductivity was reported by Byckalo et al. Reference Virkar, Tennenhouse and Gordon17 Virkar et al. 18 measured an anisotropy factor of 1.25 in the hot-pressed Na-β″-alumina ceramic with higher resistivity parallel to the pressing direction. Another study by Youngblood and Gordon showed electrical resistivity which is 1.4–1.8 times larger parallel to the hot pressing direction. Reference Byckalo, Rosenblatt, Lam and Nicholson16 However, no previous work has looked at anisotropy that could develop due to the intrinsic stresses that are associated with α-alumina to Na-β″-alumina volume change in the conversion process.
A desirable anisotropy can be advantageous in some applications. For example, texturing in ceramic electrolytes provides higher conductivity and minimizes ohmic resistances. This article aims to characterize the anisotropic properties of Na-β″-alumina + YSZ composites synthesized by the vapor phase method. Parthasarathy and Virkar Reference Parthasarathy and Virkar7 investigated the kinetics of conversion in samples with a range of grain size of 0.53–4.15 µm. In this study, samples with a grain size of 0.81–2.97 µm were made to compare the anisotropy and microstructure evolution in the converted samples with different grain sizes. Microstructure, texturing, and transport properties were measured and compared to the previously reported data in the literature.
II. EXPERIMENTAL PROCEDURE
A powder mixture containing 61 wt% α-alumina (CR-30 Baikowski, Poisy, France) and 39 wt% YSZ (TZ-3Y Tosoh, Tokyo, Japan) was prepared. This provided a targeted volume ratio of 70–30 for Al2O3 to YSZ to prepare a contiguous composite. The powder was wet milled by Fritsch Pulversette planetary milling (Fritsch Co., Idar-Oberstein, Germany), dried over 24 h, and calcined at 500 °C for 1 h. Disks were pressed uniaxially by Carver Inc. (Wabash, Indiana) press at 10 Kpsi (∼69 MPa) followed by isostatic pressing (Autoclave Engineers Model IP4-22-60) at 30 Kpsi (∼207 MPa). Two sets of samples were prepared; sample A disks were sintered at 1500 °C for 3 h and sample B disks were sintered at 1700 °C for 3 h. The sintered disks had a diameter and thickness of about 20 and 1.5 mm, respectively. The density of samples was measured using the Archimedes method. Samples sintered at 1700 °C for 3 h and sintered at 1500 °C for 3 h had the density of 97 and 99% of the theoretical density (4.6 g/cm3), respectively.
The disks were then placed in an alumina crucible, loosely packed in Na-β″-alumina powder containing ∼8.85 wt% Na2O, ∼0.75 wt% Li2O, and balance Al2O3, covered with a lid and then heat treated at 1450 °C in air for 10 h.
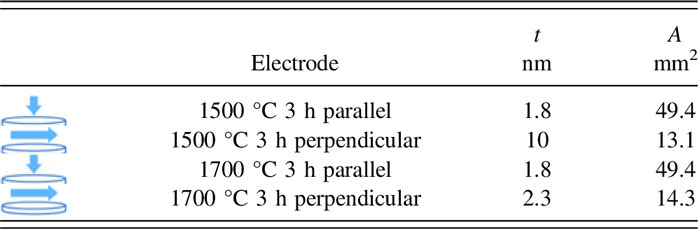
After conversion, the disc surface and cross section of some samples were coarsely polished and thermally etched in air at 100 °C below sintering temperature for one hour. A NOVA NANOSEM 600 scanning electron microscope (resolution of 1 nm at 15 KV and 1.8 nm at 1 KV) was used for microstructural analysis, and the grain size was measured using the linear intercept method. Reference Toby19 X-ray diffraction (XRD) patterns were obtained using Cu Kα radiation on a Bruker D2 Phaser XRD (Bruker Co., Billerica, Massachusetts) to determine the phases present in the as-sintered and converted samples. Rietveld refinement was conducted using the full-pattern Rietveld method based on least-squares refinement using the GSAS EXPGUI Reference Parthasarathy20 software (Los Alamos National Laboratory, Los Alamos, New Mexico) to determine the quantitative phase fraction. The starting models were taken from the Inorganic Crystal Structure Database ICSD code 79197 for YSZ, ICSD code 160604 for Al2O3, and ICSD code 34295 for Na-β″-alumina. A texturing parameter was utilized during Rietveld refinement to improve the fit quality. Electrochemical Impedance Spectroscopy (EIS) was performed with a Solartron electrochemical interface (SI 1287) and an impedance/gain-phase analyzer (SI 1260) using a 2-probe method. Gold paste (Heraeus) electrodes were applied symmetrically on both surfaces of the disc and fired at 500 °C for one hour. The range of frequencies tested was 100 Hz to 1 MHz, with a 10 mV amplitude. The temperature of the sample was varied from room temperature to 400 °C using a Barnstead Thermolyne 2100 tube furnace (Barnstead Thermolyne Co., Dubuque, Iowa). The temperature of the sample was monitored with an Omega K-type thermocouple (Omega Inc., Norwalk, Connecticut) read from a Keithley 2000 meter (Tektronix, Beaverton, Oregon). Table I lists the electrode dimensions for measurement of the conductivity parallel and perpendicular to the disc axes.
TABLE I. The electrode dimensions for measurement of the conductivity parallel and perpendicular to the disc axes.
III. RESULTS AND DISCUSSION
Prior to any microstructural characterization or transport measurements, it was necessary to ensure that the pellets were fully converted from α-alumina + YSZ composites to Na-β″-alumina + YSZ composites. There were three ways to ensure full conversion of materials. The first way was by following the kinetic studies provided by Virkar and Parthasarathy. Reference Parthasarathy and Virkar7 They showed that conversion begins at the pellet surfaces, proceeds into the pellet interior, and eventually converts the entire sample. They demonstrated that the pellets with a grain size of 0.86 µm (here close to sample A) had 1 mm conversion thickness at 1450 °C in one hour. Under these same conditions, pellets with a grain size of 2.4 µm (here close to sample B) had a conversion thickness of about 0.7 mm. This suggests that at 1450 °C and for a duration of 10 h, a 2 mm thick pellet is fully converted. The second evidence of full conversions was the pellet’s geometrical and gravimetrical change after conversion. Through incorporation of Na2O in the α-Al2O3 structure, the theoretical net weight change will be ∼10% as demonstrated here:
 $${\rm{Weight}}\;{\rm{of}}\;1\;{\rm{mole}}\;{\rm{of}}\;\alpha {\rm{ ‐ A}}{{\rm{l}}_2}{{\rm{O}}_3} = 102\;{{\rm{g}} / {{\rm{mole}}\quad {\rm{,}}}}$$
 $${\rm{Weight}}\;{\rm{of}}\;1\;{\rm{mole}}\;{\rm{of}}\;\left( {{1 / {6.2}}} \right)\;{\rm{N}}{{\rm{a}}_2}{\rm{O}} \cdot {\rm{A}}{{\rm{l}}_2}{{\rm{O}}_3} = 112\;{{\rm{g}} / {{\rm{mole}}}}\quad ,$$
 $${\rm{The}}\;{\rm{net}}\;{\rm{weight}}\;{\rm{change}} = {{\left( {112 - 102} \right)\left( {{{\rm{g}} \over {{\rm{mol}}}}} \right)} \over {102\left( {{{\rm{g}} \over {{\rm{mol}}}}} \right)}} \times 100 = 9.8\% \quad .$$
In a similar way, it can be shown that the theoretical net volume change of α-Al2O3 into Na-β″-alumina is about 33%. Reference Chevalier, Gremillard, Virkar and Clarke21 Using the rule of mixtures and given that the volume ratio of α-Al2O3 to YSZ used was 70/30, it was calculated that the fully converted pellet should satisfy a weight change of about 6% and a volume change of about 23%. These expected weight and volume changes were very close to the experimentally observed values of 5–6% and 21%, respectively. Finally, to ensure full conversion, we made some sacrificial pellets. The pellets were cross sectioned and while one half was polished and thermally etched for microstructural characterization, the other half was ground into powder for XRD analysis. None of the observations by SEM, optical microscopy, or XRD showed any evidence of α-Al2O3 or unconverted regions.
Figure 1 shows XRD pattern of the as-sintered samples A and B sintered for 3 h at 1500 °C and 1700 °C, respectively. Histograms above the diffraction patterns indicate which peaks correspond to either α-Al2O3 or tetragonal YSZ. No impurity peaks were observed. A good refinement fit was achieved (R wp = 11–15%) allowing for quantitative analysis of the phases present. The calculated weight ratio obtained by the Rietveld refinement was in good agreement with the weight ratio used to prepare the initial mixture.

FIG. 1. An XRD pattern of as-sintered Al2O3 + YSZ (above) sintered at 1500 °C for 3 h and (below) sintered at 1700 °C for 3 h. Histogram marks correspond to phases included in the refinement.
The XRD patterns of the converted samples are shown in Fig. 2 with histograms above the diffraction patterns for each phase present. An acceptable fit with a weighted residual error of R wp = 14% was achieved. It can be seen that the product pattern is almost identical for samples A and B with the exception of impurity monoclinic zirconia peaks in sample B. The calculated weight percentage of each phase agreed well with the expected weight gain of α-alumina after conversion (∼10% increase). However, an evolution of 7 wt% monoclinic ZrO2 phase was observed in sample B.
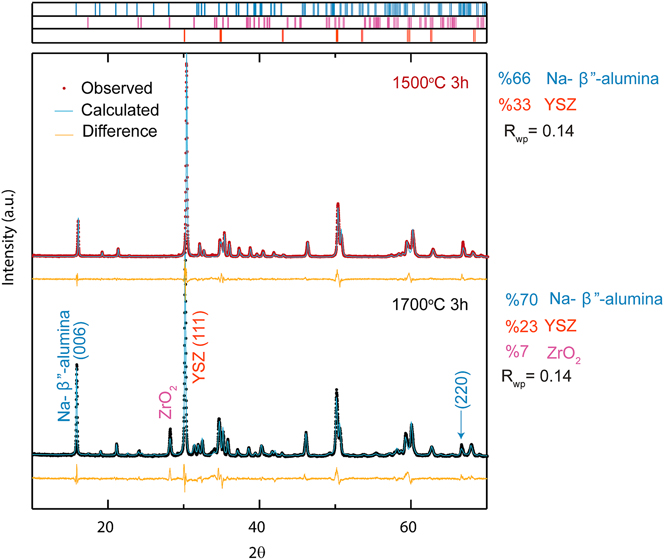
FIG. 2. An XRD pattern of Al2O3 + YSZ samples after vapor phase conversion heat treatment at 1450 °C for 10 h and (above) sintered at 1500 °C for 3 h and (below) sintered at 1700 °C for 3 h. Histogram marks correspond to phases included in the refinement.
The evolution of the monoclinic phase in sample B is related to the martensitic transformation in YSZ. It is well known that alloying ZrO2 with another oxide can fully or partially stabilize the tetragonal or cubic phase. Adding 2–3 mol percent of Y2O3 has been one attractive choice to maintain the tetragonal phase at room temperature. In 3YSZ, the tetragonal to monoclinic transformation (t–m) is triggered through crack propagation which provides higher fracture toughness and is called transformation toughening. Reference Hannink, Kelly and Muddle22,Reference Lange23
A simple analysis by Lange Reference Sudworth and Tiley24 explains the factors contributing to the t–m transformation in tetragonal particles embedded in an infinite matrix:
 $$\Delta {G_{{\rm{t}} – {\rm{m}}}} = \Delta {G_{\rm{c}}} + \Delta {U_{{\rm{SE}}}} + \Delta {U_{\rm{S}}}\quad ,$$
where ΔG t–m is the total free energy change of t–m transformation, ΔG c is the difference in chemical free energy between the tetragonal and monoclinic phases, ΔU SE refers to the change in elastic strain energy, and ΔU S is the change in energy associated with the formation of new interfaces.
The two terms, ΔU SE and ΔU S, are most important in affecting the t–m transformation in Na-β″-alumina + YSZ samples sintered at 1700 °C. ΔU SE is related to the modulus of the surrounding matrix and internal stresses. A stiffer matrix increases ΔU SE and stabilizes the tetragonal phase. This was observed in the samples before conversion (no monoclinic ZrO2 was detected in the XRD pattern of samples). After conversion, the matrix elasticity of the composite was decreased. Beta alumina has a young’s modulus of 2.1 × 10¹¹ N/m2 which is about half of the Young’s modulus of 4.4 × 10¹¹ N/m2 reported for α-alumina. Reference Chen and Xue25 The decrease in the stiffness of the surrounding matrix after conversion could have resulted in the t–m transformation. The evolution of the monoclinic phase after conversion was only observed in the large-grained samples. The samples sintered at 1700 °C have larger grain size which might have resulted in an increase in internal stresses and thereby contributed as a factor toward the transformation. In addition to the change in the matrix stiffness, as stated earlier, the conversion of α-Al2O3 to Na-β″-Al2O3 is accompanied by a 33% volume increase. This increase in volume also increases internal stresses which facilitate the t–m transformation.
Consequently, we conclude that both grain size and the surrounding matrix are responsible for the evolution of the previously unobserved monoclinic ZrO2 phase in samples sintered at 1700 °C. Furthermore, the evolution of the monoclinic phase in large-grained samples might be responsible for the slower kinetics of vapor phase conversion with increasing grain size. Virkar and Parthasarathy Reference Parthasarathy and Virkar7 showed that the kinetics of vapor phase conversion is governed by the oxygen diffusion factor. Unexpectedly, they observed that by increasing the grain size (and thereby reducing the number of grain boundaries), the kinetics gets slower and the oxygen diffusion factor remains constant.
Additionally, careful analysis of the XRD pattern of the converted samples reveals the presence of texturing in the samples after conversion. For example, it can be seen that the intensity of the (006) peak of Na-β″-alumina compared to the (220) peak is higher in the sample sintered at 1700 °C. The (006) peak is observed at a 2θ value of 15.6°, while the (220) peak is observed at a 2θ value of 66.5°. Figure 3(a) shows the crystal structure of Na-β″-alumina, Fig. 3(b) illustrates the grain alignment and textured crystal orientation in the disc-shaped samples sintered at 1500 °C, and Fig. 3(c) shows the textured converted region, reaction front, and equiaxed unconverted region. It has been well understood that in Na-β″-alumina samples, grain growth proceeds parallel to the basal plane (conduction plane) leading to a platy crystal habit having the c-axis normal to the platelet face. To support and clarify information about the texturing habit of the samples, the Lotgering factor (LF) was calculated and compared for these two samples. The LF is calculated using the following equation:
 $$F = {{P - {P_{\rm{o}}}} \over {1 - {P_{\rm{o}}}}}\quad ,$$
where P is the ratio of the sum of intensities in the texturing direction divided by the sum of all intensities. P o is the P for an isotropic sample with a fully random orientation. Here based on our postulate, we calculated P considering the texturing along the [110] direction (where (110) plane is parallel to the disk surface):
 $$P = {{\mathop {\sum {{I_{110}}} }\nolimits^ } \over {\mathop {\sum {{I_{hkl}}} }\nolimits^ }}\quad .$$

FIG. 3. (a) A projection of Na-β″-alumina structure featuring Na in hexagonal channels, (b) schematic orientation of platy grains and crystal orientation in samples, and (c) microstructure of the textured converted region, reaction front, and the equiaxed unconverted region in samples sintered at 1500 °C.
This gives a LF of 0.08 for sample A and 0.005 for sample B. The results indicate that both samples are slightly textured in a similar habit, but pre-conversion grain size plays a role in the degree of texturing. However, given that the X-ray beam only penetrates a few tens of micrometers, this observation cannot be assigned to the whole thickness. To clarify how the texturing changes as a function of depth in the sample, the XRD spectra was collected on the surface after grinding away 400 µm of material toward the sample center. A sample was prepared following the same conditions as sample A and used to characterize LF as a function of depth toward the center (see Fig. 4). Although the degree of texturing is small, the texturing increases monotonically as a function of depth. This depth dependence is consistent with the mechanism of conversion. At the vicinity of the surface, the conversion starts by adsorption of Na+ and O2− yielding multidirectional transport of Na2O, thus a low degree of texturing is expected. However, moving away from the surface, the transport of Na2O and accompany degree of texture becomes increasingly unidirectional. Thus, the conversion progress will be perpendicular to the side of the sample having a large surface area. The platelet grains will be elongated toward the conversion progress direction enhancing the degree of texturing.

FIG. 4. The change in LF as a function of depth toward the center of a sample sintered at 1500 °C for 3 h and subsequently vapor phase converted by heat treatment at 1450 °C for 10 h.
Another evidence of anisotropic properties is the change in dimension of samples A and B after conversion. Samples sintered at 1500 °C for 3 h after conversion have 16–19% increase in thickness and 0.7–3% increase in diameter, while samples sintered at 1700 °C for 3 h after conversion show 5–6% percent increase in both thickness and diameter. The increased thickness in sample A relative to sample B is likely due to the increased aspect ratio of grains and texture development.
Figure 5 shows the microstructure of samples A and B before conversion. As illustrated, both compounds of α-Al2O3 and YSZ possess equiaxed grain morphology. The corresponding grain size for samples A and B was measured to be 0.81 ± 0.06 µm and 2.97 ± 0.09 µm, respectively. The reported average grain size refers to the average grain size of both α-Al2O3 and YSZ as suggested by Parthasarathy and Virkar. Reference Parthasarathy and Virkar7 Separate measurement of the average grain size resulted in an average grain size of 2.62 ± 0.06 µm and 3 ± 0.11 µm corresponding to YSZ and α-Al2O3, respectively, in sample A and an average grain size of 0.59 ± 0.03 µm and 0.96 ± 0.04 µm corresponding to YSZ and α-Al2O3, respectively, in sample B. Therefore, in both samples, the grain sizes of both phases are close to one another, but in both samples, the YSZ phase’s average grain diameter is slightly smaller. The SEM microstructure of samples A and B after conversion are shown in Fig. 6. The images on the left show the cross-sectional microstructure of the disc-shaped samples, and pictures on the right show the surface microstructure of the disks. Gray grains are the Na-β″-alumina phase, and white grains are the YSZ phase. Typical Na-β″-alumina grains are platelet-shaped grains. However, the grains are more elongated in samples sintered at 1500 °C [Figs. 6(c) and 6(d)]. Figure 6(c) in particular features the cross-sectional area, confirming that grains are aligned parallel to the progression of vapor phase synthesis. Crystals are aligned in such a way that the conduction plane is also parallel to the synthesis progression which is reasonable since this provides the fastest Na ion transport thus facilitating fast conversion. These results support the anisotropic expansion of sample A after conversion (larger increase in the thickness compared to diameter) as opposed to the homogenous expansion of sample B after conversion.

FIG. 5. SEM micrographs of samples (a) sintered at 1500 °C for 3 h and (b) sintered at 1700 °C for 3 h.

FIG. 6. SEM micrographs of samples (a) sintered at 1700 °C for 3 h and converted at 1450 °C for 10 h cross section, (b) parallel to the disc plane, (c) sintered at 1500 °C for 3 h and converted at 1450 °C for 10 h cross section, and (d) parallel to the disc plane.
The assumption that sodium does not interact with YSZ but rather only reacts with alumina is justified by examining XRD refinement results and Energy Dispersive Spectroscopy (EDS). The XRD refinement of sample A before and after conversion shows similar lattice parameters of a = b = 3.607, c = 5.183 for tetragonal ZrO2. If Na2O had interaction with YSZ, one would expect to see slightly different lattice parameters after conversion. Furthermore, quantitative analysis of the EDS spectra shows no Na present in YSZ grains when the beam energy was adjusted to limit the volume of interaction to one grain. The EDS analysis showed that the composition of YSZ grains was 56 at% oxygen, 5 at% yttrium, and 39 at% zirconium, whereas Na-β″-alumina grains were 54 at% oxygen, 4 at% sodium, and 42 at% aluminum.
IV. MEASUREMENT OF CONDUCTIVITY BY EIS
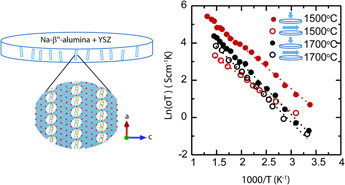
The results of the electrical conductivity measurement further support the anisotropic characteristics of the samples initially observed by microstructure, XRD, and geometrical change observations. Figure 7 shows impedance response of the samples with gold electrodes at 3 temperatures 100, 150, and 350 °C over the frequency range from 100 Hz to 1 MHz for samples A and B. For samples sintered at each temperature, two measurements were conducted. One measurement was parallel to the disc primary axis to measure the electrical conductivity across the disc thickness and the other measurement was perpendicular to the primary disc axis to measure the conductivity in the plane of the disc. Extrapolation to the x-axis was taken as the measured resistance. This resistance was taken as the bulk resistance of the sample and collected starting from room temperature to 400 °C. Accordingly, an Arrhenius plot of the conductivity, as seen in Fig. 8, was plotted. The data can be fitted to a straight line following the equation
 $$\sigma = {{{\sigma _0}} \over T}\exp \left( {{{ - {E_{\rm{a}}}} \over {{K_{\rm{B}}}T}}} \right)\quad ,$$
where σ0 is the pre-exponential factor in S/cm K, E a is the activation energy, k B is the Boltzmann constant, and T is the temperature in Kelvin. For comparison, the measured parameters for each sample and the attributed electrode are tabulated in Table II.

FIG. 7. Nyquist plot for samples sintered at 1500 °C (top) and sintered at 1700 °C (bottom), for conductivity measurements parallel to the disc axis (left) and conductivity measurements perpendicular to the disc axis (right).

FIG. 8. Arrhenius plot for samples sintered at 1500 °C and sintered at 1700 °C for 3 h for parallel (filled) to the disc axes and (unfilled) perpendicular to the disc axes.
TABLE II. Comparison of conductivity and activation energy for samples sintered at 1500 °C and sintered at 1700 °C for 3 h.
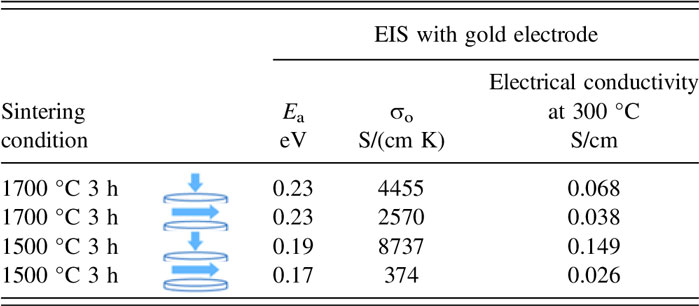
Conductivity measurements by Virkar et al. 1978 Reference Virkar, Miller and Gordon3 on polycrystalline Na-β″-alumina samples made by conventional sintering showed that the activation energy varied between 0.17 and 0.24 eV for coarse-and fine-grained samples, respectively. For comparison, the Arrhenius plot measured by this study is plotted in Fig. 8. Despite the similar activation energy range (0.17–0.23 eV) of the composite materials in this study and the study by Virkar, here, the low-range activation energy corresponds to the fine-grained sample, and the high-range corresponds to the coarse-grained sample. This represents an opposite trend compared to the Virkar study. At 300 °C, the electrical conductivity of the sample sintered at 1500 °C for 3 h parallel to the disc axis is ∼0.15 S/cm and it is 5.7 times larger than the conductivity in the orthogonal direction. In comparison, at 300 °C, the sample sintered at 1700 °C for 3 h shows a conductivity of ∼0.068 S/cm parallel to the disc axis which is 1.8 times higher than the conductivity in the orthogonal direction. Therefore, electrical conductivity measurements not only offer additional evidence of anisotropy but they also show that sample A featured greater anisotropy than sample B, in agreement with previous observations.
Given that the LF analysis only suggests minimal texturing in samples, the strong anisotropy in the conductivity of samples in two orthogonal directions may not solely be due to the presence of texturing in samples. Instead, it can be described by the presence of a gradient in Na concentration through the samples. It is speculated that the surface of the sample is rich in sodium because it has been exposed to a Na source during conversion for a longer time than the central portion of the disks. It is also possible that during measurement of conductivity, the sample loses some Na from the surfaces that result in the measuring of lower conductivity in the orthogonal direction.
Similarly, this can explain the larger conductivity of sample A compared to sample B. Both samples were converted for 10 h but given the higher Na conductivity in the smaller-grained samples, it is consistent that sample A could have a higher Na concentration than sample B and therefore a higher conductivity.
V. CONCLUSION
Composites of Na-β″-alumina + YSZ were prepared by vapor phase conversion. Prior to the vapor phase, the conversion samples were sintered for 3 h at 1500 °C for sample A and at 1700 °C for sample B. Both samples A and B were converted by heat treatment of the as-sintered samples in the packing powder of Na-β″-alumina at 1450 °C for 10 h. Phase identification, morphological analysis, and electrical conductivity were conducted by performing XRD, scanning electron microscopy (SEM), and EIS, respectively. All analysis, including geometrical change, after conversion confirmed the presence of anisotropy in samples A and B. Results showed the slight alignment of the plate-like crystals perpendicular to disc faces with the conduction plane parallel to the synthesis progression that provides the fastest Na ion transport thus facilitating fast conversion. An anisotropy factor of 5.7 for samples sintered at 1500 °C was observed compared to an anisotropy factor of 1.8 for samples sintered at 1700 °C. The strong anisotropy in sample A was attributed to the evolution of more elongated grains in addition to the possible gradient in sodium concentration. Quantitative phase analysis of XRD also showed the previously unobserved evolution of a small amount of the monoclinic phase (7 wt%) in sample B after conversion which was likely due to the results of internal stresses as well as contributions from the modified surface energy change with a more compliant matrix surrounding the YSZ grains. It was concluded that the transformation of a portion of the YSZ to the monoclinic zirconia phase might be responsible for the slow conversion kinetics by increasing the grain size observed in this and previous studies. Finally, we observed that there are different factors playing a role in the development of anisotropic properties of the samples such as sample thickness, burial depth in packing powder, duration of conversion heat treatment etc. These processing parameters merit further investigation in future work.
ACKNOWLEDGMENTS
This work was supported by the National Science Foundation under grant No. DMR-1407048. The authors thank Dr. Anil Virkar for helpful discussion and comments.


 Open access