


1. Introduction
Large-scale ice shelf retreat is of concern because it can reduce the back-stress exerted on grounded ice further inland and trigger enhanced ice discharge – a process known as ‘ice shelf de-buttressing’ (Rignot and others, Reference Rignot2004; Scambos and others, Reference Scambos, Bohlander, Shuman and Skvarca2004). Numerical modelling projections suggest this process will be a key control on the timing and magnitude of future sea-level rise from Antarctica (Golledge and others, Reference Golledge2015; DeConto and Pollard, Reference DeConto and Pollard2016). The retreat of ice shelves and ice tongues in Antarctica has been attributed to a combination of, and often feedbacks between, enhanced atmospheric warming (Doake and Vaughan, Reference Doake and Vaughan1991; Scambos and others, Reference Scambos, Hulbe, Fahnestock, Domack, Levente, Burnet, Bindschadler, Convey and Kirby2003), surface meltwater-induced flexure and hydrofracture (Banwell and others, Reference Banwell, MacAyeal and Sergienko2013, Reference Banwell, Willis, Macdonald, Goodsell and MacAyeal2019; Banwell and MacAyeal, Reference Banwell and Macayeal2015), thinning from basal melting (Shepherd and others, Reference Shepherd, Wingham, Payne and Skvarca2004), sea-ice loss (Miles and others, Reference Miles, Stokes and Jamieson2017, Reference Miles, Stokes and Jamieson2018), ocean swell (Massom and others, Reference Massom2018) and the enhancement of structural weaknesses (Massom and others, Reference Massom2015; Miles and others, Reference Miles2020). An important process driving ice shelf retreat is iceberg calving, which accounts for ~50% of ice mass loss from Antarctica (Rignot and others, Reference Rignot, Jacobs, Mouginot and Scheuchl2013).
The frequency of major calving events and large-scale retreat can be modulated by ice mélange (an amalgamation of sea ice, marine ice, firn and densely packed calved icebergs), which is known to exert a buttressing force on floating glacier tongues and ice shelves (Amundson and others, Reference Amundson, Fahnestock, Truffer, Lüthi and Motyka2010; Massom and others, Reference Massom2010; Carr and others, Reference Carr, Vieli and Stokes2013; Moon and others, Reference Moon, Joughin and Smith2015; Burton and others, Reference Burton, Amundson, Cassotto, Kuo and Dennin2018; Xie and others, Reference Xie, Dixon, Holland, Voytenko and Vankova2019; Schlemm and Levermann, Reference Schlemm and Levermann2020). Because of this, the removal of ice mélange and the associated reduction in buttressing can weaken the structural integrity of floating glacier tongues and ice shelves (Cassotto and others, Reference Cassotto, Fahnestock, Amundson, Truffer and Joughin2015; King and others, Reference King, De Rydt and Gudmundsson2018; Miles and others, Reference Miles2020). Landfast sea ice, which is sea ice that becomes ‘fastened’ to the coastline, floating ice shelves/tongues, or grounded icebergs (Massom and others, Reference Massom2010), can often be a major component of mélange (Robel, Reference Robel2017; Miles and others, Reference Miles, Stokes and Jamieson2018). Indeed, areas of landfast ice that persist year-round, known as multiyear landfast ice (MYLI), can thicken to form extensive, decades-old slabs up to tens of metres thick, which provide stability to floating glacier tongues (Giles and others, Reference Giles, Massom and Lytle2008; Massom and others, Reference Massom2010, Reference Massom2015).
The presence of MYLI and ice mélange is an important control on the stability of ice shelves and glacier tongues in Antarctica. Indeed, mechanical coupling between thick (10–55 m) MYLI and the Mertz Glacier Tongue is thought to have delayed its calving event in 2010 by enclosing major rifts (Massom and others, Reference Massom2010, Reference Massom2015). This is similar to parts of the Brunt/Stancomb-Wills Ice Shelf system where thick (>100 m) mélange cements together large tabular icebergs (Khazendar and others, Reference Khazendar, Rignot and Larour2009). On the Antarctic Peninsula, the Larsen A Ice Shelf was in a heavily fractured state and only bound together by dense MYLI prior to breaking up in January 1995 (Rott and others, Reference Rott, Skvarca and Nagler1996). Similarly, the loss of large portions of Wilkins Ice Shelf in 2008 may have been triggered by the displacement of ice mélange causing fracturing along pre-existing failure zones (Humbert and Braun, Reference Humbert and Braun2008). Observations have also recorded reductions in MYLI extent in numerous locations around Antarctica over the last two decades (Ushio, Reference Ushio2006; Massom and others, Reference Massom2010; Stammerjohn and others, Reference Stammerjohn, Maksym, Heil and Massom2011). In northern Greenland, the reduction in buttressing associated with the disintegration of mélange and MYLI in front of Nioghalvfjerdsfjorden is thought to have triggered a large calving event in 1997 from its floating ice tongue (Reeh and others, Reference Reeh, Thomsen, Higgins and Weidick2001; Hill and others, Reference Hill, Carr and Stokes2017). However, comprehensive observations, in situ measurements and numerical modelling of mélange and MYLI properties (such as strength and back-stress) are typically scarce, meaning their influence on ice shelf buttressing and stability is poorly understood. For example, large-scale retreat of vulnerable marine-based sectors of Antarctica like the Amundsen Sea Sector into unconfined embayments could potentially generate a large amount of mélange, but the potential mitigating effect of this buttressing component is unknown (Pollard and others, Reference Pollard, DeConto and Alley2018). Thus, understanding the relative contributions and importance of mélange and MYLI in modulating ice shelf and tidewater glacier calving has important implications for projections of grounding line retreat and inland ice loss.
Ice shelf break-up on the Antarctic Peninsula has dominated the literature on ice shelf stability and has drawn attention to the influence of both external (atmospheric, oceanic) and internal (glaciological) forcing on these events (Rott and others, Reference Rott, Skvarca and Nagler1996; Scambos and others, Reference Scambos, Hulbe, Fahnestock, Domack, Levente, Burnet, Bindschadler, Convey and Kirby2003, Reference Scambos, Bohlander, Shuman and Skvarca2004, Reference Scambos2009; Glasser and Scambos, Reference Glasser and Scambos2008; Braun and others, Reference Braun, Humbert and Moll2009; Banwell and others, Reference Banwell, MacAyeal and Sergienko2013). However, there are comparatively few observations of the nature and timing of calving events around the East Antarctic Ice Sheet (EAIS). East Antarctica is characterised by numerous outlet glaciers terminating in prominent floating ice tongues and ice shelves, which are often buttressed by mélange and/or MYLI (Miles and others, Reference Miles, Stokes and Jamieson2016). Importantly, many of these outlet glaciers and ice shelves are located in marine-based sectors that are potentially vulnerable to ocean warming and marine ice-sheet instability, such as Wilkes Land (Miles and others, Reference Miles and Stokes2013; Miles and others, Reference Miles, Stokes and Jamieson2016; Rintoul and others, Reference Rintoul2016; Shen and others, Reference Shen, Wang, Shum, Jiang, Hsu and Dong2018; Rignot and others, Reference Rignot2019). Observations have shown that Wilkes Land is currently experiencing the highest rates of mass loss in East Antarctica, and has been losing mass at an accelerating rate (Shen and others, Reference Shen, Wang, Shum, Jiang, Hsu and Dong2018; Rignot and others, Reference Rignot2019; Smith and others, Reference Smith2020; Velicogna and others, Reference Velicogna2020), with recent observations recording a 53 ± 14 Gt a−1 increase in ice discharge from this region since 2008 (Shen and others, Reference Shen, Wang, Shum, Jiang, Hsu and Dong2018). Ice shelves here have been thinning (Pritchard and others, Reference Pritchard2012), accompanied by grounding line retreat, and the acceleration and widespread retreat of outlet glaciers (Li and others, Reference Li, Rignot, Morlighem, Mouginot and Scheuchl2015; Miles and others, Reference Miles, Stokes and Jamieson2016; Konrad and others, Reference Konrad2018). These changes have been linked to enhanced basal melt driven by the influx of warm circumpolar deepwater (CDW) and seasonally warm Antarctic Surface Water entering ice shelf cavities (Rintoul and others, Reference Rintoul2016; Adusumilli and others, Reference Adusumilli, Fricker, Medley, Padman and Siegfried2020) and reductions in MYLI (Miles and others, Reference Miles, Stokes and Jamieson2017).
A synchronous break-up event at four outlet glaciers in Porpoise Bay, Wilkes Land, was recently linked to MYLI breakout and atmospheric circulation anomalies (Miles and others, Reference Miles, Stokes and Jamieson2017). This rapid disintegration occurred between January and April 2007 and resulted in a 1300 km2 loss of ice from four outlet glacier tongues, whose calving fronts retreated by up to 28 km (Miles and others, Reference Miles, Stokes and Jamieson2017). A similar break-up ~100 km further west was also noted by Miles and others (Reference Miles, Stokes and Jamieson2017), but not investigated. Here, we provide the first detailed observations of this event at Voyeykov Ice Shelf (VIS), which occurred from late March to late May 2007 and involved the disaggregation of adjoining ice mélange and partial loss of the ice shelf. Note that we refer to this as a ‘disaggregation’ event because it involved the rapid separation of mostly already-detached and fractured blocks of ice bounded by mélange and MYLI and a small region of relatively intact ice shelf. This is in marked contrast to the rapid disintegration of a much larger and intact ice shelf via intense hydrofracturing, as has been well-documented on the Antarctic Peninsula (Doake and Vaughan, Reference Doake and Vaughan1991; Rott and others, Reference Rott, Skvarca and Nagler1996; Scambos and others, Reference Scambos, Hulbe, Fahnestock, Domack, Levente, Burnet, Bindschadler, Convey and Kirby2003; Banwell and others, Reference Banwell, MacAyeal and Sergienko2013). During the event at VIS, the combined ice shelf-mélange area decreased from ~3624 km2 in February 2007 to ~1179 km2 in May 2007, totalling a loss of ~2445 km2, of which 9% was intact ice shelf fed by two glaciers. Since this mélange disaggregation and partial loss of the ice shelf, VIS has re-advanced, and in April 2020, the ice shelf area was ~1650 km2. Here, we identify the mechanisms that triggered disaggregation by comparing structural glaciological and climatic changes preceding and following this event. We first consider the potential roles of atmospheric and oceanic forcings and ice shelf dynamics (structural integrity, velocity, surface hydrology) in the disaggregation event. We then assess the evolution of the ice shelf following this disaggregation to investigate whether any changes provide indications of its potential near-future instability.
2. Data and methods
2.1 Study area
VIS (66°S 124°E) drains an area of ~7104 km2 into the 45 km wide Maury Bay in Wilkes Land (Fig. 1). We use the term ‘ice shelf’ in this location to describe the coalescing floating tongues of two tributary glaciers that terminate in an unconfined ice shelf, as opposed to an ‘ice tongue’, which is typically a protrusion of structurally-intact ice from a grounded glacier (e.g. Massom and others, Reference Massom2015). However, we draw attention to the complex nature of VIS compared to many other unconfined Antarctic ice shelves and outlet glacier tongues, because it is heavily fractured and its calving front terminates in a dense ice mélange composed of calved ice blocks bound by perennial MYLI (Fraser and others, Reference Fraser, Massom, Michael, Galton-Fenzi and Lieser2012, Reference Fraser2020, Fig. 1). Thus, VIS more closely resembles the present configuration of Thwaites Glacier tongue (Miles and others, Reference Miles2020) and Holmes Glacier in Porpoise Bay (Miles and others, Reference Miles, Stokes and Jamieson2017). In this respect, VIS also differs from Greenlandic outlet glaciers in well-confined fjords, where mélange tends to form seasonally (Amundson and others, Reference Amundson, Fahnestock, Truffer, Lüthi and Motyka2010; Cassotto and others, Reference Cassotto, Fahnestock, Amundson, Truffer and Joughin2015; Moon and others, Reference Moon, Joughin and Smith2015).
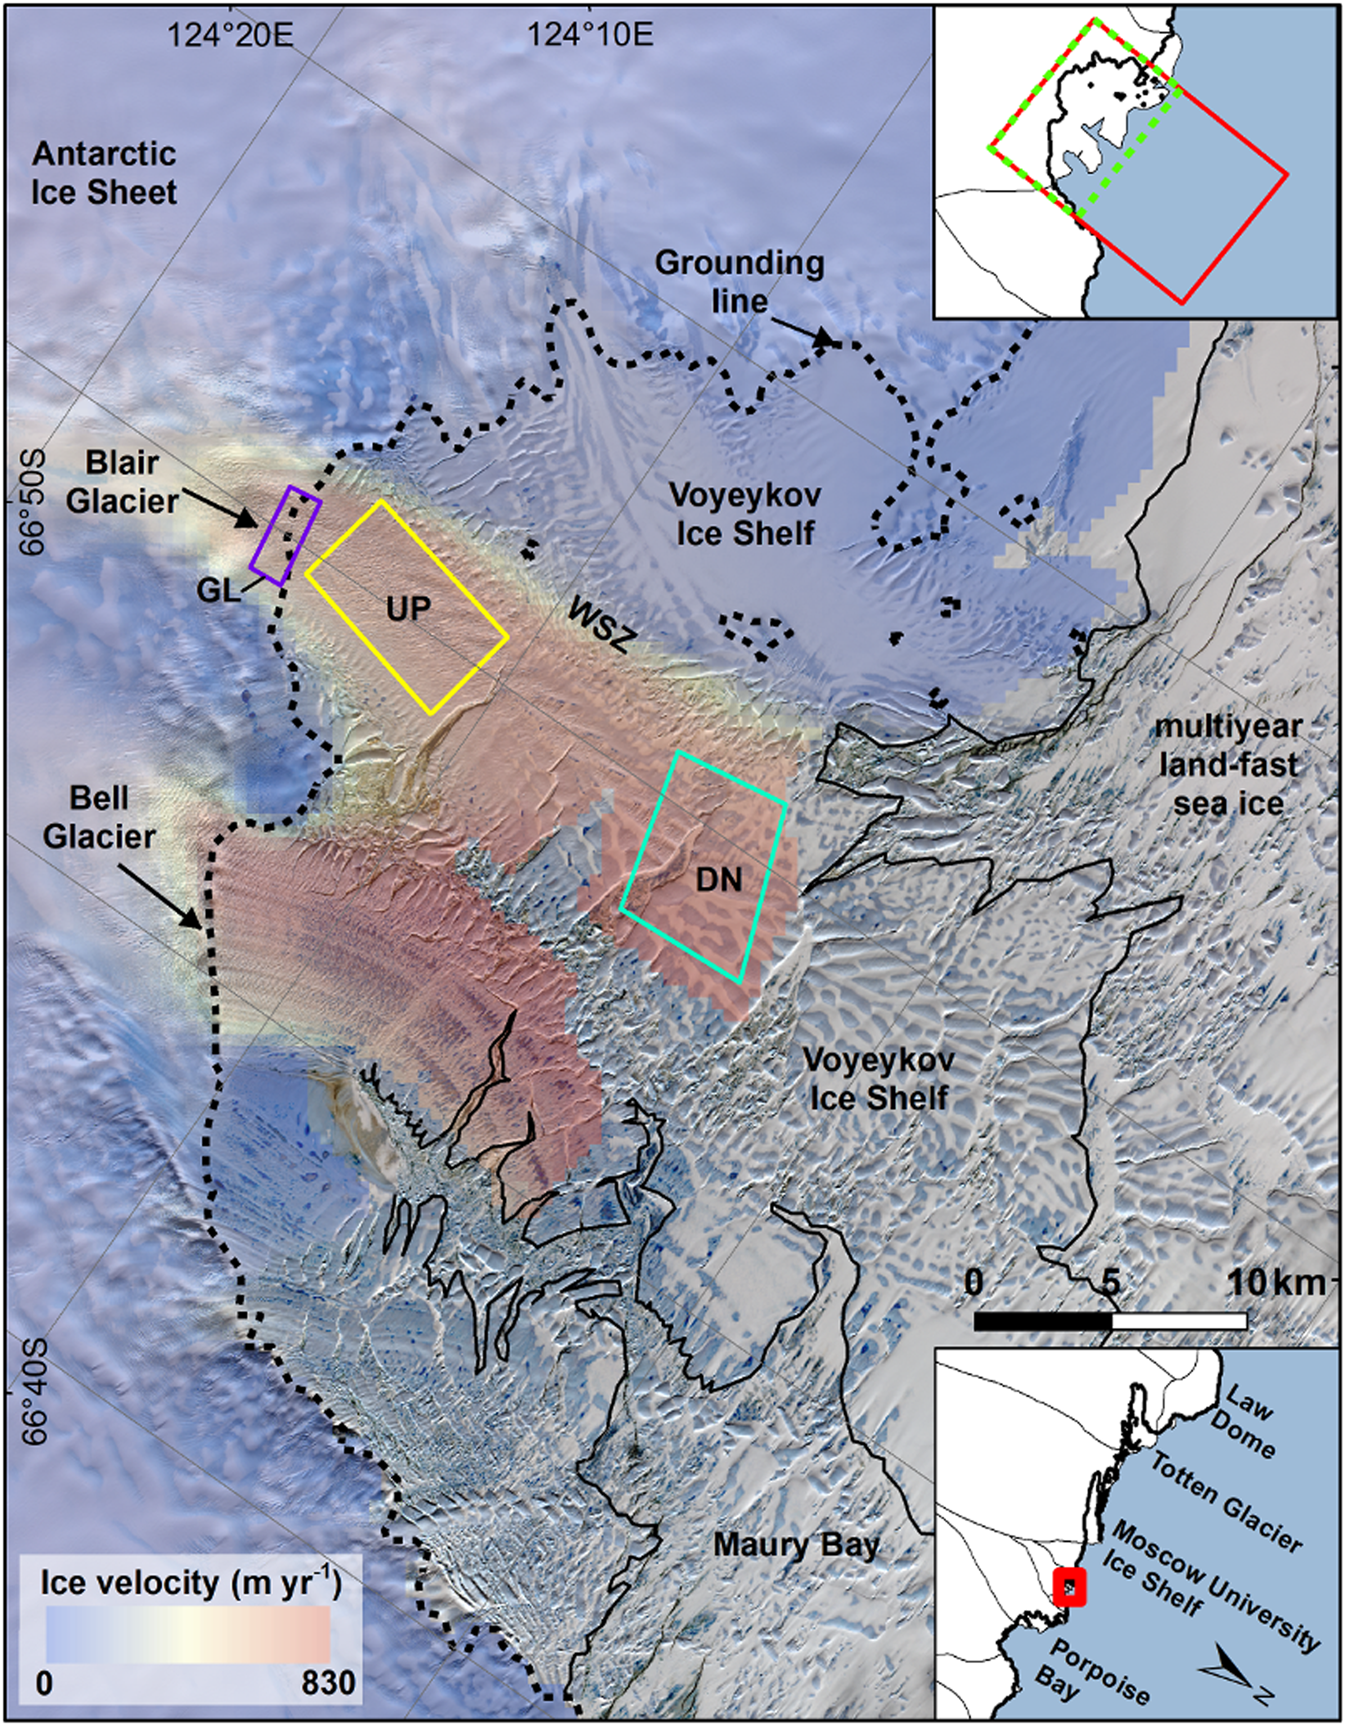
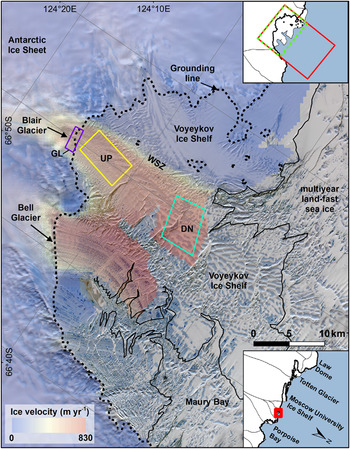
Fig. 1. Location map of Voyeykov Ice Shelf, East Antarctica. Background image is a Sentinel 2 scene (19/12/2019) overlain with ice flow velocities (Rignot and others, Reference Rignot, Mouginot and Scheuchl2017). Grounding line (black dashed line) is from Rignot and others (Reference Rignot, Mouginot and Scheuchl2016) and calving front (black solid line) has been manually delineated from the 19/12/2019 Sentinel 2 scene. AMSR-E sea ice and RACMO data were extracted from the red and dashed green boxes (upper right inset), respectively. ITS_LIVE velocity data were extracted from the three boxes on the main map: the grounding line (GL), up-ice tongue (UP) and down-ice tongue (DN). WSZ marks the western shear zone.
Two tributary glaciers feed VIS; the largest, Blair Glacier, drains into the central portion of the ice shelf where ice flow velocity reaches 793 ± 15 m a−1 (Fig. 1, Rignot and others, Reference Rignot, Mouginot and Scheuchl2017). The eastern part of the ice shelf is fed by Bell Glacier, which is faster-flowing (830 m a−1) and exhibits steeper ice surface slopes (~20°) at the grounding line (Fig. 2, Howat and others, Reference Howat, Porter, Smith, Noh and Morin2019). The western shear zone of Blair Glacier is characterised by a steep velocity gradient marking the transition to the slow-flowing (<160 m a−1), relatively inactive western part of VIS, which is grounded by several small pinning points (Fig. 1). Ice thickness is relatively consistent (~200 m) across the ice shelf but thickens to ~420 m at the grounding line (Fig. 2). Portions of the ice shelf experience relatively high measured mean surface melt rates (>150 mm w.e. a−1), which is higher than other East Antarctic ice shelves and ice tongues in Wilkes Land, such as Totten (>100 mm w.e. a−1) and Dibble (>120 mm w.e. a−1) (Trusel and others, Reference Trusel, Frey, Das, Kuipers Munneke and van den Broeke2013). Recent ice mass change estimates using height-change rate measurements from ICESat and ICESat2 laser altimetry have recorded an average thickening of 3.4 m a−1 between 2003 and 2019 over VIS (Smith and others, Reference Smith2020). VIS has a low surface gradient; the elevation change from Blair Glacier terminus to the grounding line is only ~33 m over 16 km, while being slightly higher (~50 m over 20 km) from Bell Glacier terminus to the grounding line (Fig. 2). Bell Glacier occupies a retrograde bed slope reaching 789 ± 89 m below sea level ~15 km from the grounding line, while Blair Glacier mostly occupies a stabilising prograde slope reaching 671 ± 89 m below sea level ~8 km from the grounding line, which includes a ridge 9 km inland from the grounding line (Fig. 2, Morlighem and others, Reference Morlighem2019).
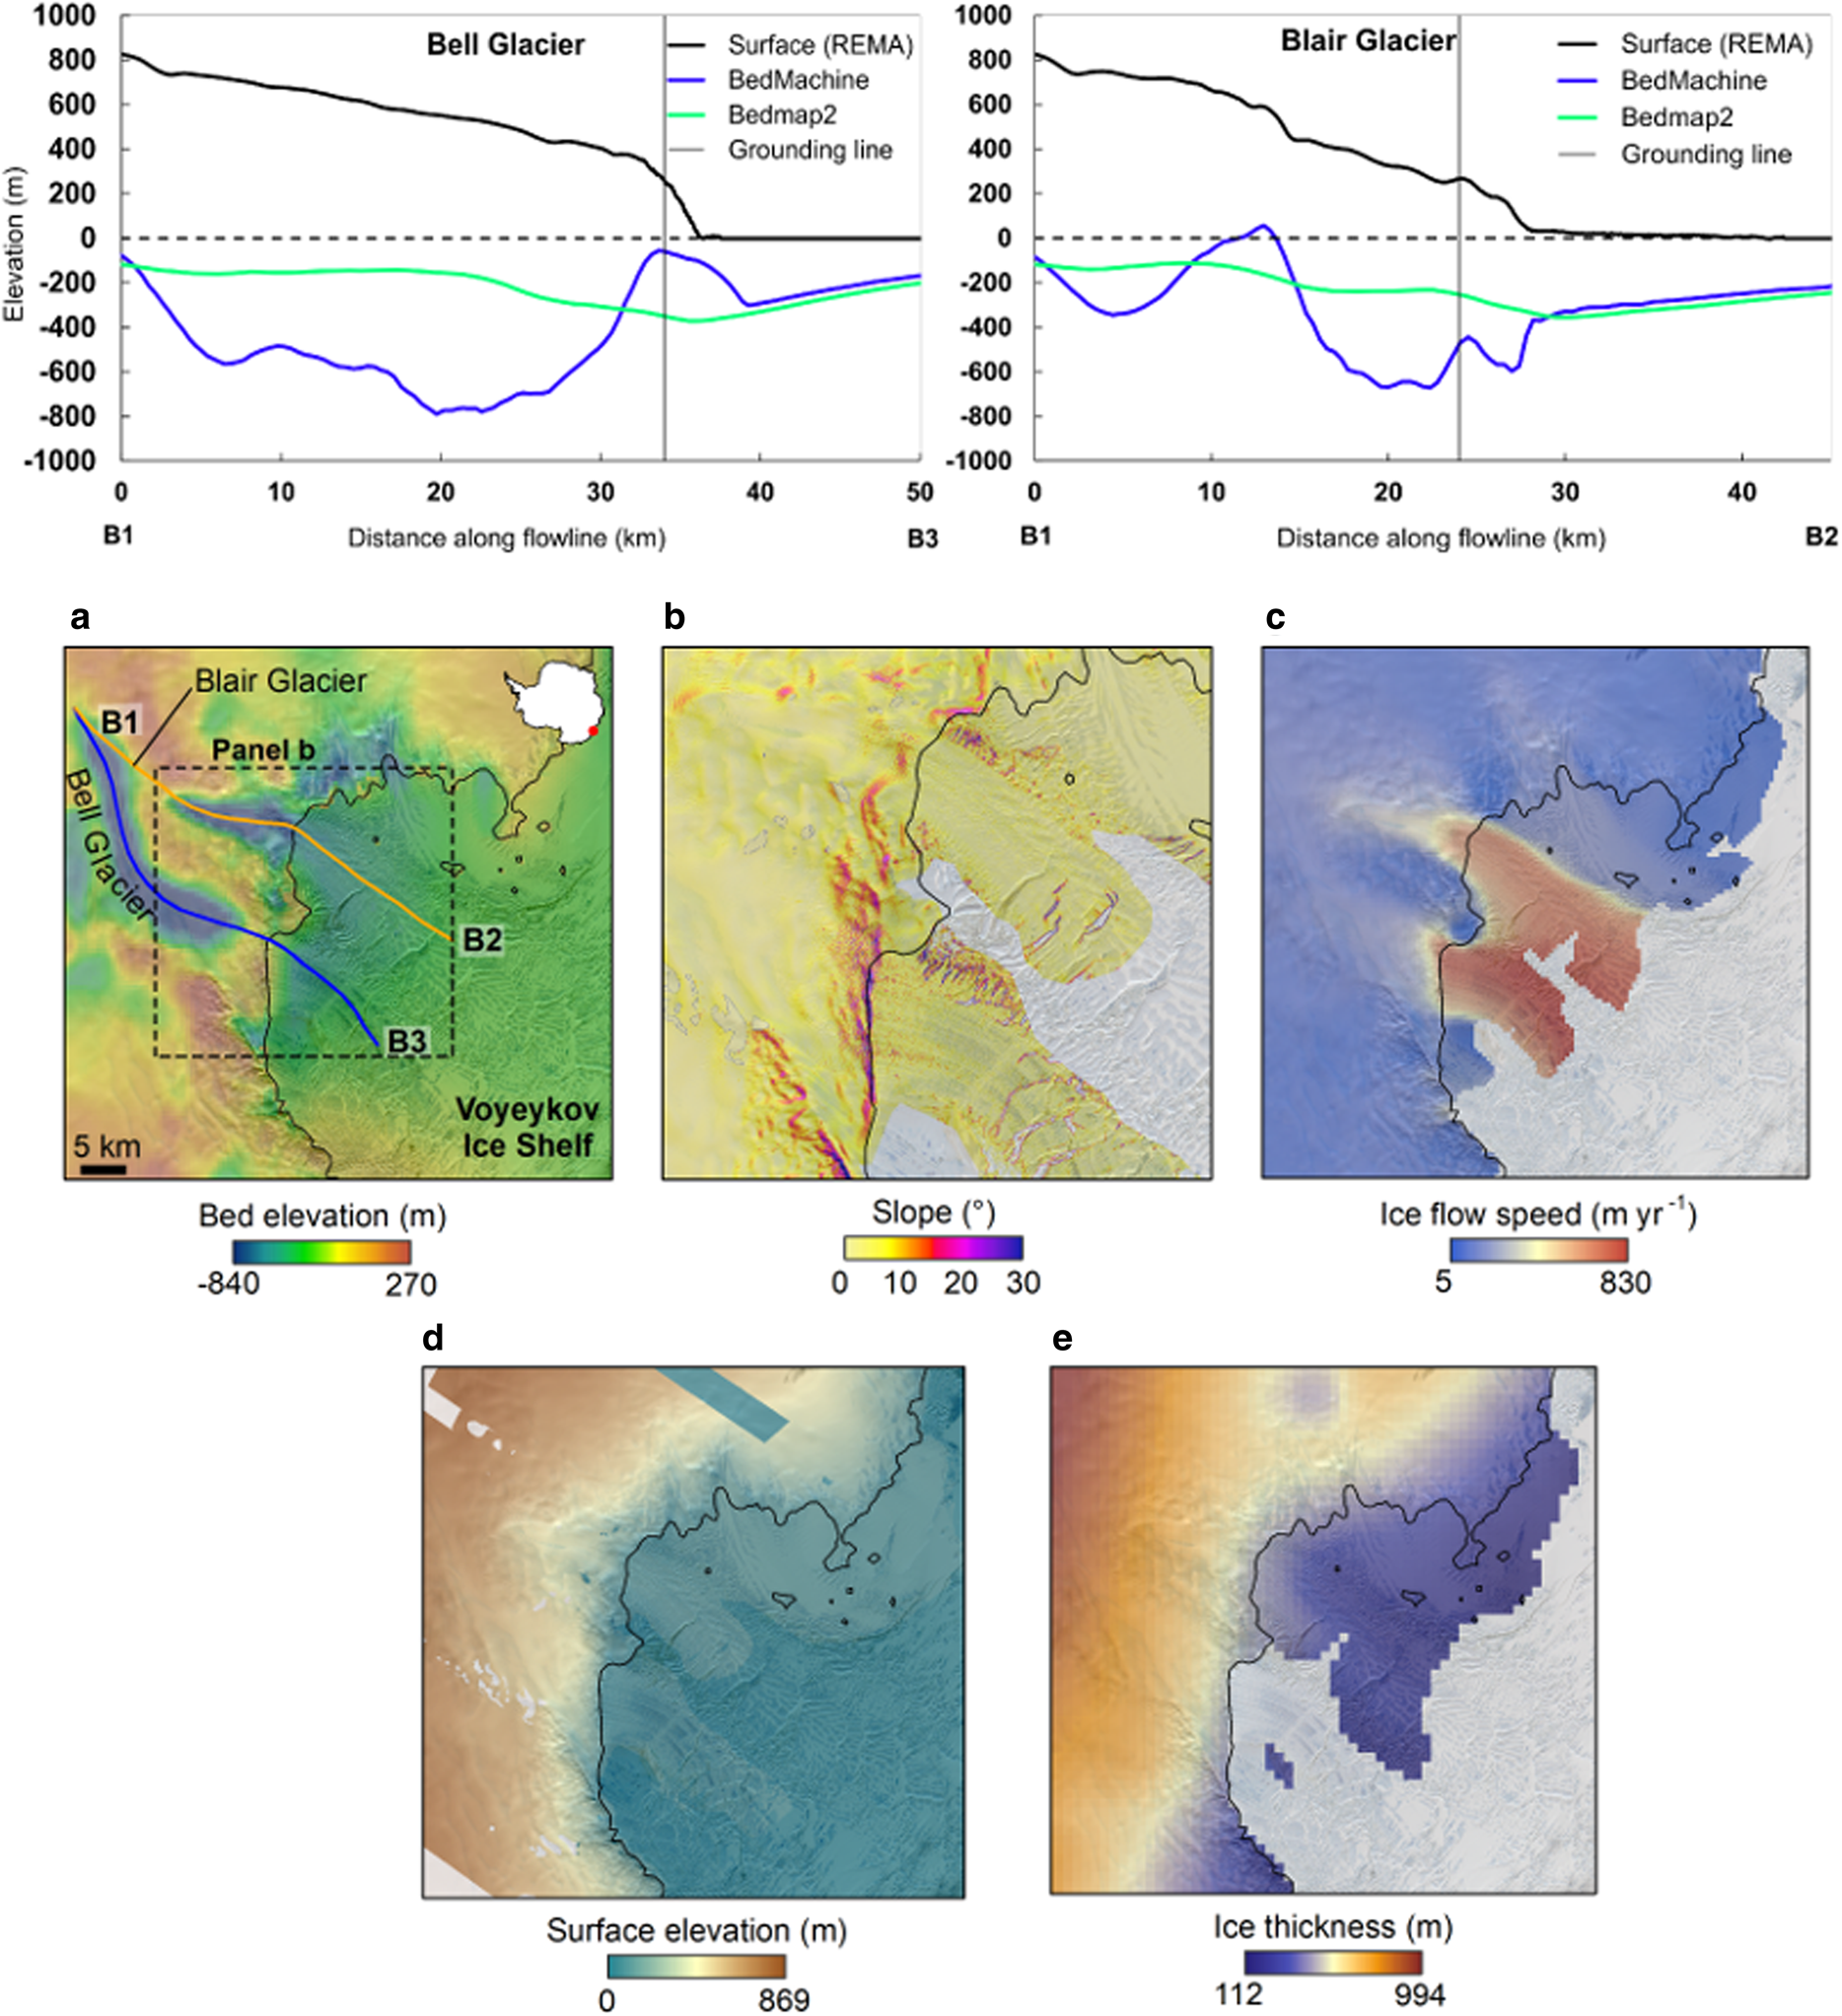
Fig. 2. (a) Cross-profiles of surface elevation (REMA, black) and bed elevation (BedMachine, blue, and Bedmap2, green) through Bell Glacier and Blair Glacier, the two tributary glaciers feeding Voyeykov Ice Shelf. BedMachine elevation is displayed in Panel a. (b) Ice surface slope (generated from REMA); (c) ice flow speed (MEaSUREs); (d) ice surface elevation (REMA); (e) ice thickness (Bedmap2); (f) BedMachine bed elevation error; (g) Bedmap2 bed elevation error.
2.2 Structural mapping (2000–2020)
To determine changes in ice shelf configuration and its structural integrity, structural features were manually mapped in ArcGIS from Landsat-7 and Envisat Advanced Synthetic Aperture Radar (ASAR) Image precision Mode satellite imagery following a similar approach to Holt and others (Reference Holt, Glasser, Quincey and Siegfried2013) and Glasser and Scambos (Reference Glasser and Scambos2008) (Table 1, Table S1). The following ice shelf features were mapped in each image: ice shelf/mélange front, rifts, crevasses and calved detached blocks (Table 1). To provide an independent estimate on ice shelf velocity for comparison with estimates from Inter-mission Time Series of Land Ice Velocity and Elevation (ITS_LIVE) annual velocity mosaics (Gardner and others, Reference Gardner, Fahnestock and Scambos2019) (Section 2.4), the down-ice migration of rifts on the ice shelf was tracked manually by identifying rift tips and calculated annual rates of rift propagation as the change in rift tip position divided by the time between subsequent satellite images. To further constrain the specific timings of disaggregation, MODIS (Moderate Resolution Imaging Spectroradiometer) imagery was also used, though features were not mapped from this imagery owing to its lower (250 m) resolution.
Table 1. Ice shelf features, identifying criteria and significance adapted from Holt and others (2013). See Figure 3 for full structural maps. Examples of ice shelf features from Landsat-7 (left) and Envisat ASAR imagery (right) are provided.
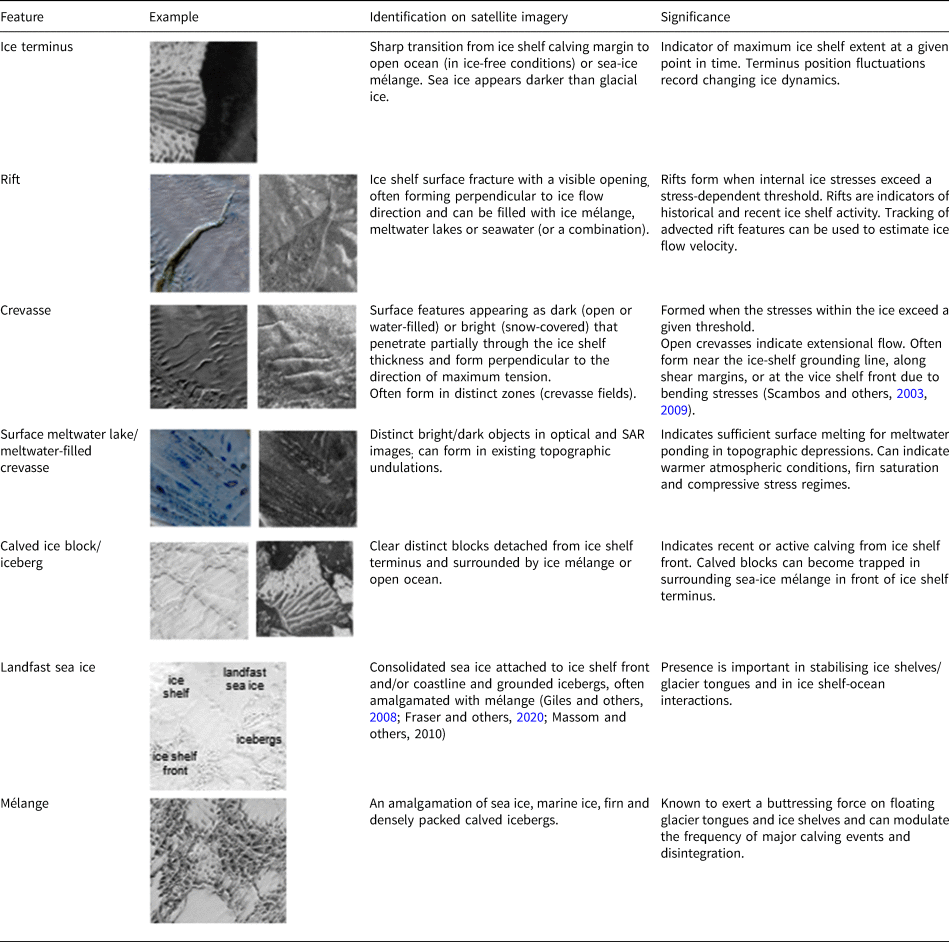
Adapted from Holt and others (Reference Holt, Glasser, Quincey and Siegfried2013). See Figure 3 for full structural maps. Examples of ice shelf features from Landsat-7 (left) and Envisat ASAR imagery (right) are provided.
Areas of landfast sea ice were identified based on commonly accepted criteria, i.e. the ice is consolidated, attached to the ice shelf front and adjacent coastline, and is persistently present in front of the ice shelf, and were verified against recently published maps of landfast sea ice (Table 1, Figs S6, S7, Giles and others, Reference Giles, Massom and Lytle2008; Fraser and others, Reference Fraser, Massom, Michael, Galton-Fenzi and Lieser2012, Reference Fraser2020; Miles and others, Reference Miles, Stokes and Jamieson2017; Li and others, Reference Li2020; Massom and others, 2020). Delineating the boundary between landfast sea ice and mélange is somewhat subjective because the rough surface of deformed MYFI creates high backscatter (Giles and others, Reference Giles, Massom and Lytle2008), making the two difficult to distinguish. The sea ice–mélange boundary was identified by visually distinguishing between textural and brightness differences in SAR imagery. Following previous work, mélange was distinguishable as tightly packed calved ice blocks amalgamated with other calved material, which appear as much brighter (i.e. higher backscatter) in SAR imagery (Gladstone and Rigg, Reference Gladstone and Rigg2002; Fraser and others, Reference Fraser, Massom, Michael, Galton-Fenzi and Lieser2012), whereas landfast sea ice tends to appear more homogeneous and darker (comparatively lower backscatter) (Giles and others, Reference Giles, Massom and Lytle2008; Massom and others, Reference Massom2010).
2.3 Surface meltwater mapping (2000–2020)
Supraglacial lake extents were mapped using the Google Earth Engine cloud computing platform and using Landsat-7 and Landsat-8 scenes automatically downloaded from Google Cloud (accessed via gs://gcp-public-data-landsat/ and gs://gcp-public-data-sentinel-2/). All available imagery over the 2000–2019 austral summers (November to February) were used. The image search was not filtered based on cloud cover, as scenes can contain high cloud cover while still leaving the ice shelf grounding zone visible, where lakes typically form. Only images where the ice shelf was clearly visible were used. Landsat images were Level 1C Tier 1 Top-of-Atmospheric (TOA) reflectance products, meaning they were geometrically-corrected and radiometrically-calibrated, so did not require any further pre-processing. Sentinel 2 imagery was not used due to the extremely low temporal resolution over VIS resulting from frequent extensive cloud cover.
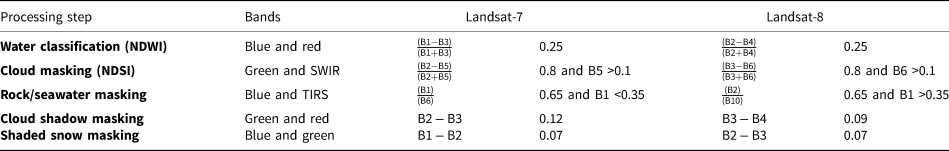
The Normalized Difference Water Index (NDWIice) adapted for ice was used to extract pixels containing liquid water, which uses the red and blue bands (Yang and Smith, Reference Yang and Smith2013). A threshold value of 0.25 was applied, meaning pixels with NDWI >0.25 were assumed to be water-covered, following previous studies (Bell and others, Reference Bell2017; Banwell and others, Reference Banwell, Willis, Macdonald, Goodsell and MacAyeal2019; Arthur and others, Reference Arthur, Stokes, Jamieson, Carr and Leeson2020; Dell and others, Reference Dell2020; Moussavi and others, Reference Moussavi2020). No exposed rock nunataks or outcrops are present in this region and we isolated clouds, cloud shadow, seawater, shaded snow and dark areas (such as crevasses), following Moussavi and others (Reference Moussavi2020) (Table 2). The same thresholds used by Moussavi and others (Reference Moussavi2020) were applied to the imagery, with the exception of a slightly higher cloud masking threshold for Landsat-7 (0.12). After applying these masks, binary masks of ‘water-covered’ (i.e. supraglacial lake) versus ‘non-water covered’ pixels were created for each Landsat-7 and Landsat-8 scene. Each lake mask was manually inspected to verify that no false classifications were included and the total area of water-covered pixels was calculated from the final classification result for each image to produce a time series of surface meltwater extent on the ice shelf from 2000 to 2020. Errors are estimated to be low because the automated cloud, rock and seawater masking were applied to reduce misclassification errors. Moussavi and others (Reference Moussavi2020) found an accuracy of >94% when comparing lake extents derived from the same automated methods with manually digitised polygons. A conservative uncertainty of 1% is therefore assigned to the total lake area for each time step, following Stokes and others (Reference Stokes, Sanderson, Miles, Jamieson and Leeson2019) and Arthur and others (Reference Arthur, Stokes, Jamieson, Carr and Leeson2020).
Table 2. A summary of the processing steps, satellite imagery bands, band calculations and thresholds applied to Landsat-7 and Landsat-8 images for mapping supraglacial lake extents
2.4 Annual velocity fields (2000–2018)
Average annual velocity values were extracted from the NASA Making Earth System Data Records for Use in Research Environments (MEaSUREs) Inter-mission Time Series of Land Ice Velocity and Elevation (ITS_LIVE) annual velocity mosaics (Gardner and others, Reference Gardner, Fahnestock and Scambos2019). These mosaics are available at a spatial resolution of 240 m and surface velocities are derived from Landsat-4, -5, -7 and -8 imagery using auto-RIFT feature tracking (Gardner and others, Reference Gardner2018). Annual velocity mosaics are the error weighted average of all image-pair results with centre dates that fall within a given calendar year. Average annual velocity was extracted from boxes GL (grounding line), UP (up-ice tongue) and DN (down-ice tongue) in Figure 1 to compare changes in annual velocities over the ice shelf grounding line, and the upper and lower portions of Blair Glacier's floating ice tongue. This was done in order to assess whether disaggregation had a dynamic impact on grounded ice upstream of VIS and to assess whether ice close to the calving front has behaved similarly to ice nearer the grounding line. The location and extent of boxes GL, UP and DN were constrained by the data coverage of ITS_LIVE annual velocity mosaics. Data gaps prevented us from extracting velocities over Bell Glacier, or other parts of the ice shelf. Velocity difference maps were generated by subtracting annual velocity mosaics in ArcGIS. Annual mosaics with incomplete coverage over DN (2001, 2002, 2006) were discarded. Data scarcity and/or low radiometric quality are significant limiting factors for many regions in the earlier product years over VIS. Consequently, no velocity data are available for the years 2003–2005. This results in higher velocity errors and lower image-pair counts (i.e. the number of velocities used in the weighted average) in earlier years. To assess errors, minimum and maximum values of image-pair count and velocity error provided with each annual mosaic were extracted from boxes GL, UP and DN (Tables S2–4). Gardner and others (Reference Gardner, Fahnestock and Scambos2019) suggest that errors provided with the mosaics should be used as qualitative metrics only, and therefore the conservative approach was taken off using the average maximum velocity errors for each year.
2.5 Ice surface and bed topography
Ice surface topography profiles were extracted from the Reference Elevation Model of Antarctica (REMA) digital elevation model, which has an 8 m resolution and is derived from stereophotogrammetry with optical satellite imagery registered to satellite radar and laser altimetry (Howat and others, Reference Howat, Porter, Smith, Noh and Morin2019). Bed topography profiles were also extracted from the BedMachine (Morlighem and others, Reference Morlighem2019) and Bedmap2 (Fretwell and others, Reference Fretwell2013) datasets. BedMachine has a 500 m horizontal resolution and is derived from mass conservation in this area. Profiles followed the two main outlet glaciers feeding the ice shelf extending ~30 and ~35 km from the grounding line (Fig. 2). Maximum estimated bed elevation error over VIS and adjacent grounded ice is 202 m for Bedmap2 and 89 m for BedMachine, and mean estimated bed elevation errors are 145 and 52 m, respectively (Fig. 2).
2.6 Sea ice (2007)
Average daily sea-ice concentration anomalies (i.e. deviations from the long-term daily average) were calculated offshore of VIS from 2002 to 2011 within a 3290 km2 polygon (red box in Fig. 1). We acknowledge this region includes the area of ice mélange and MYLI, so is likely to capture the disaggregation event itself. Therefore, to examine sea-ice changes more closely in the region of mélange/MYLI compared with drifting pack ice further offshore, we also extracted sea-ice concentrations from a 1032 km2 box immediately in front of VIS and from a 4420 km2 box in the region of drifting pack ice ~37 km offshore (Fig. S8). The extent of this larger box was determined by the spatial limit of the AMSR-E data. Daily sea-ice concentrations from Spreen and others (Reference Spreen, Kaleschke and Heygster2008) were used, which are derived from the ARTIST Sea Ice (ASI) algorithm applied to microwave radiometer data of the Advanced Microwave Scanning Radiometer – EOS (AMSR-E) sensor on the NASA satellite Aqua. This AMSR-E data covers the period 2002–2011. These data are available at 6.25 km, daily resolution and extend directly to the ice shelf front, unlike coarser temporal and spatial resolution products, such as Nimbus-7. The sensor measures the brightness temperature (i.e. microwave radiance), which is converted to sea-ice concentration by applying the ASI algorithm. The absolute error at 0% sea-ice concentration is 25%, decreasing to 5.7% at 100% sea-ice concentration, and for sea-ice concentration above 65%, the error is <10% (Melsheimer, Reference Melsheimer2019). Error reduction at higher sea-ice concentrations can be attributed to the reduced influence of open water or high cloud liquid water (atmospheric opacity) on the measured brightness temperature (Spreen and others, Reference Spreen, Kaleschke and Heygster2008). The ASI algorithm uses a weather filter process method to remove spurious ice concentration close to open water (Spreen and others, Reference Spreen, Kaleschke and Heygster2008).
2.7 ERA5 surface air temperature and wind speed and direction (2000–2020)
The nearest automatic weather station is 505 km away from VIS, and so daily average 2 m near-surface air temperature from the European Centre for Medium-Range Weather Forecasts ERA5 reanalysis was used, which is provided at 0.25 degree (~31 km) daily resolution. Daily average near-surface air temperature was extracted for austral summers 2000–2019 from within a 1480 km2 polygon over the ice shelf and its grounding zone (Fig. 1). Mean monthly wind fields were calculated by using the ERA5 daily average 10 m zonal (U) and meridional (V) wind stress components to derive wind speed (W spd = U 2 + V 2) and wind direction (W dir = tan−1(−U, −V)180/π). Mean monthly wind fields were also used to derive mean monthly ERA5-derived wind speed and direction anomalies relative to the 2000–2020 monthly means over the ice shelf region from the red box in Figure 1. ERA5 has been shown to be accurate in reproducing local climate variability and prevailing wind regimes on the Antarctic Peninsula, with only a small negative bias in near-surface air temperature and wind speed (Tetzner and others, Reference Tetzner, Thomas and Allen2019; Bozkurt and others, Reference Bozkurt2020).
2.8 Surface melt rates (2000–2019)
Mean modelled snowmelt was extracted over the ice shelf from daily surface melt flux outputs for the period 2000–2019 generated by the Regional Atmospheric Climate Model (RACMO) version 2.3p1, which has a horizontal resolution of 27 km. These melt fluxes represent the production and presence of melt on the ice shelf surface, not the fate of melt (refreeze or runoff) (Trusel and others, Reference Trusel, Frey, Das, Kuipers Munneke and van den Broeke2013). Full details of the model can be found in Van Wessem and others (Reference Van Wessem, Van De Berg, Noël, van Meijgaard and Amory2018). RACMO2.3 has been shown to realistically simulate the surface mass balance of East Antarctica (van Wessem and others, Reference Van Wessem2014). At this resolution, RACMO2.3 is known to be unable to fully resolve localised atmospheric processes around ice shelf grounding zones, including katabatic winds and enhanced turbulent mixing, but higher resolution model outputs are not yet available for this region of East Antarctica (Van Wessem and others, Reference Van Wessem, Van De Berg, Noël, van Meijgaard and Amory2018; Arthur and others, Reference Arthur, Stokes, Jamieson, Carr and Leeson2020).
3. Results
3.1 Structural evolution before, during and after the 2007 disaggregation
Structural changes in the ice shelf both prior to (December 2001 to February 2007) and after the disaggregation event (April 2007 to April 2020) are shown in Figures 3 and 4. In 2001, well-established rifts up to 7 km wide dominated the central portion of VIS as far as ~25 km inland from the ice shelf calving front (Figs 3b, 4a–e). These rifts are mostly transverse (perpendicular to flow), filled with mélange, MYLI and snow, and are present in all pre-disaggregation images of VIS. We note MYLI surrounding Maury Bay was in a partially fractured state in MODIS imagery from March 2006. Fractures in the MYLI and mélange are visible in a MODIS image captured on 7 April 2006 and correspond with the later position of the calving front post-disaggregation. By November 2006, some of the major rifts had widened by over 1 km and had propagated up to 4 km across the lower portion of VIS, producing large ice blocks bound together by MYLI (Fig. 3c). In January and February 2007, we note the formation of open marine water-filled rifts up to 4 km long in the MYLI close to the calving/mélange front (Figs 3d, e). Our mapping showed that meltwater lakes and areas of meltwater-filled crevasses have almost exclusively been confined to Bell Glacier tongue (Figs 4b, c). Between 8 and 15 January 2007, lakes became more extensive (Figs 4c, d), but we did not record any large zones of meltwater-filled crevasses on or within the major rift system on the central portion of VIS. We note this is likely to reflect the routing of surface meltwater into these rifts on VIS.

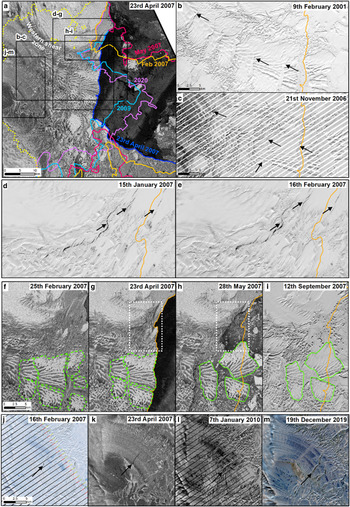
Fig. 3. Structural transition of Voyeykov Ice Shelf (VIS). (a) Ice shelf calving front/mélange extents from 2007, 2009 and 2020 overlain on an Envisat ASAR image from 23 April 2007. The grounding line (dashed yellow line) is from the MEaSUREs dataset (Rignot and others, Reference Rignot, Mouginot and Scheuchl2017). (b–c) Landsat-7 images showing rift widening and propagation in the central portion of VIS between 2001 and 2006. (d–e) Landsat-7 imagery showing multiyear landfast sea-ice rifting and weakening prior to disaggregation in April 2007. (f–i) Envisat ASAR and Landsat-7 imagery showing removal of ice mélange from near the calving front in the western shear zone following major terminus retreat, resulting in detachment and rotation of large ice blocks and further ice shelf disaggregation. The white dashed box highlights the area of mélange removal. Ice blocks before and after detachment are highlighted by green dashed and solid lines, respectively. The April 2007 terminus position is marked by an orange line. (j–m) Landsat-7, Envisat ASAR and Landsat-8 imagery showing the progressive structural weakening of Bell Glacier, eastern VIS and widespread supraglacial lakes and meltwater-filled crevasses. Surface meltwater is also visible on the surrounding mélange. In Panels b–c and h–m, the black arrows point to the development of rifts in each image. The locations of Panels b–m are marked in Panel a.
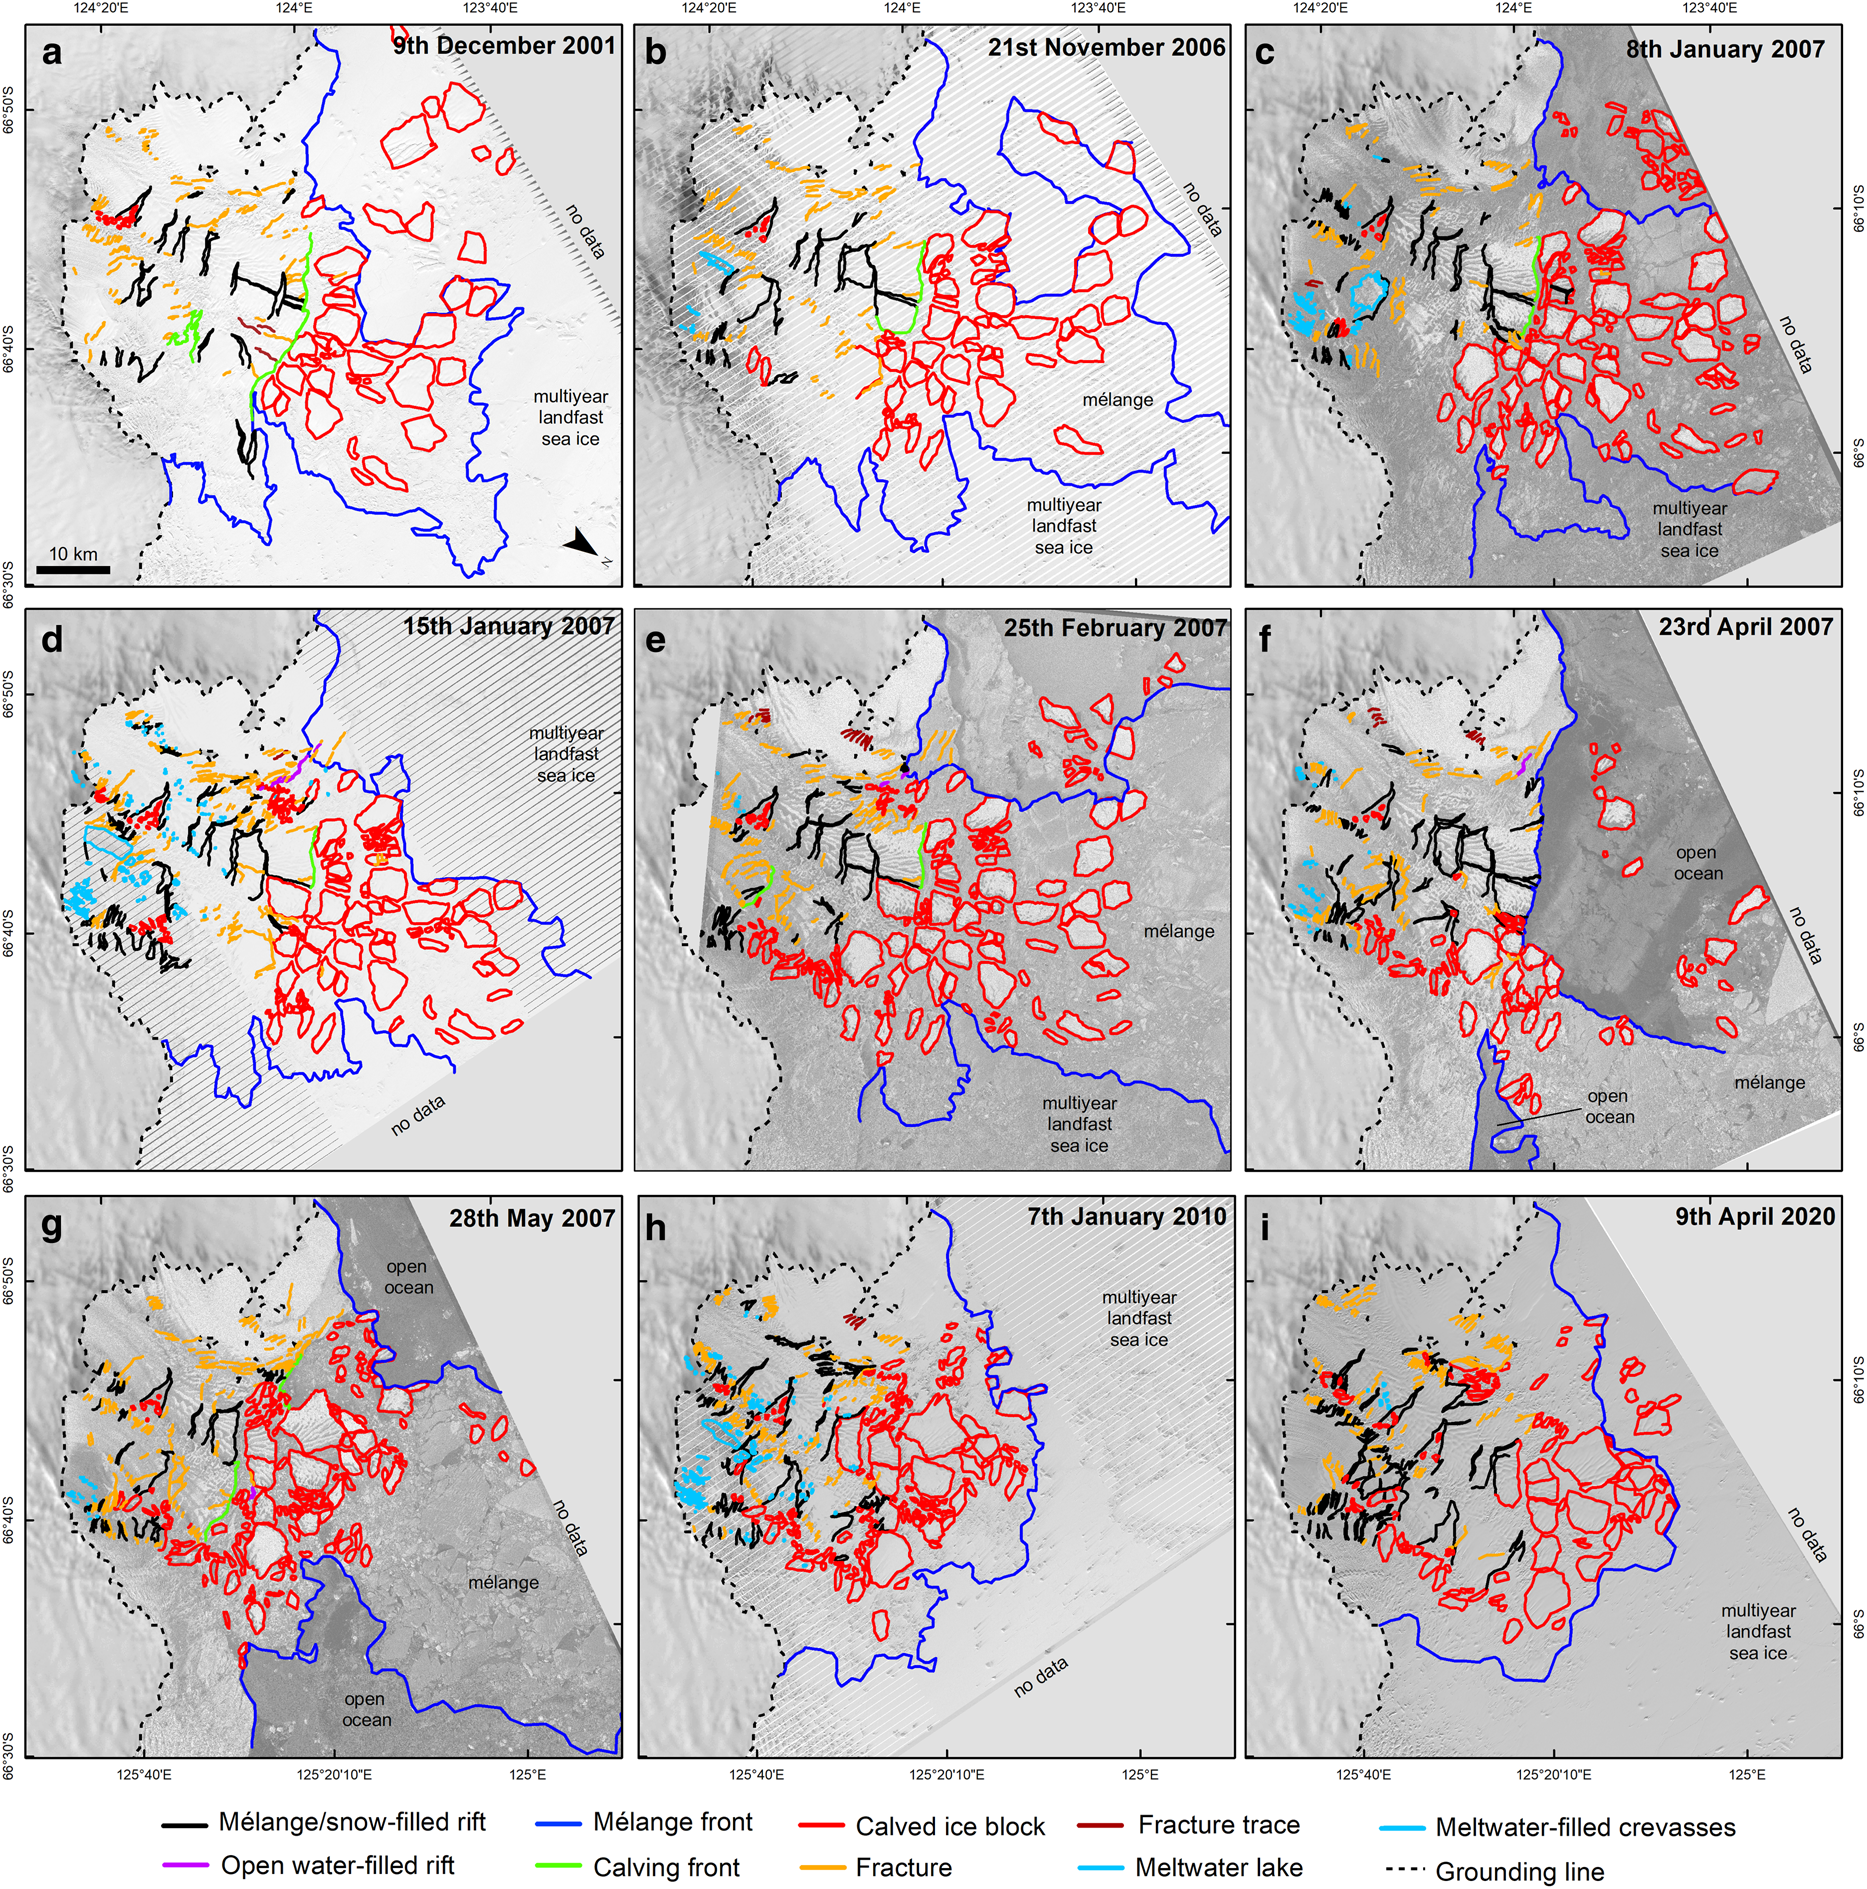
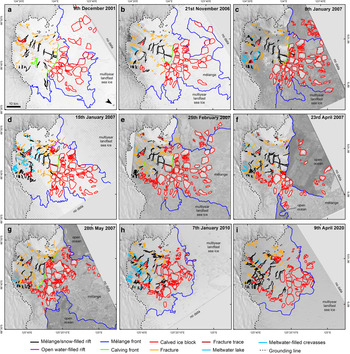
Fig. 4. Structural ice shelf analysis pre- (a–e) and post- (f–i) disaggregation between 2001 and 2020 mapped from Landsat-7 and Envisat ASAR images. Note the continued presence of mélange which cemented together large detached ice blocks with VIS in the years prior to disaggregation (a–e), and the major rifts which widened and propagated across the lower portion of VIS by January 2007 (a–d). Disaggregation in May 2007 followed this pre-existing rift network, when large blocks (up to 47 km2) detached from the ice shelf (g). Since disaggregation, mélange continues to bind the ice shelf and remnant calved blocks (h–i). Panels f and g are outlined in bold to highlight the disaggregation event.
The disaggregation event occurred between 27 March and 2 April 2007 and removed ~2225 km2 of ice. It was characterised by the evacuation of pre-calved blocks and surrounding mélange from in front of VIS into the open ocean (Figs 3f–i). By 28 May, large blocks (up to 47 km2) detached from the calving front following pre-existing interconnected rifts on the lower portion of VIS, causing a loss of 220 km2 from the ice shelf (Figs 3h, 4f, g). This loss of ice appears to have been initiated by the removal of part of the ice shelf and mélange near the calving front in the WSZ (Figs 3e, f). In the post-disaggregation image acquired from September 2007, disaggregation had ceased and no further major calving events had taken place (Fig. 3i). We recorded further fracturing and propagation of a rift network on Bell Glacier's lower tongue into discrete blocks bound by mélange (Figs 3j–m). The majority of the mélange-bound material produced during the 2007 disaggregation appears to have remained in place until present (i.e. April 2020, Figs 4g–i). We did, however, observe a continued loss in structural integrity in the WSZ, as indicated by the opening of a large transverse rift on the lower portion of VIS near the calving front and the production of new fractured icebergs (Fig. 4i). In summary, our observations indicate that the disaggregation of ice mélange adjoining VIS and partial ice shelf loss involved a total loss of ~2445 km2 and was preceded by major rift widening and propagation. Since the event, there is evidence of ongoing fracturing, rifting and calving front advance on the main portion of the ice shelf.
3.2 Annual ice velocity variations
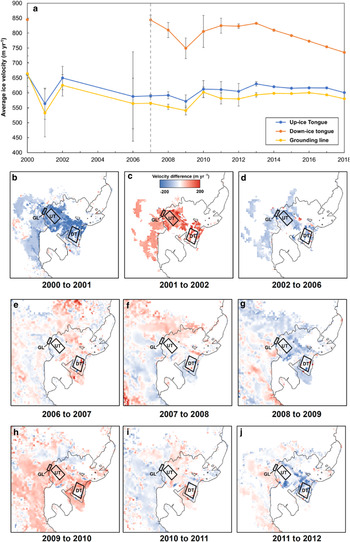
Between 2000 and 2007, no significant (i.e. greater than maximum estimated errors) changes in ice flow velocity on the upper tongue of Blair Glacier nor at the grounding line (Fig. 5a; see Tables S2–4 for errors). We noted higher maximum velocity magnitude errors (up to ±35%) during this period due to low image counts (i.e. the number of velocities used in the ITS_LIVE weighted averages). Gaps in ITS_LIVE data unfortunately prevented us from assessing ice flow velocity changes on Bell Glacier tongue, as well as on the distal portion of Blair Glacier tongue prior to 2007. However, results from manual rift tracking generally show comparable ice flow velocity to those extracted from ITS_LIVE annual velocity mosaics (Fig. S2, Table S5), and the distal part of Blair Glacier tongue pre-2007 decelerated between 2001 and 2006, in agreement with observations closer to the grounding line (Fig. 4a, Table S5). Ice flow velocity on VIS decreased until 2009 following disaggregation in 2007; the distal portion of the ice shelf decelerated by 11% (±3%) and ice closer to the grounding line decelerated by 4% (±2%) (Fig. 5a). Ice flow on the distal portion of its tongue steadily decreased from 2013 until 2018 (Fig. 5a).

Fig. 5. (a) Average ice velocity time series between 2000 and 2018 extracted from the grounding line (GL), up-ice tongue (UP) and down-ice tongue (DN). The dashed grey line marks the disaggregation event in 2007. Error bars are maximum ITS_LIVE velocity magnitude errors (Tables S2–4). (b–j) Velocity differences between annual ITS_LIVE velocity mosaics on Voyeykov Ice Shelf between 2000 and 2012. Annual velocity mosaics are the error weight average of all image-pair results with centre dates that fall within a given calendar year. Black boxes mark the locations where average annual velocity was extracted (Panel a). No velocity data are available covering the eastern portion of the ice shelf fed by Bell Glacier.
Although the overall picture is one of deceleration, isolated areas of acceleration extended to the calving front between 2006 and 2007, as well as a band of flow acceleration (up to 115 m a−1) along the WSZ between 2007 and 2008 (Figs 5e, f). Two further periods of acceleration occurred across the central portion of VIS and upstream of the grounding line between 2009 and 2010, which accelerated by 7% (±4%) and by 11% (±2%), respectively, and between 2012 and 2013 (Fig. 5h; Fig. S1). However, these were short-lived and were not associated with any significant calving or disaggregation events. We suggest this acceleration could be related to the gradual dispersal of mélange and large calved ice blocks away from the VIS calving front. In other years, changes in ice flow velocity were more mixed, with areas of deceleration and acceleration (Figs 5d–j; Fig. S1). In summary, our observations recorded no significant ice flow velocity acceleration in the years immediately prior to or following the disaggregation event.
3.3 Variability in atmospheric and sea-ice conditions
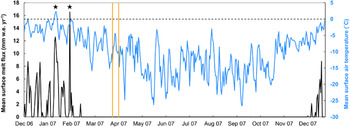
Between 2000 and 2006, several short-lived (<7-day) high magnitude (>12 mm w.e. a−1) melt events were simulated by RACMO2.3 during the summer melt seasons (Fig. S4). Prior to disaggregation, two short-lived (4-day and 3-day) intense (12.6 and 16.5 mm w.e. a−1) melt events were simulated by RACMO2.3 on 11 January and 30 January 2007, which corresponded with a 0.5–3.7°C increase in mean near-surface air temperature over the same period (Fig. 6). We define the start of both melt events as being from when mean surface melt was 0 mm w.e. a−1 until when it peaked, meaning the first melt event was between 8 January (−1.7°C) and 11 January (2.0°C), i.e. a 3.7°C warming. Similarly, this means the second melt event was between 28 January (−2.1°C) and 30 January (−1.6°C), i.e. a 0.5°C warming. We recorded more extensive supraglacial lake coverage during the 2006–2007 austral summer, when total lake area was >1σ higher than the 2000–2020 mean (Fig. 7). During this melt season, several lakes drained englacially into the firn or through the ice shelf over a 1-month period while neighbouring lakes grew or did not change in area (Fig. S3). Since 2007, near-surface air temperature and surface melt have generally remained low (≤12 mm w.e. a−1, fewer than 10 days >0°C per melt season) (Fig. S4). Our supraglacial lake data recorded peaks in total lake area during the 2013–2014 and 2019–2020 melt seasons, when total lake area exceeded 2σ from the 2000–2020 mean (Fig. 7). We note that total lake area is considerably less than on other Antarctic ice shelves (Fig. 7; Stokes and others, Reference Stokes, Sanderson, Miles, Jamieson and Leeson2019; Arthur and others, Reference Arthur, Stokes, Jamieson, Carr and Leeson2020; Dell and others, Reference Dell2020), and has not exceeded 9 km2 since 2000 (<1% of the ice shelf area), though this partly reflects both the small total ice shelf area and its heavily rifted surface through which meltwater can drain before it can accumulate as lakes. In summary, during the 2006–2007 melt season preceding disaggregation, VIS experienced short-lived intense surface melting and above-average supraglacial lake coverage, though surface meltwater does not accumulate extensively on VIS.

Fig. 6. Time series of mean average surface melt flux (RACMO2.3) and near surface air temperature (ERA5) for the period 1 December 2006 to 31 December 2007. The orange bars indicate the time period during which the 2225 km2 disaggregation occurred (27 March–4 April) based on cloud-free MODIS imagery, though we note that the ice shelf continued to disaggregate in May. The two short-lived intense surface melt events are marked with a black star. Similar magnitude surface melt events are simulated by RACMO2.3 in other melt seasons, including 2004, 2005 and 2006 (Fig. S4).

Fig. 7. Evolution of total supraglacial lake area from 2000 to 2020 on Voyeykov Ice Shelf. The dashed grey line marks the disaggregation event in 2007.
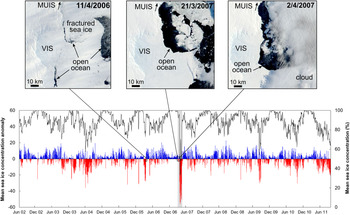
Our analysis of daily sea-ice concentration anomalies (from the red box in Fig. 1) from June 2002 to September 2011 revealed lower-than-average mean sea-ice concentrations in the autumn-winter (March to August) of 2004 and 2011, and the winter-spring (June to November) of 2005 and 2010 (Fig. 8). Notably, we observed a major negative sea-ice concentration anomaly between the end of March and the end of April 2007, when mean April sea-ice concentration deviated by 33% from the long-term (2002–2011) April average (Fig. 8; Fig. S8). This negative anomaly coincided with MYLI breakout and the transition from mélange to open-ocean in front of VIS visible in MODIS and Envisat SAR imagery in April 2007 (Figs 2, 3, 8). Indeed, both the mélange/MYLI and the drifting pack ice further offshore experienced a sharp decline after 30 March, returning to concentrations above 90% by 27 April (Fig. S8). MYLI breakout was short-lived and was preceded and followed by greater-than-average mean sea-ice concentrations in March and May 2007 (Fig. 8). The increase in mean sea-ice concentrations in May corresponds with further disaggregation, when the bay became choked with large, calved blocks and mélange (Figs 3g, 8). MODIS imagery also shows that the MYLI surrounding VIS was in a fractured state in the preceding year in April 2006 (Fig. 8). ERA5 wind field estimates suggest a shift from southerly to south-easterly prevailing winds between March and May 2007 offshore from VIS (Fig. 9), though mean wind speed and direction over VIS were close to average during these months (Fig. 10). We note, however, strong south-easterly winds in the preceding winter (July–August 2006; Fig. 10). In summary, we recorded a strong temporal coincidence between a major reduction in MYLI and disaggregation and removal of ice mélange which was followed by partial loss of the ice shelf.

Fig. 8. Mean daily sea-ice concentration anomalies (deviations from the long-term (2002-2011) daily mean) extracted from a 70 km × 46 km box extending 42 km offshore from the ice shelf (see Fig. 1). Positive anomalies are shown in blue and negative anomalies are shown in red. Ice shelf disaggregation (indicated by the grey bar) coincides with a substantial negative sea-ice concentration anomaly. The black line represents a 5-day moving average of daily mean sea-ice concentration. Three example MODIS images show multiyear landfast sea ice was already in a weakened state in 2006, and the breakup of sea ice which expanded eastward from Moscow University Ice Shelf (MUIS) towards Voyeykov Ice Shelf (VIS), leading to its disaggregation in March–April 2007.

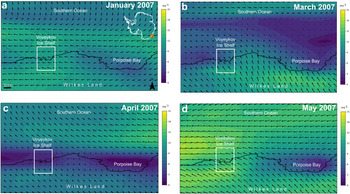
Fig. 9. Mean monthly ERA5-derived wind speed and direction in the region of Wilkes Land covering Voyeykov Ice Shelf (white box) in the months preceding disaggregation (a–b) and during disaggregation (c–d). Wind direction vectors are represented by the black arrows. Note the shift to south-easterly prevailing winds offshore of VIS in May 2007.

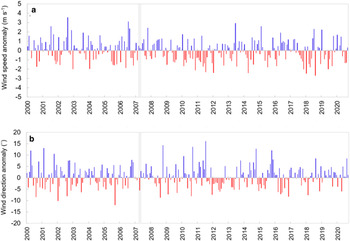
Fig. 10. (a) Mean monthly ERA5-derived wind speed anomalies (deviations from the 2000–2020 monthly mean) extracted over Voyeykov Ice Shelf (red box in Fig. 1). (b) Mean monthly ERA5-derived wind direction anomalies (deviations from the 2000–2020 monthly mean) extracted from the same region. Wind directions vary between 92° (easterly, i.e. blowing from the east) and 122° (south-easterly) over this 20-year period within this region. The period of ice shelf disaggregation is shaded in grey in both plots. Note anomalies calculated over the wider region area (a 26 000 km2 polygon extending 100 km offshore) were of the same magnitude and variability.
4. Discussion
4.1 What caused the April–May 2007 disaggregation event?
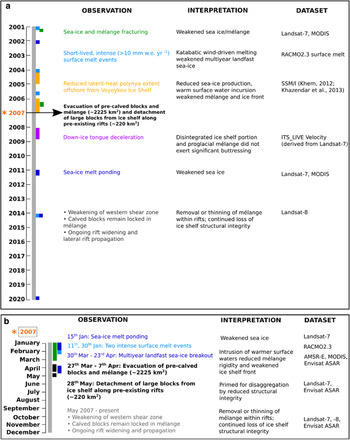
Figure 11 summarises the chronology of changes on the VIS in the 7-year period leading up to the disaggregation event, its evolution post-disaggregation and the potential forcings. We now consider the structural precursors to the disaggregation, followed by the role of these forcings in triggering the break-up. We then discuss the evolution of the ice shelf post-disaggregation and the implications for its future stability.

Fig. 11. Schematic timeline of major events discussed in the text. Coloured bars on the timeline represent observations before, during and after the ice-shelf disaggregation event. All observations are from this study unless otherwise cited.
4.1.1 Structural precursors to the disaggregation event
Our observations show that extensive ice shelf rifting played an important role in increasing the susceptibility of VIS to disaggregation in March–May 2007. Major rifts have been present on VIS since the beginning of our observation period in 2000 (Figs 2, 3). Between December 2001 and April 2007, we recorded widening and propagation of some of these major transverse rifts on the main portion of VIS, but do not observe substantial increases in the total number of rifts (Figs 3, 4). Although rifts within the ice shelf are likely to have widened and lengthened over time as VIS advanced, we speculate that rift widening could be as a result of weakening of the ice mélange within these rifts and with it the resistance for rifts to propagate laterally. Rift enlargement and propagation has been attributed to the weakening and/or removal of stabilising mélange on the Brunt-Stancomb Wills Ice Shelf (Khazendar and others, Reference Khazendar, Rignot and Larour2009) and George VI Ice Shelf (Holt and others, Reference Holt, Glasser, Quincey and Siegfried2013). Similarly, mélange thinning from atmospheric or oceanic melting has been linked to rift propagation on the Ronne Ice Shelf (Larour and others, Reference Larour, Rignot and Aubry2004). At the same time, ice flow velocity did not change significantly on VIS nor at the grounding line (Fig. 5). This response is consistent with VIS already being in a highly fragmented state (Wearing and others, Reference Wearing, Kingslake and Worster2020). Furthermore, extensional stresses are not conducive to ice shelf ponding because they generate crevasses and fracturing, which route meltwater through the ice shelf before it can pond (Glasser and Scambos, Reference Glasser and Scambos2008). This explains the general absence of melt ponds across the central portion of VIS (Fig. 3).
In contrast to topographically-confined ice shelves, the unconfined geometry of VIS means that it is unlikely to provide substantial buttressing to grounded inland ice (Borstad and others, Reference Borstad2016; Fürst and others, Reference Fürst2016; Wearing and others, Reference Wearing, Kingslake and Worster2020). While VIS did not display any structurally unusual behaviour before it disaggregated, this contrasts with previous ice-shelf break-ups on the Antarctic Peninsula (Scambos and others, Reference Scambos, Hulbe, Fahnestock and Bohlander2000, Reference Scambos, Bohlander, Shuman and Skvarca2004, Reference Scambos2009; Rignot and others, Reference Rignot2004; Glasser and Scambos, Reference Glasser and Scambos2008; Braun and others, Reference Braun, Humbert and Moll2009). In summary, our observations show that disaggregation was pre-conditioned by the presence of rifts on VIS, causing the detachment of major ice blocks from the ice shelf along these pre-existing weaknesses in April–May 2007. Thus, as a result of its unconfined setting, the reduced structural integrity of VIS primed it for rapid disaggregation.
4.1.2 The role of mélange in the disaggregation event
We report the complete removal of ~2225 km2 of mélange adjoining VIS and detached ice blocks from the terminus of VIS in April 2007, which was followed by the loss of 220 km2 from the ice shelf during May 2007 (Figs 2, 3). We suggest the mélange provided some degree of mechanical coupling and enhanced the structural integrity of the ice shelf by filling interconnected rifts and cementing together large, detached ice blocks in the decades prior to disaggregation (Fig. 3). Although there are no long-term observations of mélange thickness or mechanical strength within the rifts in or in front of VIS, the mélange laden with MYLI has advanced as a single cohesive unit with VIS since 2001 (Fig. 4). This coherent advection coupled with the lack of major block rotation prior to May 2007 indicates that the combined ice block-mélange region provides some rigidity and behaves as a mechanically-connected unit, similar to Mertz Ice Tongue and the Brunt Ice Shelf (Massom and others, Reference Massom2010; King and others, Reference King, De Rydt and Gudmundsson2018; Joughin and others, Reference Joughin, Shean, Smith and Floricioiu2020). Furthermore, mélange-filled rifts have been present on VIS since 1989 (visible in Landsat-4 Multispectral Scanner imagery, Fig. S5), so we estimate the mélange to be at least 31 years old in places. For comparison with perennial MYLI elsewhere in East Antarctica, thick (10–35 m) MYLI attached to Mertz Glacier Tongue has been estimated as being up to 35 years old (Massom and others, Reference Massom2010). We suggest that the mélange had sufficient strength to trap large, calved fragments for years before they could be transported away from ice shelf front. InSAR observations show mélange in older rifts is likely to have greater mechanical strength (Rignot and MacAyeal, Reference Rignot and MacAyeal1998). We note that mélange has continued to mechanically bind the ice shelf and remnant calved blocks since disaggregation (Figs 2l, m). Idealised modelling has shown that ice shelves stabilised by the presence of MYLI (such as Thwaites, Mertz and Totten) can provide some limited buttressing as the MYLI may prevent large-scale fracturing and break-up (Wearing and others, Reference Wearing, Kingslake and Worster2020). However, the lack of immediate speed-up after disaggregation indicates the disaggregated portion of VIS and proglacial mélange did not exert a significant buttressing effect and therefore had minimal influence on the dynamics of inland grounded ice (Fig. 5, Fürst and others, Reference Fürst2016). Therefore, we argue that the mélange in front of VIS bound the ice shelf together and prevented it disaggregating prior to 2007, although it did not provide significant buttressing to grounded ice because of its unconfined setting. This is further supported by the lack of velocity acceleration after it disaggregated (Section 3.2, Fig. 4).
The persistence of mélange in front of VIS implies that its presence was key to inhibiting disaggregation prior to April 2007. Our observations suggest the mélange provided long-term stability to VIS until it started to become weakened in the preceding autumn/winter (Fig. 8). This behaviour is similar to other ice shelves and outlet glaciers terminating in tightly-packed mélange in Antarctica and Greenland, which has been shown to inhibit calving events and prevent the detachment of icebergs (Higgins, Reference Higgins1991; Reeh and others, Reference Reeh, Thomsen, Higgins and Weidick2001; Amundson and others, Reference Amundson, Fahnestock, Truffer, Lüthi and Motyka2010; Moon and others, Reference Moon, Joughin and Smith2015; Hill and others, Reference Hill, Carr and Stokes2017; Robel, Reference Robel2017; Burton and others, Reference Burton, Amundson, Cassotto, Kuo and Dennin2018; Schlemm and Levermann, Reference Schlemm and Levermann2020). For example, the continuous presence of mélange bound by MYLI has stabilised Cook West Ice Shelf in East Antarctica and enabled it to slowly advance following its near-complete loss between 1973 and 1989 (Miles and others, Reference Miles, Stokes and Jamieson2018). Similarly, Rott and others (Reference Rott2018) recorded lower calving rates in the Larsen A and Larsen B embayments during years with persistent ice mélange. In west Greenland, seasonal mélange formation and break-up in front of floating ice tongues has been linked to large calving and disaggregation events, such as the break-up of Jakobshavn Glacier floating tongue in 2009 (Amundson and others, Reference Amundson, Fahnestock, Truffer, Lüthi and Motyka2010; Cassotto and others, Reference Cassotto, Fahnestock, Amundson, Truffer and Joughin2015). The presence and break-up of mélange has also been found to control the seasonality of calving, terminus positions and glacier velocities in northwest Greenland (Moon and others, Reference Moon, Joughin and Smith2015). In contrast, the persistence of mélange and perennial MYLI in front of VIS for decades until break-up in 2007 indicates its weakening and removal played an important role in disaggregation (Figs 3, 4, 8, S5). Given that mélange is highly sensitive to climatic changes (Cassotto and others, Reference Cassotto, Fahnestock, Amundson, Truffer and Joughin2015; Miles and others, Reference Miles, Stokes and Jamieson2017), we now discuss potential external forcings involved in the break-out event.
4.1.3 Atmospheric forcing as a potential control on the disaggregation event
Surface meltwater on the ice shelf itself does not appear to have initiated the disaggregation of VIS, because supraglacial lakes and meltwater-filled crevasses were confined to Bell Glacier tongue and almost entirely absent from the central trunk of VIS and the surrounding mélange that disaggregated (Figs 3, 4). Furthermore, the timing of mélange disaggregation in the Antarctic autumn means that surface meltwater-induced weakening is unlikely because surface meltwater production is likely to be minimal (Scambos and others, Reference Scambos2009), although warm events have been noted in autumn/winter on the Antarctic Peninsula (Leeson and others, Reference Leeson2017; Kuipers Munneke and others, Reference Kuipers Munneke2018). This is important because the absence of sustained surface melting and extensive surface ponding on VIS demonstrates that surface melt pond-driven hydrofracturing was not a factor in this location and is, therefore, not always a necessary precursor for the rapid disaggregation of floating ice tongues.
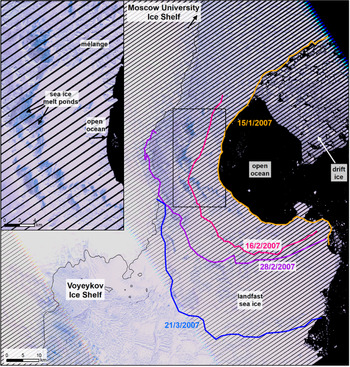
Although unlikely to have been important on the VIS, melt ponds on the adjacent sea-ice and mélange may promote their break-up by lowering their surface albedo, causing them to thin and potentially make them more prone to fracturing and breakout if they flex (Miles and others, Reference Miles, Stokes and Jamieson2017; Macdonald and others, Reference Macdonald, Popovic and Mayer2020). We observed melt ponds on the MYLI between VIS and Moscow University Ice Shelf (MUIS) in January 2007 (Fig. 12), which was followed by a southward migration in MYLI breakout (i.e. an expansion of open-ocean conditions) towards the VIS mélange/calving front in the 3 months prior to its disaggregation (Fig. 12). These sea-ice melt ponds could simply be the result of increased meltwater production driven by warmer surface air temperatures. This is supported by the January near-surface air temperature warming of up to 4°C simulated by ERA5 (Fig. 6). Surface melt ponds on MYLI in the Weddell Sea have also been linked to intense summer warming and surface snowmelt (Drinkwater and others, Reference Drinkwater, Liu and Low1998). However, elsewhere in East Antarctica, surface meltwater production and ponding have been linked to persistent katabatic winds at the grounding line (Lenaerts and others, Reference Lenaerts2017; Arthur and others, Reference Arthur, Stokes, Jamieson, Carr and Leeson2020). Although this may seem counterintuitive because katabatic winds are typically cold (Vihma and others, Reference Vihma, Tuovinen and Savijärvi2011), they increase near-surface temperatures downslope by enhancing turbulent air mixing and lowering humidity as they descend from upslope and warm adiabatically (Lenaerts and others, Reference Lenaerts2017; Stokes and others, Reference Stokes, Sanderson, Miles, Jamieson and Leeson2019; Arthur and others, Reference Arthur, Stokes, Jamieson, Carr and Leeson2020). Indeed, strong katabatic winds are known to occur in this region (Massom and others, Reference Massom, Harris, Michael and Potter1998; Section 4.1.4) and would be expected to trigger short-lived, intense surface snowmelt events, like the two simulated by RACMO2.3 on 11 January and 30 January (Fig. 6). This favours our interpretation that these sea-ice melt ponds could be katabatic wind-induced. We note neither these short-lived melt events nor the presence of sea-ice melt ponds or leads were unprecedented; indeed, similar-magnitude melt events are simulated by RACMO2.3 during the three melt seasons before the 2007 disaggregation event (2004, 2005 and 2006) (Fig. S4), and melt ponds and leads formed on the MYLI in other years (e.g. Figs 1, 9, S5).

Fig. 12. Southward migration of the multiyear landfast sea-ice limit (i.e. expansion of open ocean conditions) in the 3-month period preceding disaggregation of Voyeykov Ice Shelf. Inset shows sea-ice melt ponds, location marked by the black box in the main panel. Background image is a Landsat-7 image from 15 January 2007. Black stripes on the image are data gaps resulting from the failure of the scan line corrector on Landsat-7 on 31 May 2003.
We suggest that katabatic winds together with strong south-easterly winds in the preceding winter (Fig. 10) may have further played a role in weakening the MYLI and blowing it offshore, helping to expose the VIS calving front to warmer ocean conditions (Section 4.1.4). Intensified offshore south-easterly wind anomalies have been linked to MYLI break-out events elsewhere in East Antarctica, such as during June–October 1998 in Adélie Land (Massom and others, Reference Massom2009). Additionally, fractures in the MYLI in front of the terminus (Figs 2d, e) suggest that the MYLI binding the fractured tongue and mélange together was already in a weakened state prior to April 2007 and is therefore likely to have primed the mélange and lower portion of VIS for disaggregation. In summary, the MYLI adjacent to VIS is likely to have been weakened and blown offshore by katabatic winds and strong south-easterly winds in the preceding winter, and may have been weakened by katabatic-induced melt ponding in January 2007.
4.1.4 Sea ice-oceanic forcing as a potential control on the disaggregation event
The coincidence between the major negative sea-ice concentration anomaly adjacent to VIS during April 2007 and the timing of observed disaggregation (Fig. 8) strongly suggests that the disaggregation and removal of mélange and MYLI triggered the partial break-up of VIS. This is supported by our observations from Envisat, Landsat-7 and MODIS imagery (Figs 3g, h, 4, 8) showing ice shelf disaggregation only occurred following MYLI break-out. While we acknowledge that this negative sea-ice anomaly is likely to capture the break-out event itself, the mélange/MYLI experienced a sharp decline to 37.5% on 2 April, returning to concentrations above 90% by 27 April, while the drifting pack ice underwent a smaller decline to 61% (Fig. S8). We suggest this MYLI breakout is likely to relate to changes in the extent of the recurrent latent-heat polynya that is formed offshore of VIS by persistent katabatic winds, which break up the MYLI and facilitate open water expansion (Massom and others, Reference Massom, Harris, Michael and Potter1998; Fraser and others, Reference Fraser, Massom, Michael, Galton-Fenzi and Lieser2012). Latent-heat polynyas are formed by directionally-persistent winds pushing ice away from a barrier (coastline, MYLI, grounded icebergs or an ice tongue), releasing latent heat as water freezes and evaporates (Massom and others, Reference Massom, Harris, Michael and Potter1998). The extent of latent-heat polynyas can be used as a proxy for sea-ice production levels (Tamura and others, Reference Tamura, Ohshima and Nihashi2008; Kern, Reference Kern2009), meaning a less extensive polynya is likely to have lowered sea-ice production, de-stratified the water column and reduced the volume of cooler water reaching the sub-ice-shelf cavity (Khazendar and others, Reference Khazendar2013). Indeed, Khazendar and others (Reference Khazendar2013) recorded declines in the polynya extent offshore of VIS between 2004–5 and 2006–7 of ~1.1–1.2 × 10⁵ km2, although we note the polynya extent remained above pre-2006 levels in 2007. Nevertheless, this relative drop in polynya extent in 2007 may have led to a reduction in sea-ice production offshore of VIS, which would have enabled warmer surface waters to reach the ice shelf. The MYLI breakout we recorded is suggestive of a ‘Mode 3’ heat supply, whereby melting near the ice front is caused by seasonally warmer surface waters entering the near-surface ice shelf cavity, forced by tides and/or seasonal currents (Jacobs and others, Reference Jacobs, Helmer, Doake, Jenkins and Frolich1992). Stern and others (Reference Stern, Dinniman, Zagorodnov, Tyler and Holland2013) linked enhanced melting under McMurdo Ice Shelf to MYLI breakout, whereby the upper ocean layer is warmed by solar heating, transported by ocean currents and intrudes under the ice shelf base. Similarly, Hattermann and others (Reference Hattermann, Nst, Lilly and Smedsrud2012) observed a mode 3 warm water intrusion in front of Fimbul Ice Shelf, associated with ice-free ocean conditions near the ice front. We therefore explain the negative sea-ice anomaly as a consequence of a decline in latent-heat polynya extent, which reduced sea-ice production and enabled the incursion of warmer surface waters to reduce mélange rigidity and weaken the ice front, making it susceptible to disaggregation.
Variations in sub-surface ocean conditions are not accounted for in our data and could also affect mélange stability by causing basal melting and subsequent thinning of the mélange (Greene and others, Reference Greene, Young, Gwyther, Galton-Fenzi and Blankenship2018; Miles and others, Reference Miles2020). However, ocean forcing from greater depths is unlikely to have influenced the 2007 disaggregation, because the bathymetric topography offshore of VIS is not conducive to the delivery of wind-driven modified circumpolar deepwater (mCDW) upwelling to the sub-ice shelf cavity (Greene and others, Reference Greene, Blankenship, Gwyther, Silvano and van Wikj2017). Specifically, the continental slope offshore of VIS is relatively steep and so can block mCDW intrusions (Greene and others, Reference Greene, Blankenship, Gwyther, Silvano and van Wikj2017). Similarly, it is possible that the shift to partially or fully open water offshore of VIS increased the susceptibility of its calving front to ocean swell by removing the protective buffer provided by the MYLI and mélange (Scambos and others, Reference Scambos, Hulbe, Fahnestock and Bohlander2000; Miles and others, Reference Miles, Stokes and Jamieson2017). However, VIS lacked extensive surface flooding and evidence of hydrofracture, which is a key pre-condition for ocean swell-induced disaggregation (Massom and others, Reference Massom2018). Therefore, anomalously low sea-ice conditions associated with a less extensive latent-heat polynya appear to have controlled the timing of warmer surface water delivery which were the key mechanisms for the removal of weakened mélange which triggered the VIS disaggregation.
Stammerjohn and others (Reference Stammerjohn, Maksym, Heil and Massom2011) recorded warm sea surface temperatures and an anomalously late sea-ice advance in May–September 2007 following an unusually long ice-free summer period (December 2006–March 2007) and early sea-ice retreat the preceding spring (September 2006–November 2006) offshore of VIS, MUIS and Totten Glacier. An unusually long ice-free summer and delayed autumn sea-ice advance suggest there were open-ocean conditions in the MYLI region adjacent to VIS and is consistent with solar ocean warming (Jacobs and others, Reference Jacobs, Helmer, Doake, Jenkins and Frolich1992; Stammerjohn and others, Reference Stammerjohn, Maksym, Heil and Massom2011). These anomalous sea surface conditions were likely triggered by a regional atmospheric circulation anomaly (i.e. a substantial deviation relative to mean (1979–2007) conditions) associated with a deep low-pressure system that strengthened easterly winds and weakened prevailing westerly winds, allowing the advection of warmer maritime air which caused a significant deviation from the longer-term trend in a positive SAM index (Marshall, Reference Marshall2003; Stammerjohn and others, Reference Stammerjohn, Maksym, Heil and Massom2011; Miles and others, Reference Miles and Stokes2013; Miles and others, Reference Miles, Stokes and Jamieson2017). This regional anomaly is likely part of the same anomalously warm conditions that contributed to the simultaneous break-up of outlet glacier tongues in Porpoise Bay (Miles and others, Reference Miles, Stokes and Jamieson2017). We speculate that the delayed disaggregation of VIS compared to glaciers in Porpoise Bay relates to differences in ice shelf geometry. VIS occupies a more sheltered embayment which is choked with plentiful grounded icebergs, allowing thicker MYLI to persist year-round in front of the ice shelf (Massom and others, Reference Massom, Harris, Michael and Potter1998, Reference Massom2010; Giles and others, Reference Giles, Massom and Lytle2008; Fraser and others, Reference Fraser, Massom, Michael, Galton-Fenzi and Lieser2012). Thus, its geometry could make MYLI harder to remove and therefore could have delayed MYLI breakout which eventually triggered disaggregation.
4.2 Ice shelf evolution post-disaggregation
The significant decrease in ice flow velocities between 2007 and 2009 on the distal portion of VIS (Fig. 5) implies the buttressing provided by the disaggregated portion of VIS and mélange was low (Fürst and others, Reference Fürst2016; Miles and others Reference Miles2020; Schlemm and Levermann, Reference Schlemm and Levermann2020). Comparing the spatial pattern in velocity differences before and after the disaggregation event, we record a band of flow acceleration (up to 115 m a−1) along the WSZ between 2007 and 2008 (Figs 5e, f). The cause of the increase in ice flow velocity is unclear, though it could be related to weakening and increased shearing within this WSZ, which is stabilised by several small pinning points (Miles and others, Reference Miles2020). Since 2007 we recorded continued ice front advance, rift propagation across the main portion of VIS and weakening of the WSZ, but no further major disintegration events are visible in available satellite imagery (Figs 3, 4). The period of acceleration between 2009 and 2010 on the ice shelf extending past the grounding line is difficult to explain, though our observations indicate this could be related to the increased distribution and extent of rifts and fractures and continued shear margin weakening (Fig. 4). The gradual decrease in ice flow velocity on the distal part of VIS since 2013 despite continued fracturing and rift propagation suggests VIS has not experienced a large-scale stress redistribution during this period (Scambos and others, Reference Scambos2009).
Our observations show that VIS retains a strong dependency on mélange and MYLI for its structural integrity, though it does not show signs of imminent disaggregation. In this respect, VIS resembles the present state of outlet glaciers in Porpoise Bay and the heavily fractured glacier tongues in the West Antarctic Amundsen Sea sector, such as Thwaites Ice Tongue (Miles and others, Reference Miles, Stokes and Jamieson2017, Reference Miles2020). This poses the question of whether this process will become more important to understand in future, as other Antarctic ice shelves reach a more damaged state. Large amounts of mélange could be generated by the retreat of vulnerable marine-based ice shelves into unconfined embayments in future (Pollard and others, Reference Pollard, DeConto and Alley2018). Damaged areas on Thwaites and Pine Island Glaciers are already generating mélange (Lhermitte and others, Reference Lhermitte2020) and the rapid retreat and structural weakening of Thwaites Glacier Tongue has been accompanied by a transition from a structurally-intact tongue to a mélange bound by landfast sea ice (Miles and others, Reference Miles2020), bearing strong similarities to Voyeykov. Elsewhere in East Antarctica, mélange and MYLI already provide a stabilising presence to ice shelves such as Brunt/Stancomb-Wills (Khazendar and others, Reference Khazendar, Rignot and Larour2009) and Totten (Greene and others, Reference Greene, Young, Gwyther, Galton-Fenzi and Blankenship2018, Wearing and others, Reference Wearing, Kingslake and Worster2020). Our observations call for these mechanisms to be considered in other locations around Antarctica where unconfined ice shelves cemented with mélange and MYLI provide back-stress to inland ice, potentially triggering increased ice flux if this protective buffer were removed (Reese and others, Reference Reese, Gudmundsson, Levermann and Winkelmann2017; Rott and others, Reference Rott2018, Reference Rott2020). The inclusion of these complex ice shelf-mélange interactions in numerical modelling efforts is crucial for accurately simulating calving dynamics and future sea-level contributions. We recommend the need for in situ measurements of MYLI/mélange thickness, strength, density and back-stress to validate remote-sensing estimates and to provide better constraints on their rheology so that interactions can be accurately included in coupled ice shelf-ocean model simulations.
5. Conclusions
Using a multi-sensor dataset (Landsat, MODIS and Envisat ASAR imagery, ITS_LIVE ice velocity, ERA5 near-surface air temperature and wind fields, RACMO2.3 surface melt and AMSR-E sea-ice concentrations), we describe the large-scale retreat of VIS in March–May 2007 which comprised ~2445 km2 of ice loss involving the disaggregation and removal of a complex ice mélange, detached ice blocks and part of the ice shelf. Our results suggest that:
• The mélange in front of VIS bound the ice shelf together and prevented it disaggregating prior to 2007, although it did not provide significant buttressing to grounded ice because of its unconfined setting.
• The ice shelf was likely preconditioned for disaggregation by the surrounding mélange and MYLI becoming weakened by strong south-easterly winds in the preceding winter and by katabatic wind-driven melting in January 2007.
• The timing of disaggregation coincides with a major negative MYLI anomaly adjacent to VIS, which we link to anomalously warm regional atmospheric conditions and a less persistent latent heat polynya (Stammerjohn and others, Reference Stammerjohn, Maksym, Heil and Massom2011; Khazendar and others, Reference Khazendar2013).
• Surface meltwater on the ice shelf itself was not an important trigger of this disaggregation, indicating surface melt pond-driven hydrofracturing is not always a necessary precursor to ice shelf collapse. Taken together, these processes represent an additional mechanism of ice shelf break-up, whereby the weakening and removal of mélange and multiyear landfast sea ice trigger disaggregation of the structurally-weak ice shelf.
Our observations could be used to constrain the response of unconfined, extensively fractured ice shelves in mélange-terminating settings to the removal of MYLI and mélange.
Supplementary material
The supplementary material for this article can be found at https://doi.org/10.1017/jog.2021.45.
Data
Landsat and Sentinel satellite imagery is freely available via Google Cloud (gs://gcp-public-data-landsat/ and gs://gcp-public-data-sentinel-2/). Envisat ASAR imagery is available via the ESA Online Dissemination Portal (https://esar-ds.eo.esa.int/oads/access/). ITS_Live velocity mosaics are available from: https://nsidc.org/apps/itslive/. REMA is available from the Polar Geospatial Center (https://www.pgc.umn.edu/data/rema/). Bedmap2 is available with the Quantarctica GIS package (https://www.npolar.no/quantarctica/). BedMachine is available via the National Snow and Ice Data Center (https://nsidc.org/data/NSIDC-0756/versions/1). ERA5 reanalysis data are available from the Copernicus Climate Change Service Climate Date Store (https://cds.climate.copernicus.eu/).
Acknowledgements
J.F.A. was funded by the IAPETUS Natural Environment Research Council (NERC) Doctoral Training Partnership (grant number NE/L002590/1). C.R.S., S.S.R.J. and B.W.L.M. were supported by NERC grant NE/R000824/1. We acknowledge RACMO data from M.R van den Broeke, the Norwegian Polar Institute's Quantarctica package, and Copernicus Climate Change Service Information (ERA5 reanalysis). We thank two anonymous reviewers for providing constructive comments which led to the improvement of this paper and the editor (Helen Fricker) for handling the manuscript.
Author contributions
J.F.A. designed the initial study, undertook the data collection, conducted the analysis and generated the figures, with guidance from all authors. J.F.A. led the manuscript writing, with input from all authors.
Conflict of interest
None.


 Open access