


1. Introduction
The surface mass balance (SMB) of polar ice sheets is of great importance in understanding the accumulation mechanisms acting across the ice sheets, estimating the mass balance of the ice sheets and their contributions to global sea-level change, and dating ice cores from these ice sheets. Several methods (stakes, ultrasonic sensors, snow pits, firn and ice cores, and ground-penetrating radar) have been used for SMB measurements. Of these, individual stakes across a profile and stake ‘farms’ have been widely used, mainly because they are easy to set up and because repeated stake-farm measurements are a highly effective way to detect annual and monthly variations in snow accumulation on the ice sheet (e.g. Reference GowGow, 1965; Reference Giovinetto and SchwerdtfegerGiovinetto and Schwerdtfeger, 1966; Reference Yamada, Okuhira, Yokoyama and WatanabeYamada and others, 1978; Reference Takahashi, Ageta, Fujii and WatanabeTakahashi and others, 1994; Reference Mosley-ThompsonMosley-Thompson and others, 1995; Reference Kameda, Azuma, Furukawa, Ageta and TakahashiKameda and others, 1997b; Reference McConnell, Bales and DavisMcConnell and others, 1997; Reference Takahashi and WatanabeTakahashi and Watanabe, 2001; Reference Bamber and PayneBamber and Payne, 2004; Reference Frezzotti, Urbini, Proposito, Scarchilli and GandolfiFrezzotti and others, 2007).
Two deep ice cores (2503.52 and 3035.22 m, hereafter referred to as cores DF1 and DF2, respectively) were drilled at Dome Fuji, East Antarctica, (Fig. 1; 77°19′01′ S, 39°42′11′ E; 3810 m a.s.l.) during the 1995–96 and 2003–07 research seasons. The 10 m snow temperature at this site is −57.3°C (Reference Kameda, Azuma, Furukawa, Ageta and TakahashiKameda and others, 1997b), and previous papers have reported the chemical and physical analyses of the DF1 core (e.g. Reference FujiiFujii and others, 1999, Reference Fujii, Kohno, Matoba, Motoyama and Watanabe2003; Reference Watanabe, Kamiyama, Motoyama, Fujii, Shoji and SatowWatanabe and others, 1999, Reference Watanabe2003a, Reference Watanabe, Jouzel, Johnsen, Parrenin, Shoji and Yoshidab; Reference HondohHondoh and others, 2003).

Fig. 1. Location of Dome Fuji, East Antarctic ice sheet. The locations of Vostok, Dome C, South Pole and Syowa station are also shown.
Recently, Reference Iizuka, Hondoh and FujiiIizuka and others (2006) reported high-resolution results for the DF1 core using 3 mm thick sliced ice-core segments. Because of the area’s extremely cold environment and consequent relatively low accumulation, great caution must be used in interpreting these detailed analytical results. Further, because there is spatial (Reference Kameda, Azuma, Furukawa, Ageta and TakahashiKameda and others, 1997b) and temporal variability in the SMB at Dome Fuji, we cannot expect homogeneous snow accumulation in either space or time.
We have measured the SMB at Dome Fuji using 36 stakes (a grid of 6 × 6 stakes placed at 20 m intervals; hereafter referred to as the ‘36-stake farm’) since 25 January 1995. Here, we report the SMB at Dome Fuji from 1995 to 2006 and discuss annual, monthly and spatial variability of the SMB and a possible hiatus at Dome Fuji.
2. Methods
The 36-stake farm at Dome Fuji is located ∼300 m northeast of the main station buildings (Fig. 2) on the snow surface. This location is close enough to the station to allow researchers to reach the site by foot, even in sunless, severe winter. Additionally, this location is upwind of the main station during most of the blizzards that cover the area (Reference KamedaKameda and others, 1997a; Reference TakahashiTakahashi and others, 1998), thus minimizing the effect of higher snow accumulation because of station obstacles on the snow surface. Bamboo stakes (average bulk density, 340 kg m−3; 2.5 m long and 15–25 mm in diameter) were each installed in a hole 25 mm in diameter, 60–90 cm deep below the snow surface on 25 January 1995 (Reference AzumaAzuma and others, 1997). During four year-round observations 4 years from 25 January 1995 to 15 January 1998 and 1 year from 13 January 2003 to 15 January 2004), we measured all stake heights from the snow surface twice monthly (11–21 day interval; average interval 15.3 days) at a resolution of 0.5 cm. For the remainder of the 12 year monitoring period, we measured all stakes once per year, usually at the end of December or January, at the same resolution.

Fig. 2. Position and array of the 36-stake farm at Dome Fuji.
The SMB was calculated as the difference in the stake heights during the period under consideration, multiplied by the snow density. To take into account snow settling during the measurement period, the average snow density at the stake base during the time interval of the stake measurements (ρ SMB; Reference Takahashi and KamedaTakahashi and Kameda, 2007) was used. Snow density was measured using a rectangular sampler (total volume 97.4 cm3; 59.6 mm × 55.2 mm × 29.6 mm (width × length × height)) and an electronic weight-balance (A&D Co. Ltd, Japan, type DX-4000; maximum weight 4000 g, resolution 0.01 g). The SMB was calculated as follows:
where Δh is the difference in stake height between the two measurements. For this calculation, we assume that the stakes are firmly anchored in the snow; that each stake moves downward with the snow layer on which it was fixed as that firn layer densified; and that the depth–density profile does not change with time, i.e. Sorge’s law (Bader, Reference Bader1954) applies. The bamboo stakes at Dome Fuji satisfy these two criteria to a first approximation (Takahashi and Kameda, Reference Takahashi and Kameda2007).
3. Results
3.1. Snow density for the surface mass-balance calculation
Figure 3a shows the depth region of the average of the 36 stake bases for each year and Figure 3b shows the snow density (ρ SMB) from 1995 to 2006. The values of ρ SMB were estimated using the mean depth of the stake base for each year (Fig. 3a) and the average depth–density profile from the surface to 3 m depth at Dome Fuji measured on 21 February 1995, 18 April 1995, 15 October 1995 and 18 January 1996 (the equation of the profile is shown in Takahashi and Kameda, Reference Takahashi and Kameda2007). As the stake base becomes deeper year by year, ρ SMB increases with time. The range of ρ SMB was 334–363 kg m−3, and the average was 349 kg m−3. Because the average surface snow density for annual snow accumulation depth (about 10 cm in depth from the snow surface) was 280 kg m−3 in 2003 (table 4 in Kameda and others, Reference Kameda, Fujita, Sugita and Hashida2007), the effect of this snow settling increased the SMB by 19–30%. Previous studies (e.g. Giovinetto and Schwerdtfeger, Reference Giovinetto and Schwerdtfeger1966; Reference Lorius and RobinLorius, 1983) have often ignored this effect, but it is not negligible, as discussed by Takahashi and Kameda (Reference Takahashi and Kameda2007).

Fig. 3. (a) Depth region of the average stake base for each year. (b) Time series of ρ SMB for SMB calculations.
3.2. Surface mass balance at Dome Fuji
Figure 4a shows the SMB at Dome Fuji from 13 January 2003 to 15 January 2004 at intervals of 14–17 days (average interval 15.2 days). Standard deviations (SD; large error bars in Fig. 4a) for the 36 stakes and standard errors (SE; small error bars, also called ‘standard deviation of the mean’) indicate the uncertainty of 68.3% scattering for a single SMB value and the mean of the SMB, respectively (e.g. Taylor, Reference Taylor1997). The SMB on the snow surface at each stake varied spatially, as indicated by the large error bars. This was caused mainly by inhomogeneous snow accumulation as small snow dunes and small sastrugi (normally up to 25 cm high) and by snow erosion by wind at the snow surface (Watanabe, Reference Watanabe1978).

Fig. 4. (a) SMB from 13 January 2003 to 15 January 2004 at Dome Fuji at intervals of 14–17 days. (b) Cumulative SMB from 13 January 2003 at Dome Fuji. Standard deviation for the 36 stakes and standard error (standard deviation of the mean) are indicated by large and small error bars, respectively.
In some cases, the SMB was negative, indicating the removal of all snow accumulation since the previous measurement. Because the small error bars indicate the variation of the 36-stake mean, it is clear that 14–17 day SMB values were not constant. Figure 4b shows the cumulative SMB during the same period. The average stake-height difference during the period was 103 ± 8 mm (mean ± SE), which is equivalent to an annual SMB of 36.5 ± 3.0 kg m−2 a−1. Numerical stake-height difference data in the 2003 season are summarized in Kameda and others (Reference Kameda, Fujita, Sugita and Hashida2007). Figure 5 shows typical surface snow conditions at the 36-stake farm in 2003: relatively flat on 31 March and slightly rough on 30 September, illustrating the cause of the scatter in the SMB in Figure 4.

Fig. 5. Examples of (a) relatively flat (31 March 2003) and (b) slightly rough (30 September 2003) snow surfaces at the 36-stake farm at Dome Fuji.
Figure 6 shows the time series of annual SMB with its SD and SE at Dome Fuji from 1995 to 2006. This plot shows the large variation in SMB for individual stakes across the 36-stake farm, as indicated by the large error bars (SD). The average SMB was not uniform, as shown by the small error bars (SE). The average SMB for the 36-stake farm from 1995 to 2006 was 27.3 ± 1.5 kg m−2 a−1 (mean ± SE), and the maximum and minimum SMB were 36.5 kg m−2 a−1 (2003) and 20.2 kg m−2 a−1 (2001), respectively. To facilitate the analysis of long-term variability across the site, the SMB was divided into two groups: larger SMB in 1995, 1996, 1999, 2003 and 2005 (average SMB: 32.7 ± 1.3 kg m−2 a−1) and smaller SMB in 1997, 1998, 2000, 2001, 2002, 2004 and 2006 (average SMB: 23.4 ± 0.8 kg m−2 a−1).

Fig. 6. Time series of the SMB from 1995 to 2006 at Dome Fuji. The standard deviation for the 36-stake farm and standard errors (standard deviation of the means) are indicated by large and small error bars, respectively.
4. Discussion
4.1. Comparison of annual surface mass balance measured from the Dome Fuji ice core
Watanabe and others (Reference Watanabe1997b) estimated the annual SMB from 346 BC to AD 1993 using five major volcanic signals found in the Dome Fuji shallow ice core obtained in 1993 (DF93 core). The signals were dated at 346 BC, AD 639, AD 865, AD 1259 and AD 1464 using the results of the Byrd Surface Camp ice core (Langway and others, Reference Langway, Osada, Clausen, Hammer and Shoji1995) and Byrd deep ice core (Hammer and others, Reference Hammer, Clausen and Langway1997). Watanabe and others (Reference Watanabe1997b) also reported that the annual SMB for the period between the year of core drilling and each volcanic event year ranged from 25 to 29 kg m−2 a−1.
Cole-Dai and others (Reference Cole-Dai, Mosley-Thompson, Wight and Thompson2000) reported on a 4100 year record of volcanism recorded in the Plateau Remote ice core (84° S, 43° E; 3330 m a.s.l.); this core was taken from a site ∼750 km inland from Dome Fuji station. Similar volcanic signals found in the DF93 core and the Plateau Remote core were dated differently. However, the signal for AD 1259 is the same in both analyses. Cole-Dai and others (Reference Cole-Dai, Mosley-Thompson, Wight and Thompson2000) dated this signal as AD 1260 after considering the atmospheric transport time of volcanic aerosols. Thus, we dated the signal at 37.8 m in the DF93 core as AD 1260. Based on the depth–density profile of the DF93 core (Watanabe and others, Reference Watanabe1997a), we calculated the annual SMB from AD 1260 to 1993 in the DF93 core as 26.4 kg m−2 a−1.Noting Frezzotti and others (Reference Frezzotti, Urbini, Proposito, Scarchilli and Gandolfi2007), we did not take into account layer thinning due to vertical strain because the ratio of the layer to the entire thickness of the ice (∼3040 m) was only 1.2%, and the vertical strain rate was therefore negligible.
This long-term rate is in reasonably good agreement with our recent results. Thus, we consider that the annual SMB from 1995 to 2006 at Dome Fuji did not change significantly from the average value from AD 1260 to 1993.
4.2. Temporal and spatial variability of the annual surface mass balance
Table 1 shows the annual SMB at each of the 36 stakes for each of the 12 years from 1995 to 2006 at Dome Fuji. The maximum and minimum annual SMBs recorded were 101.2 and −28.9 kg m−2 a−1, respectively. Note that these observations were at the same stake (VI-2) in consecutive years (1997 and 1998). During the 12 years of observations, annual SMB was recorded as negative or zero on 37 occasions (bold type in Table 1), i.e. 8.6% of the observations were negative or zero. It is important to distinguish between a hiatus in the accumulation record and negative or zero SMB. A hiatus implies there was no snow accumulation in the year due to non-deposition or erosion. Negative or zero SMB suggests that the snow surface level has decreased from the level in the previous year by non-deposition or erosion, usually measured by the stake method. If major snow erosion occurs followed by a small snow accumulation, this condition also results in negative or zero SMB, but there has not been a hiatus in the accumulation record.
Table 1. Annual SMB (kg m−2 a−1) measurements at each stake at Dome Fuji from January 1995 to January 2007. Data obtained from January 2006 to January 2007 are shown in the ‘2006’ column. The numbering system of the stakes is given in Kameda and others (Reference Kameda, Fujita, Sugita and Hashida2007). Lower righthand corner: 19.9 is the SD of all stake data during the 12 year period; 5.3 is the SD calculated from the annually averaged SMB from 1995 to 2006; 1.8 is the SD calculated from the spatially averaged SMB from 1995 to 2006. Negative or zero SMB values are given in bold

Annual averages for each year, the SD for each stake and the SE are summarized in the three bottom rows and the three righthand columns of Table 1. The SD of the yearly averaged SMB for the 36 stakes was 5.3 kg m−2 a−1, which corresponds to 19.4% of the annual SMB. The SD of the 12 cumulative-year average SMB values for each stake was 1.8 kg m−2 a−1, which corresponds to 6.6% of the annual SMB from 1995 to 2006. The relatively small scatter of the 12 year average SMB is possibly explained by the fact that the time series of annual snow accumulation measured at any given stake is not an independent parameter. As the snow surface tends to be flat, a lesser annual snow accumulation is expected after a large annual snow accumulation (a typical example is illustrated in fig. 1 of Fisher and others, Reference Fisher, Reeh and Clausen1985). Figure 7 shows the relation between the annual SMB in any year, n, and the following year, n + 1. The total number of data points in Figure 7 is 396 (= 11 pairs × 36). The correlation coefficient, r, of the relation is 0.36, indicating statistical significance at the 0.1% level (α = 0.001). The SD of annual SMB measured at all stakes from 1995 to 2006 was ±19.9 kg m−2 a−1 as shown in the lower righthand corner of Table 1. This is 73% of the annual SMB. Thus, it is apparently difficult to properly estimate the annual SMB at Dome Fuji using a single stake with only 1 year of observation.

Fig. 7. Relation between the surface mass balance in year n and year n + 1 for each stake from 1995 to 2006. Pairs of stake data in two successive years (e.g. 1995 and 1996, 1996 and 1997) are used.
Figure 8a shows the annual SMB using multi-year averages from January 1995, with SD and SE. The first data point is the SMB with SD and SE error bars from January 1995 to January 1996 (i.e. over 1 year). The second data point shows the results from January 1995 to January 1997 (i.e. over 2 years) and so on. The SD and SE clearly decrease with time due to the ‘multi-year average effect’ of snow accumulation. The average SMB ± SD over the 12 years is 27.3 ± 1.8 kg m−2 a−1, and the SE is ±0.3 kg m−2 a−1. Figure 8b and c show the relation between the number of observation years, N, and SD and SE, respectively. We found that the SD decreases with ![]() as
as
with correlation coefficient 0.98, and that the SE decreases with ![]() as
as
with correlation coefficient 0.98. Interestingly, the SD of the SMB is 10% of the annual SMB for multi-year averages of SMB calculated over 9.3 years. This indicates that if we measure a stake at Dome Fuji for 10 years, the average SMB for the stake will be within ±10% of the annual SMB.
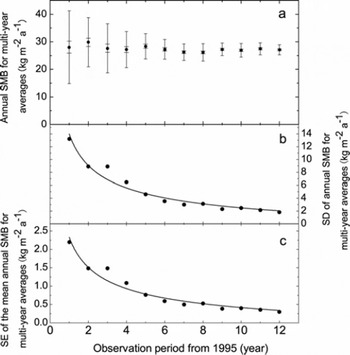
Fig. 8. (a) The annual SMB using multi-year averages from January 1995, with SD (large error bars) and SE (small error bars). The first data point is the SMB with SD and SE error bars for January 1995 to January 1996 (i.e. over 1 year). The second data point shows the results from January 1995 to January 1997 (i.e. over 2 years) and so on. (b) The SD and (c) the SE plotted against the total number of observation years.
Frezzotti and others (Reference Frezzotti, Urbini, Proposito, Scarchilli and Gandolfi2007) discussed a similar idea and found that, in Victoria Land, East Antarctica, the number of observation years required for ±10% accuracy of the SMB at a single stake was 3 years for stakes at GV7 (annual SMB: 252 kg m−2 a−1; 70°41.052′ S, 158°51.749′ E; 1947 m a.s.l.) and 7 years for stakes at Talos Dome (81 kg m−2 a−1 ; 72°46.235′ S, 159°04.545′ E; 2316 m a.s.l.), GV5 (35 kg m−2 a−1;71°53.22′ S, 158°32.216′ E; 2184 m a.s.l.), and 31 Dpt (98.7 kg m−2 a−1; 74°02′ S, 155°02′ E; 2050 m a.s.l.). Figure 9 shows the relation between the required number of years of observation and the annual SMB for the five datasets. The required number of years is linearly related to the annual SMB by N = −0.0263SMB + 9.8, with correlation coefficient 0.97. Using this equation, we can estimate the number of observation years at a single stake required to estimate the SMB at ±10% accuracy.

Fig. 9. Relation between SMB and number of years of observation required at a single stake for ±10% accuracy in the SMB. Talos Dome (TD), 31 Dpt, GV5 and GV7 are located in Victoria Land, East Antarctica; DF indicates our results for Dome Fuji.
Recently, Fujita and Abe (Reference Fujita and Abe2007) summarized the total amount of precipitation, in which frost was included, on a floor located 4 m above the snow surface near the Dome Fuji station buildings. Their dataset is distinct from our 36-stake farm dataset. They reported a total precipitation of 27.6 kg m−2 from 5 February 2003 to 20 January 2004. Our result from the 36-stake farm from 15 February 2003 to 15 January 2004 was 29.0 ± 17.6 kg m−2 (mean ± SD); the SD expresses the scatter of individual stakes. According to their daily data (personal communication from K. Fujita, 2007), the total amount of precipitation from 15 February 2003 to 15 January 2004 was estimated as 25.7 kg m−2. This value agrees well with our 36-stake farm observation during the same period.
4.3. Distribution of annual surface mass balance
Figure 10 shows the normalized occurrence frequency of the annual SMB at 5 kg m−2 a−1 intervals for each stake from 1995 to 2006. A normal distribution gives a good fit to the annual SMB at Dome Fuji, which is similar to the annual amounts of precipitation at mid-latitude (e.g. Maidment, Reference Maidment1993). The fitting equation is

The correlation coefficient for the relation is 0.994, and the relation is statistically significant at the 0.1% level (a = 0.001). The values of μ and σ are 27.064 and 19.690, respectively.

Fig. 10. Occurrence frequency distribution of annual SMB at Dome Fuji from 1995 to 2006, plotted with a normal distribution curve.
In previous studies (e.g. Reference Hogan and GowHogan and Gow, 1997; Reference Van der Veen, Whillans and GowVan der Veen and others, 1999) log–normal and gamma distributions were used for the thickness of annual SMB in ice cores and snow pits because the distributions apparently had larger values than the average. However, the shape of the distribution shown in Figure 10 differs from these results because Figure 10 contains negative and smaller values. In principle, negative or zero SMB cannot be detected by ice cores and snow pits, as noted in section 4.2. This implies that small SMB values in ice cores or snow pits may have been ignored in previous studies and they use a percentage of large SMB values which is higher than the actual value.
4.4. Monthly variability of the surface mass balance
Twice-monthly measurements of SMB reveal relatively continuous snow accumulation on the snow surface at Dome Fuji (Fig. 4). To investigate the monthly variability in the SMB, the average monthly SMB was calculated using data from 1995–98 and 2003 (Fig. 11a). The SD for the 36 stakes and SE for the mean are shown as large error bars and small error bars, respectively. Table 2 summarizes the numerical values of monthly SMB, its SD and percentages of monthly SMB to annual SMB. These measurements clearly indicate that snow accumulated approximately uniformly through the year, with the rates in February, April, June and July slightly greater than the average (2.6 kg m−2 month−1). The relatively small amount of SMB from December to January was possibly caused by sublimation from the snow surface because of the strong solar radiation and relatively warm surface snow temperature (Reference Kameda, Azuma, Furukawa, Ageta and TakahashiKameda and others, 1997b). Figure 11b shows the relation between the average monthly SMB and its SD, with the SD increasing with SMB as SD = 1.97SMB + 4.2. The correlation coefficient of the relation is 0.62, statistically significant at the 5% level (α = 0.05).

Fig. 11. (a) Average monthly SMB at Dome Fuji from January to December in four years (1995–97 and 2003) with the SD of the data (large error bars) and SE (small error bars). (b) Relation between monthly SMB and SD of monthly SMB.
Table 2. Monthly SMB measurements, SD of the SMB and monthly percentages of annual SMB from the four year-long observations in 1995–98 and 2003. The SD of the average (1.3 kg m−2 month−1) was calculated from the monthly SMB

Figure 12a shows the time series of monthly mean wind speed at Dome Fuji, the SD of monthly SMB and the monthly SMB during the four year-round observation periods. Windspeed data were measured at a height of 10 m at 10 min intervals (Reference Yamanouchi, Hirasawa, Hayashi, Takahashi and KanetoYamanouchi and others, 2003; Reference Esaki, Sugita, Torii, Takahashi and AdachiEsaki and others, 2007). The SD of the SMB was weakly correlated with the monthly mean wind speed, W (m s−1), as shown in Figure 12b; the regression is SD = 5.12W − 13.4, with correlation coefficient 0.49. This relation is statistically weak, but is significant at the 20% level (α = 0.20). This result suggests that as the wind speed increases, some of the surface snow will be eroded, and the monthly SMB tends to be variable.

Fig. 12. (a) Variation in monthly average wind speed (filled circles), SD of monthly SMB (open circles) and monthly SMB (open squares) from January to December in four years (1995–97 and 2003). (b) Relation between monthly average wind speed and SD of the SMB from January to December in four years (1995–97 and 2003).
Reference McConnell, Bales and DavisMcConnell and others (1997) reported that the SD of the SMB was correlated with the maximum wind speed for any day during the month at the South Pole from January 1991 to December 1995. We examined this relation using year-round observation data from four years at Dome Fuji, but found no significant relation better than that shown in Figure 12b (correlation coefficient for the relation is 0.10). Thus, we consider the SD of the SMB to be better correlated with monthly mean wind speed than with monthly maximum wind speed.
4.5. Negative or zero surface mass balance at Dome Fuji and comparison with other sites
The percentage of recorded negative or zero SMB values from 1995 to 2006 was 8.6% of a total of 432 observations, as shown in Table 1 and described in section 4.2. Figure 13 shows the normalized occurrence frequency of the annual SMB measured over (a) one year of data (i.e. the same data as in Fig. 10), (b) two successive years of data and (c) three successive years of data at 5 kg m−2 a−1 intervals for each stake from 1995 to 2006. Negative or zero SMBs are shaded. The distribution of annual SMB becomes narrow with increasing number of observation years, for the same reason as the decrease of SD in Figure 8b, i.e. the ‘multi-year average effect’ of snow accumulation. Negative or zero SMB is observed in the 1 year data in 8.6% of the observations, in the 2 year data in 1.0% (i.e. four occasions in 396 data points) of the observations and not at all in the 3 year data. This result suggests that on average a 3 year length of Dome Fuji ice core (∼90 mm (∼3 × 27.3/0.9; 0.9 is ice-core density) of ice) contains some snow deposited within the 3 year period. However, if we select a 2 year length (60 mm of ice) of the core, information from those specific 2 years is likely to be absent since negative or zero SMB, and possibly a hiatus, occurred at the snow surface during those 2 years. Thus, environmental events lasting >3 years are expected to be recorded in the Dome Fuji ice core, but events lasting <3 years may be missed. Great caution needs to be exercised when making temporally detailed interpretations of the Dome Fuji ice core to avoid misinterpretation of the environmental record.

Fig. 13. Occurrence frequency distribution of annual SMB at Dome Fuji from 1995 to 2006 using (a) 1 year of data, (b) 2 years of data and (c) 3 years of data. Pairs of stake data in two successive years (e.g. 1995 and 1996, 1996 and 1997) and three successive years (e.g. 1995–1997, 1996–98) are shown for (b) and (c), respectively. Negative or zero SMB is shaded.
Reference Petit, Jouzel, Pourchet and MerlivatPetit and others (1982) reported that six of their 58 stake measurements (i.e. 10.3%) indicated negative or zero SMB in 1975 at Dome C, central Antarctica. The SMB of their 36-stake farms was 36 ± 4 kg m−2 a−1 (mean ± SE). Reference Palais, Whillans and BullPalais and others (1982) observed a negative or zero SMB at six of 95 stakes (6.3%), but at none of another 100 stakes in 1979, again at Dome C. The measured SMBs at these 36-stake farms were 35 ± 2.5 and 62 ± 2.8 kg m−2 a−1, respectively. The average (across all studies) number of negative or zero SMBs at Dome C is 4.9% and the average (adjusted for the different number of stakes in each study) SMB is 45.9 ± 2.9 kg m−2 a−1 (mean ± SE).
Reference Mosley-ThompsonMosley-Thompson and others (1995) reported that 4.1% of 216 measurements (36 stakes over 6 years) indicated negative or zero SMB at the South Pole from January 1958 to November 1964. The average annual SMB of their 36-stake farm was 63.7 ± 10 kg m−2 a−1 (mean ± SD), which is 63.7 ± 1.7 kg m−2 a−1 (mean ± SE). Ekyakin and others (1998) reported that 6% of 2079 measurements (77 stakes over 27 years) indicated negative or zero SMB from 1970 to 1996 at Vostok, central Antarctica. The measured average SMB for their 36-stake farm was 22.9 ± 1.8 kg m−2 a−1 (mean ± SE).
Figure 14 shows the relation between annual SMB (kg m−2 a−1) and average frequency, f (%), of occurrence of negative SMB at four sites in the central Antarctic region. The regression line is
with a correlation coefficient of 0.53. The 95% confidence interval is also shown in Figure 14, as dashed lines. The regression line indicates that the percentage of negative or zero SMB will reach zero at ∼145 kg m−2 a−1, while extrapolation of the 95% confidence line indicates a value of 190 kg m−2 a−1. That is, at the 5% significance level, snow accumulation is expected every year provided the annual SMB is >190 kg m−2 a−1. This value is in agreement with that found by Reference Frezzotti, Urbini, Proposito, Scarchilli and GandolfiFrezzotti and others (2007), who estimated the above criterion at 120 kg m−2 a−1 using stake data from along Talos Dome and Wilkes Land in the Antarctic ice sheet. Differences may be due to differences in average and maximum wind speeds between the inland sites and the Talos Dome area.

Fig. 14. Relation between annual SMB and frequency of negative or zero SMB at Dome Fuji (DF), Dome C (DC), South Pole (SP) and Vostok (VK). Dotted lines indicate the 95% confidence interval for each dataset.
From pit observations collected by comparing layer stratigraphy with absolute beta-radioactivity dating, Reference Ekaykin, Lipenkov and BarkovEkaykin and others (1998) reported a hiatus at Vostok of 12.7%. It is suggested that layers thinner than 1 cm disappear during densification. Indeed, using stake data, they estimated that the probability of layers thinner than 1 cm is very close to the hiatus observed in pits. Using the same method as above for Dome Fuji stake observations from 1995 to 2006 we obtain a hiatus value of 10.4%
5. Conclusions
Observations of ice-sheet SMB at a 36-stake farm from 1995 to 2006 demonstrate the complex nature of the SMB at Dome Fuji. Specifically, our results show:
-
1. The annual average SMB from 1995 to 2006 at Dome Fuji was 27.3 ± 1.5 kg m−2 a−1. The SMB can be divided into two groups: larger in 1995, 1996, 1999, 2003 and 2005 (average: 32.7 ± 1.3 kg m−2 a−1) and smaller in 1997, 1998, 2000, 2001, 2002, 2004 and 2006 (average: 23.4 ± 0.8 kg m−2 a−1).
-
2. The annual average SMB (27.3 ± 1.5 kg m−2 a−1) is similar to the average from AD 1260 to 1993 (26.4 kg m−2 a−1) estimated from volcanic signals in the Dome Fuji ice core (Reference WatanabeWatanabe and others, 1997b). We propose that the annual SMB from 1995 to 2006 at Dome Fuji has not changed significantly from the average between AD 1260 and 1993.
-
3. The variation in the multi-year averages of the SMB decreases with the square root of the number of observation years. This is because annual snow accumulation measured at a stake is not an independent parameter and, over time, the snow surface tends to flatten.
-
4. The SMB measured by the stake method at Dome Fuji over a single year has an uncertainty of 19.9 kg m−2 a−1 with a 68.3% confidence level. Using SMB measurements at a single stake over a 10 year period, the annual SMB can be estimated within ±10% accuracy.
-
5. The occurrence distribution of the annual SMB at Dome Fuji from 1995 to 2006 is well fitted by a normal distribution, although previous studies have suggested that the annual SMB in ice cores and snow pits can be fitted by log–normal and gamma distributions. This implies that small SMB values in ice cores or snow pits may have been ignored in previous studies, and the percentage of large SMB values was increased from the actual values.
-
6. Based on 4 years of bimonthly observations within the 12 year study period, we found that snow accumulated fairly constantly throughout the year, although accumulation rates were slightly greater in February, April, June and July. The standard deviation of the monthly SMB is related to the SMB and, weakly, also to the monthly mean wind speed at Dome Fuji.
-
7. During the 1995–2006 campaign, 8.6% of the annual SMB measurements were negative or zero. We found that the percentage of negative or zero SMB at four sites in central Antarctica (Dome Fuji, Dome C, South Pole and Vostok) is related to the annual average SMB at the site and estimated that annual snow accumulation is expected every year if the average SMB is larger than 190 kg m−2 a−1 . According to the criterion reported by Reference Ekaykin, Lipenkov and BarkovEkaykin and others (1998), the percentage of hiatus in Dome Fuji ice core is 10.4%.
-
8. We found that negative or zero SMBs are observed in the 1 year data and 2 year data, but not in 3 year data. This result suggests that an average 3 year length of the Dome Fuji ice core contains some snow deposited during that 3 year period. However, if we select a 2 year length of core, information from those specific 2 years may be absent since negative or zero SMBs and, possibly, a hiatus may have occurred at the snow surface during the period. Thus, environmental events lasting >3 years are expected to be recorded in the Dome Fuji ice core, but events lasting <3 years may be missed.
These findings clarify the complex nature of the SMB at Dome Fuji. We consider the variability of the SMB and the negative or zero SMB at Dome Fuji as common phenomena in areas of low snow accumulation, such as the interior Antarctic ice sheet. Thus, great caution must be exercised when making temporally detailed interpretations of ice cores from the inland Antarctic ice sheet.
Acknowledgements
The long-term research at the 36-stake farm was planned by the Committee of Basic Glaciological Observations at Dome Fuji (chair: S. Takahashi) as part of the Deep Ice Coring Projects at Dome Fuji (1991–98) and Dome Fuji II (2000–07). We acknowledge the principal investigators of these projects: O. Watanabe, former director of the National Institute of Polar Research (NIPR), Japan, and Y. Fujii, director of NIPR. Numerous people who took part in the Japanese Antarctic Research Expedition (JARE) contributed the measurements, especially N. Azuma, Y. Ageta and T. Furukawa (JARE-36 in 1995); Y. Fujii (JARE-37); T. Yamada and K. Suzuki (JARE-39); T. Furukawa (JARE-40); K. Nishimura (JARE-41); T. Saito (JARE-43); K. Fujita and O. Sugita (JARE-44); K. Goto-Azuma (JARE-45); M. Igarashi (JARE-46); T. Saito (JARE-47); K. Fukui and Chung Ji Woong (JARE-48). Discussions with A.A. Ekaykin on the stake data at Dome Fuji and Vostok are greatly appreciated. We also acknowledge I. Sugiyama for assisting with the normal-fitting calculation under supervision of K. Sado, T. Nakao and H. Hayakawa. K. Fujita prepared Figure 1. Comments from T.H. Jacka, H. Rott, M. Frezzotti, S. Kaspari, O. Brandt and C.A. Shuman greatly improved the paper.


