


1. INTRODUCTION
Recently, attention has been focused on the storage and cycling of organic carbon (OC) in glaciers and ice sheets because of their high vulnerability to a warming climate (Bhatia and others, Reference Bhatia2013; Hood and others, Reference Hood, Battin, Fellman, O'Neel and Spencer2015). Dissolved OC (DOC) in glaciers and ice sheets is an important element in the cycling of carbon between the oceans and land (Hood and others, Reference Hood2009; Stubbins and others, Reference Stubbins2012; Spencer and others, Reference Spencer2014), and has important implications for the biogeochemical cycling of aquatic system because of its high bioavailability for aquatic heterotrophs (Singer and others, Reference Singer2012; Lawson and others, Reference Lawson, Bhatia, Wadham and Kujawinski2014a, Reference Lawsonb).
The mountain glaciers of China are at the headwaters of many large Asian rivers (e.g. the Yangtze, Indus and Ganges). It is important to understand the storage and cycling of DOC in these glaciers, so that biogeochemical changes due to global warming can be understood. Hood and others (Reference Hood, Battin, Fellman, O'Neel and Spencer2015) used previously published data to estimate the amount of DOC stored globally in glaciers and ice sheets, to be 4.48 ± 2.79 Pg. However, DOC data from the high mountain glaciers of Asia (including the glaciers in western China) were from only one sampling site. In the present study, using snow/ice samples collected from four glaciers in different regions of western China and an updated Chinese glacier inventory (Guo and others, Reference Guo2014), we estimate the storage of DOC in Chinese glaciers and the annual DOC deposition and release rates.
2. METHODS
Field campaigns on four alpine glaciers of western China were conducted in August, 2014 (Table 1). The glaciers were Tien Shan Glacier No. 1 (TS), Laohugou Glacier No. 12 (LHG), Dongkemadi Glacier (DKMD) and Baishui Glacier No. 1 at Yulong Mountain (YL) (Fig. 1). The climate in north western China and the central part of the Tibetan Plateau (TP) is strongly dominated by westerlies and the Asian winter monsoon during winter, and weakly by the Asian summer monsoon during summer. The climate of the southern TP is strongly dominated by the Asian monsoon during summer and weakly by westerlies during winter. Glaciers of different regions can be categorized into different types based on air temperature at the equilibrium line altitude during summer and the amount of annual precipitation (Shi and Liu, Reference Shi and Liu2000). YL is classed as a maritime glacier due to high summer average air temperature (1–5°C) and abundant annual precipitation (1000–3000 mm w.e.). DKMD is a polar glacier due to low summer air temperature (<−1°C) and low annual precipitation (200–500 mm w.e.). TS is a continental glacier due to relatively high summer air temperature (0–3°C) and medium amount of precipitation (500–1000 mm w.e.), while LHG is at the transition region between a polar glacier and continental glacier. These four glaciers therefore represent the spectrum of glacier types found in China.

Fig. 1. Location of the four glaciers sampled (Tien Shan Glacier No. 1 (TS), Laohugou Glacier No. 12 (LHG), Dongkemadi Glacier (DKMD) and Yulong Mountain (YL)) and the mass concentration (μgC L−1) of dissolved organic carbon (DOC) at the different zones of the glacier (bar plots).
Table 1. Summary of the location, sampling date, glacier length and snow pit depth in the field study in western China during 2014

Surface (~10 cm) snow/ice samples were collected from both the ablation and accumulation areas of each glacier along a transect from low to high elevation at ~50–100 m elevation intervals. A snow pit was dug and sampled at ~5–10 cm resolution in the accumulation zone of each glacier, apart from YL. At each elevation interval, 2 or 3 parallel surface samples were collected at the different sites and all samples were stored in Whirl-Pak® bags and kept at below 0°C during transport (1–2 d). In each glacier, ~30 surface snow/ice samples were collected and for convenience, the samples at each glacier were divided into three zones (zone1, zone2, zone3) based on the elevation, i.e. zone1 at the lowest elevation, zone3 at the highest elevation. The number of samples in each zone varied from 6 to 16.
The DOC concentration in each sample was determined using a Vario EL CN analyser (Elementar, Hanau, Germany). The sample was passed through a 0.45 µm Acrodisc syringe filter (Pall Life Sciences, Ann Arbor, MI, USA) and then acidified with 100 µL of 10% hydrochloric acid to remove inorganic carbonates. Non-purgeable OC was then oxidized by combusting the sample at 850°C in a carrier gas with a controlled O2 concentration, and the evolved gases containing carbon were converted to CO2, which was determined using a non-dispersive infrared analyser. The system was calibrated using a potassium hydrogen phthalate standard. The detection limit for DOC was ~50 µgC L−1 defined as three times the standard deviation of low concentration samples. The reproducibility (the relative deviation from the mean value) was better than 5%.
In addition, inorganic ionic species were determined for snow pit samples using two ionic chromatography (IC) systems (881 Compact IC Pro, Metrohm, Herisau, Switzerland) (Xu and others, Reference Xu2015). One of the IC systems was used to determine cations, and was equipped with a Metrosep C4 guard/2.0 column and Metrosep C4 250/2.0 column (Metrohm), which were kept at 30°C during measurements. The other IC system, equipped with a Metrosep RP2 guard/3.6 column and a Metrosep A Supp15 250/4.0 column (Metrohm), and kept at 45°C during measurements, was used to determine anions.
3. CHARACTERISTICS OF THE DOC DISTRIBUTIONS IN THE GLACIERS
The average mass concentration of DOC decreases from zone1 (987–1470 µgC L−1) to zone3 (737–1030 µgC L−1) in TS and LHG (Fig. 1), probably because of the debris-rich surface and strong microbial activity (such as snow algae, mirofauna, insects and bacteria thrive) at the low elevation areas of the glaciers (Takeuchi and Li, Reference Takeuchi and Li2008). Organisms combining with mineral dust to form spherical granules, cryoconite, usually have high DOC concentration (1000–3000 µgC L−1) (Anesio and others, Reference Anesio2010). The DOC concentrations in zone1 at DKMD and YL were lower than in zone2 and zone3; the reason for this trend remains uncertain at this stage, but possible explanations include strong leaching processes at zone1. The lowest DOC concentrations were found in snow pit samples (500–700 µgC L−1). DOC mass concentrations at different zones in YL were less varied compared with those of other glaciers, likely because of strong surface melting redistributing water soluble chemical matter throughout the whole glacier surface. The different DOC concentrations for the same zones on different glaciers could reflect the states of melting, debris cover and microbial activity for each glacier. The average DOC mass concentrations in the snow pit samples from TS (519.7 ± 136.3 µgC L−1), LHG (658.7 ± 78.9 µgC L−1) and DKMD (642.3 ± 499.1 µgC L−1) were comparable (Fig. 1). In contrast, the concentrations of mineral dust (determined from the concentrations of Ca2+ and Mg2+) found in snow pit samples from TS and LHG are significantly higher (p < 0.05, t-test), than for DKMD (~3000 vs ~400 µg L−1; Fig. 2). These results suggest that mineral dust may not be a major source of DOC in the glaciers. The average DOC mass concentrations across all samples in each glacier were 757.7 ± 191.6 µgC L−1 (TS), 1096.8 ± 344.8 µgC L−1 (LHG), 906.5 ± 201.4 µgC L−1 (DKMD) and 1263.6 ± 85.2 µgC L−1 (YL). The high DOC concentration at YL is likely due to significant melting, which may favour microbial activity in liquid water. Yao and others (Reference Yao2012) showed that glaciers in the Mount Hendduanshan area (where YL is located) have melted more in recent decades than glaciers in other parts of western China.

Fig. 2. Comparisons between the concentrations of mineral dust (Ca2+ and Mg2+) and dissolved organic carbon (DOC) in snow pit samples from Tien Shan Glacier No. 1 (TS), Laohugou Glacier No. 12 (LHG) and Dongkemadi Glacier (DKMD).
The DOC concentrations in the snow pit samples at these glaciers were higher than found in other alpine glaciers, such as in Europe (10–300 µgC L−1) (Legrand and others, Reference Legrand2013, and reference therein), probably because of different methods of DOC analysis (Bisutti and others, Reference Bisutti, Hilke and Raessler2004) and higher aerosol loading in Asia than in Europe (e.g. Spracklen and others, Reference Spracklen2011). Satellite observations have shown that pollution in South and East Asia, which is the predominant aerosol source for alpine areas of western China (Zhang and others, Reference Zhang2015), is most severe during winter and spring (Ramanathan and others, Reference Ramanathan, Crutzen, Kiehl and Rosenfeld2001). The organic aerosol signal of biomass burning from South Asia has also been detected in Himalayan snow pit samples (Xu and others, Reference Xu2013).
4. ESTIMATING THE AMOUNT OF DOC STORED IN CHINESE GLACIERS
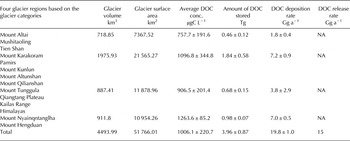
Four regions in western China have been delineated based on glacier category, surface area and volume within each region (Table 2). Glacier volume in each region was first converted to w.e. mass using an ice density of 0.85 g cm−3, then the amount of DOC stored in the glaciers in each region was determined from the mass of water in the glaciers and the average DOC concentration in the glacier studied in that region (Table 2). The total amount of DOC stored was found to be ~3.96 ± 0.87 Tg. More DOC (1.84 ± 0.58 Tg) was stored in glaciers in the northern part of the TP than in other regions studied, and the amount decreased from the southwest TP (0.98 ± 0.07 Tg), to the southern TP (0.68 ± 0.15 Tg) and northwest China (0.46 ± 0.12 Tg). The amount of DOC stored in Chinese glaciers was found to account for ~5.6% of the total DOC in alpine glaciers (70 Tg) around the world (Hood and others, Reference Hood, Battin, Fellman, O'Neel and Spencer2015). This is more than the contribution (3.4%) of Chinese glaciers to the volume of all alpine glaciers. Our estimate for Chinese glaciers is somewhat higher than that of Hood and others (Reference Hood, Battin, Fellman, O'Neel and Spencer2015), which was based on a lower average DOC concentration (290 µgC L−1).
Table 2. Statistics for glaciers and the storage, deposition and release of DOC in glaciers in four regions of western China. The data for glaciers in each region are cited from the Second Glacier Inventory Dataset of China (Guo and others, Reference Guo2014)
Our estimate on the storage of DOC in Chinese glaciers may represent an upper limit due to the higher DOC concentration during recent decades. Lavanchy and others (Reference Lavanchy, Gäggeler, Schotterer, Schwikowski and Baltensperger1999) show that DOC in ice cores has increased mass concentration in recent decades due to increased anthropogenic emission. In addition, under global warming conditions glacier surfaces may contain higher microbial activity, which increases DOC concentration, than under cold conditions.
5. ESTIMATING DEPOSITION AND RELEASE RATES OF DOC
Due to less influence of leaching processes in snow pit samples, we estimated the DOC deposition rate (including both dry and wet deposition) for each region using the average DOC concentration in the snow pit samples, based on:
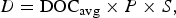 $$D = {\rm DO}{{\rm C}_{{\rm avg}}} \times P \times S,$$
where D is deposition rate, P is annual precipitation rate and S is glacier surface area. The snow pit samples are used to roughly represent one whole year (2013/14) of deposition, based on data from pits previously examined on these glaciers (Xu and others, Reference Xu2012) and the consistent average concentration of DOC in snow pit samples collected during summer 2014 and 2015 (not shown). Although leaching could occur during summer, uncertainty due to this is difficult to evaluate because it needs continuous in situ observation (Li and others, Reference Li2006). The average DOC concentration in the YL surface snow/ice samples (1263.6 ± 85.2 µgC L−1) was used to calculate the deposition rate in the southern part of the TP. We assumed that the average annual accumulation rate for all Chinese glaciers is 500 mm w.e. (up to 1000 mm at the southern edge of TP and 300 mm in the interior TP) (Kaspari and others, Reference Kaspari2008), and this gives a total DOC deposition rate for Chinese glaciers of 19.8 ± 1.0 Gg a−1.
The rate at which DOC is released from Chinese glaciers was estimated from the melting rate of glaciers in the high mountains of Asia (−30.6 ± 5.0 Gt a−1) (Yi and Sun, Reference Yi and Sun2014) and the average DOC concentration in the samples from all four of our sampling sites (1006.1 ± 200 µgC L−1) based on:
 $${\rm Release}\;{\rm rate} = {\rm DO}{{\rm C}_{{\rm avg}}} \times {\rm Melting}\;{\rm rate}\;{\rm of}\;{\rm glacier}.$$
The rate at which DOC was released from glaciers in the high mountains of Asia was found to be ~30.8 ± 6.1 Gg a−1. Chinese glaciers account for ~50% of all glaciers in the high mountains of Asia (Pfeffer and others, Reference Pfeffer2014), so the release rate from Chinese glaciers is ~15.4 ± 6.1 Gg a−1. The difference between the release and deposition rates is ~4.4 Gg a−1, so that Chinese glaciers are likely a net weak sink of DOC. The amount of DOC released annually from Chinese glaciers is ~7–20% of the amount released annually from the Greenland ice sheet (80–220 Gg a−1) (Bhatia and others, Reference Bhatia2013; Hood and others, Reference Hood, Battin, Fellman, O'Neel and Spencer2015), while Chinese glaciers total ~0.2% of the volume of the Greenland ice sheet. It therefore follows that DOC is released more efficiently from Chinese mountain glaciers than from the Greenland ice sheet (Hood and others, Reference Hood, Battin, Fellman, O'Neel and Spencer2015).
6. SUMMARY
We estimated the amount of DOC stored in glaciers from the latest Chinese inventory and the DOC concentrations in samples collected from four glaciers in different regions. We found that the storage of DOC in Chinese glaciers is ~3.96 ± 0.87 Tg; the deposition and release rates of DOC from Chinese glaciers were ~19.8 ± 1.0 Gg a−1 and 15.4 ± 6.1 Gg a−1, respectively. Our estimation for the storage of DOC in Chinese glaciers is higher than the results of Hood and others (Reference Hood, Battin, Fellman, O'Neel and Spencer2015). The release efficiency of DOC based on their glacier volume is higher for Chinese mountain glaciers than for glaciers and ice sheets in polar regions.
ACKNOWLEDGEMENTS
We thank two anonymous referees for suggestions and advice. We also than Jo Jacka for English editing. This research was supported by grants from the Chinese Academy of Sciences Hundred Talents Program, the National Natural Science Foundation of China Science Fund for Creative Research Groups (41121001), the Key Laboratory of Cryospheric Sciences Scientific Research Foundation (SKLCS-ZZ-2015-01) and the Chinese Academy of Sciences Key Research Program (KJZD-EW-G03).


 Open access