


Introduction
Field measurements of snow-cover settlement have been reported by Haefeli (Reference Bader, Bader, Haefeli, Bucher, Neher, Eckel, Thams and NiggliBader and others, 1939), Reference Atwater, Atwater, LaChapelle, Stillman and FotoAtwater and others (1954) and Reference KeelerKeeler (1969). These studies used settlement gages similar in principle to those employed in the measurements to be discussed.
Laboratory studies of snow settlement have been described by a number of investigators including Haefeli (Reference Bader, Bader, Haefeli, Bucher, Neher, Eckel, Thams and NiggliBader and others, 1939) and Reference Yosida, Yoshida and YosidaYosida and others (1956, Reference Yosida, Yoshida and Yosida1958). For moderate loads σ and displacements, the contraction dl of a snow layer with thickness l has been shown to be approximated by
where t is the time, g is the acceleration due to gravity, and η is generally termed the settlement viscosity with the units N m−2 s in the SI-system but more commonly reported in the literature on snow settlement in g wt cm−2 d.
If the snow layer neither gains nor loses mass during the settlement, and if it is laterally confined or if its lateral extension may be neglected,
where ρ is the average layer density. Since density can be more conveniently measured than settlement, the fractional densification for particular snow layers has been more commonly studied in the field. The estimates of η by Yosida and Keeler considered below are made from densification measurements. While no objection could be made to such estimates for settlement of dry, isothermal snow, the assumption of constant layer mass is less plausible for layers in a natural snow accumulation with severe vertical temperature gradients.
Viscosity as a function of density and temperature
The settlement viscosity has commonly been assumed to be a function of snow density and temperature. Other factors which have been considered peripherally include rate of loading, grain size, and air permeability.
In most studies η has been correlated with ρ by an exponential function
Yosida's (Reference Yosida, Yoshida and YosidaYosida and others, 1956) measurements on the densification of layers in an annual snow cover indicated a value of about 21 cm3 g−1 for b over a wide range of snow types and a variation of 0.6 to 2.1 g wt cm−2 d−1 (21 kg m−2 d−1) for c depending on the snow temperature, which ranged from 0°C to −6°C.
Relation (3) was modified by Reference BaderBader (1962) and Reference BensonBenson (1961) by allowing c to vary in proportion to the ratio ρ/(ρ−ρ 0) where ρ 0 was a limiting density.
The dependence of η on local temperature is so severe that it is difficult to compare the various ρ(η) relationships with field data taken in annual snow covers where sharp diurnal temperature shifts are common. An exponential temperature relationship has been widely assumed (Reference Bader and KuroiwaBader and Kuroiwa, 1962), i.e.
The constant R would be equal to about 8.33 J deg−1 g−1, T is the temperature in kelvins, and Q is a constant similar to the activation energy for a chemical reaction.
Measurements in the laboratory and field yield a considerable range for Q—from 84 000 J g−1 to 40 000 J g−1—with the value apparently decreasing with increasing snow density. Assessment is complicated by the non-linearity of Relation (4); for a given mean daily temperature, η calculated at that temperature would be in excess of a true average for temperature variations typical of field conditions.
The relation of η to grain size has not been extensively explored. Reference Bader and KuroiwaBader and Kuroiwa (1962) concluded that η varied with the cube of the grain size but this point does not seem to have been studied extensively. This variation would be consistent with the very high η values found with strongly metamorphosed snow layers such as depth hoar.
Observations
The snow cover studied was in a forest clearing near Fraser, Colorado, in the late winter of 1963 at an altitude of 3 000 m. The settlement measurements were incidental to a more extensive study of the snow-cover energy balance, which was reported in a previous publication (Reference Bergen and SwansonBergen and Swanson, 1964). A more detailed description of the instrumentation has been given by Reference SwansonSwanson (1968).
The gage consisted of a framework of light acrylic plastic rods weighing a total of about 500 g and centered on a thin nichrome wire. The framework was electrically connected with the wire by means of a low-friction mercury contact. A second wire extended from the framework to an overhead bracket and thence to a bridge circuit in an instrument trailer about 15 m from the settlement gage. The bridge circuit measured the height of the settlement frame to within 5 mm.
The most plausible argument that the system did not distort the local settlement pattern may be made from a photographic cross-section of the layer of snow containing the settlement gages (Fig. 1) taken after the observations. The section, about 10 cm thick (Fig. 2) was photographed at night backlighted with a fluorescent tube light held vertically. The stratification showed up in considerable detail, and was quite uniform around the gages located near the center of the photograph.
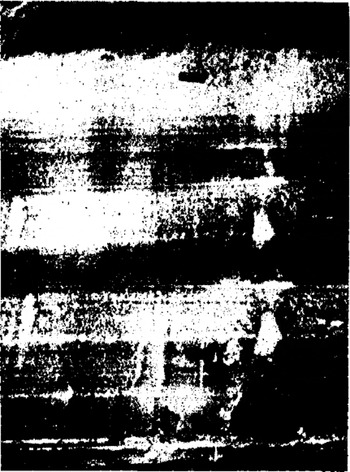
Fig. 1 Snow-cover cross-section photographed on 25 March at the location of gage array I. The markers are at height intervals of 20 cm. The gage wire is located midway between the markers and the left edge of the figure. U.S. Forest Service Photo.
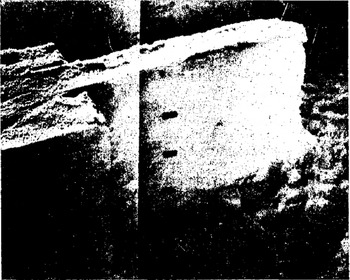
Fig. 2 Excavation of gage array I for photographic cross-section. U.S. Forest Service Photo.
Two gages were used in the study, about 10 m apart. During the period of observations, a settlement framework was released by a remote device after successive accumulations of snow.
Snow temperatures were measured by thermistors attached to the settlement frames as described in a previous report (Reference BergenBergen, 1968[b]). Densities were measured in pits dug about 15 m from the gages. Snow sampling tubes of the standard 500 cm3 SIPRE design were used in the density measurements. A weighing-bucket precipitation gage was maintained in the clearing on a platform about 30 m from the gage site.
Pattern of settlement
If the ith deposition layer is defined as the layer bounded above by accumulation and below by the previously dropped frame, the thickness of the layer, l i , may be written as
z i , z i–1 being the heights of the ith frame and the previous frame above the soil surface. In the case of the lowest layer just above the soil surface,
The average height of the layer, written z
i
, is (z
i
+ z
i–1)/2. The value of ![]() was used to correlate the data from the sample pit on density and other physical properties with a particular layer on the settlement gage.
was used to correlate the data from the sample pit on density and other physical properties with a particular layer on the settlement gage.
The settlement frames of the two gages were not always placed on the pack simultaneously; moreover, the electrical contacts for two of the settlement frames were defective with the result that different deposition layers correspond to the same sequence numbers for the two gages.
The intervals between measurements varied through the sequence. Settlement measurements were usually made when a new framework was lowered to the snow surface, after an accumulation of new snow.
The snow cover was dry until the last week of March. The rapid settlement between the 24 March and 5 April observations was during thaw conditions.
Snow samples for physical measurements were taken at successive 20 cm height intervals above the soil surface. Tubes were filled just above the soil surface (at a height of 5 cm) and at the surface by sinking the tube vertically into the snow. The trench used for density samples was extended about 2 m for each profile and back-filled for about 1 m. The distance from the sample pit to the two gages varied from 4 to 15 m as the trench was extended.
The density of a given snow sample can be readily measured to within 1% (Reference Bader and KuroiwaBader and Kuroiwa, 1962). Although some compaction occurs during the insertion of the sampling tube, the effect is found in almost all density measurements reported in the literature taken from standard SIPRE tubes. The most probable major source of error in estimating the densities in the gaged layers from the trench samples was non-uniformity of the snow deposit over the experimental area.
Some index of this non-uniformity during the accumulation phase was provided by measurements of snow temperature and total snow height. Snow temperatures measured at a height of 40 cm showed less than half a Celsius degree variation along a trench extended for more than 30 m some distance away from the gage assembly during night-time conditions with strong vertical gradients. Total snow height on the same trench varied less than 2 cm relative to the soil surface.
Correspondence of the measured densities with the densities at the gages could be checked indirectly by using the measured settlements at the 5th gage levels at both gages, which were centered at approximately 40 cm height and which showed appreciable contraction from 15 February to 21 March. The layer contractions (Table I) and density data (Table II) indicate that the ratio between the initial thickness of the 5th deposition layer at gage I to that at the end of the period was about 1.26; the corresponding density ratio is 1.22. The second gage shows a contraction ratio of about 1.16 for the same layer and period. Allowing for the estimated error in the settlement measurements, about 10% error in the estimate of the gage densities from the trench densities at a particular time and at the same apparent level seems reasonable. The errors introduced by the subsequent interpolation procedure needed to establish the time average of the local density at a particular depth are probably greater.
Table I. Contractions, temperatures, computed viscosities, and physical properties for selected layers

Table II. Density measurements
The density profiles corresponding to the mid-points of the intervals between settlement measurements ![]() , were estimated by linear interpolation in time at each level between the measured profiles density of Table II. These profiles were used to compute the overload σ as described below, and by comparison with the
, were estimated by linear interpolation in time at each level between the measured profiles density of Table II. These profiles were used to compute the overload σ as described below, and by comparison with the ![]() values, to estimate the average density of the layers during the settlement period. The average layer thickness
values, to estimate the average density of the layers during the settlement period. The average layer thickness ![]() for an interval was computed as the average of l
i
between the initial and final measurements for the interval. The overload for a given layer
for an interval was computed as the average of l
i
between the initial and final measurements for the interval. The overload for a given layer ![]() was computed as the total weight of snow above the height z
i
.
was computed as the total weight of snow above the height z
i
.
In these calculations, the density was assumed to vary linearly in the upper 20 cm of the snow cover, with the density of the surface tube sample representing the value 10 cm below the surface of the snow cover.
The above procedures could not be used to estimate either density or load for the interval from 23 January to 12 February. For this interval, the mid-point density for each layer was assumed to follow %Equation (2) above, and was evaluated from the density values of 12 February and from the measured layer contractions. The overload for this interval was estimated by subtracting the weight of the new snow accumulated in the weighing gage between 2 February and 12 February from the computed overload of 12 February.
The effective temperature for a particular layer was assumed to be the average of the temperature at that level in the snow cover at 14.00 h L.S.T. and 02.00 h L.S.T. measured with thermistors mounted on the settlement frames during the observation period.
The resulting estimates of loading and layer contractions were used via %Equation (1) to compute the settlement viscosity η. The estimated mean temperatures were used to correct the viscosities to a standard temperature of 0°C by means of Relation (4), with Q assumed to be 55.8 kJ. This value for Q is recommended by Reference BaderBader (1962) on the basis of a survey of published data, and is in accord with that computed by Reference Yosida, Yoshida and YosidaYosida and others (1956) from Haefeli's data (Reference Bader, Bader, Haefeli, Bucher, Neher, Eckel, Thams and NiggliBader and others, 1939) on snow with densities near 0.30 Mg m−3, temperatures near −5°C, and grain sizes in the vicinity of 1 mm. These conditions appear appropriate to the snow cover studied.
Temperature-adjusted viscosities η
0 are plotted against the average density ![]() in Figure 3.
in Figure 3.

Fig. 3 Variation of "temperature-adjusted settlement viscosity" for selected periods and layers plotted against the local layer density. Superscripts indicate estimated grain size in millimeters when available. The data points labeled DH are from depth-hoar layers. Letters refer to labels in Table I.
The interpretation of the settlement patterns is of course limited by the probable error in the measurement of the gage heights. An inspection of Figure 1 reveals a wealth of vertical strata, small compared to the height intervals between frames, and the temperature and density profiles show sharp linear gradients. While using the depth changes for consecutive settlement frames would more closely approximate the variation in these latter parameters, the error (5 mm) is such that the viscosities for an apparent change in thickness of a centimeter or so could be off by an order of magnitude. A more reasonable approach appeared to be to average the viscosities calculated from the observed displacements in adjacent layers to form an estimate for the viscosity corresponding to a total layer thickness of at least 5 cm over intervals for which the layer contraction exceeded about 3 cm. The gage resolution in such a case would then allow no more than 25% error in the calculated viscosities due to this factor alone.
The snow layers and intervals for which such calculations were made are indicated by the brackets in Table I. The calculated viscosities are plotted in Figure 1 against the estimated average density of the layer; the plotted points are identified by the letter labels given in Table I.
The accumulation at the time of the March measurements was the result of 18 storms ranging in size from 1 to 22 kg m−2.
The use of the estimated daily average temperatures to make the viscosity adjustments ignores the effect of the diurnal variations in temperature, which are pronounced in the upper 20 cm or so of the snow cover. The typical diurnal ranges in the average temperatures of the snow layers bounded by the upper two settlement gages are approximately 2 and 3 deg for the periods before 7 March, and 5 deg for the later periods. The effect on the apparent viscosity should be analogous to that of the annual temperature cycle correction considered by Reference BaderBader (1962) in his analysis for permanent polar snow deposits. However, the temperature regime observed in the annual snow cover is poorly approximated by a sinusoidal variation, particularly when temperatures are near 0°C at the snow surface. If a sinusoidal variation is assumed, then the viscosities for the upper layers would be over-estimated by about 10% using Bader's tabulated correction factors.
Results
The dashed lines on Figure 3 correspond to the envelope of Yosida's results reduced from a temperature of −3°C to 0°C by the same correction made for the Fraser measurements. Besides the latter results, the viscosities found by Reference KeelerKeeler (1967) from density measurements made in a natural snow cover, and viscosities computed from laboratory settlement measurements by Haefeli (Reference Bader, Bader, Haefeli, Bucher, Neher, Eckel, Thams and NiggliBader and others, 1939) are also plotted on Figure 3. These values have also been adjusted for temperature in the same fashion as the Fraser data. The superscript numbers on the plotted Fraser data are average grain size in millimeters for the layer, estimated from air-permeability measurements (Reference BergenBergen, 1968[a]) for layers where such data were available. Haefeli reported initial density and air permeability for his samples, and the resulting grain-size estimates are plotted with the data set. Keeler reported grain size from visual estimates for the snow layers sampled.
The agreement between the three plotted data sets and Yosida's relations is only fair; the measured viscosities fall below Yosida's data as densities decrease below about 0.24 g cm−3. The agreement between the plotted data sets is almost as poor, with the viscosities calculated from the Fraser data higher than either Keeler's or Haefeli's data. The Fraser data extend to somewhat lower densities than the published sets and show no marked change in the trend of the ρ(η 0) relation.
There appears to be no adjustment based on grain diameter that would bring the three sets of data into better agreement, although values for the depth-hoar layer, identified by the symbol DH, are anomalously high (as noted by Bader), and there is an apparent tendency for the viscosity at lower densities to increase with grain size.
Conclusions
The results cannot be said to argue convincingly for the validity of the exponential expression of %Equation (3), nor can deviations from that equation be explained by any direct correlation with grain size. The settlement viscosity is very likely a strong function of the rate of loading and/or the total thermal regime of the snow cover as well as the local density. Computed viscosities are in general agreement with those in the literature.


