


1. INTRODUCTION
Snow on the ground changes its microstructure continuously due to water vapour transport within the snow. This process, called snow metamorphism, depends on the environmental conditions. In simplified terms, isothermal conditions lead to the formation of a rounded snow structure and a temperature gradient causes faceting and depth hoar formation. Simultaneously, snow densifies due to the overburden pressure caused by its own weight. De Quervain (Reference De Quervain1958) measured the structural snow evolution under the influence of both temperature-gradient metamorphism and simultaneous densification. He found that typical depth hoar formation due to a temperature gradient was less pronounced when the snow was densified. De Quervain (Reference De Quervain1958) could analyse the snow microstructure only from single snow crystal photographs and thin sections taken at the end of the experiments. Today, micro-computed tomography (micro-CT) measures the full evolving three-dimensional (3-D) structure of snow. The microstructural changes modify the physical properties of snow, such as the thermal conductivity and mechanical strength (Calonne and others, Reference Calonne, Flin, Geindreau, Lesaffre and Rolland du Roscoat2014).
The influence of the thermal conditions on the microstructural snow evolution were investigated in time-lapse micro-CT experiments (e.g. Kaempfer and Schneebeli, Reference Kaempfer and Schneebeli2007; Pinzer and others, Reference Pinzer, Schneebeli and Kaempfer2012). Time-lapse micro-CT measurements enable a non-destructive 3-D and high-resolution observation of the snow-microstructure evolution. For such experiments, Schneebeli and Sokratov (Reference Schneebeli and Sokratov2004) and Pinzer and Schneebeli (Reference Pinzer and Schneebeli2009a) built an instrumented sample holder, the so-called Snowbreeder. With this sample holder a temperature gradient can be imposed on a snow sample, while the sample is scanned periodically in a Micro-CT.
Initially, with Snowbreeder 1 a constant temperature gradient was applied to a snow sample inside the Snowbreeder (Schneebeli and Sokratov, Reference Schneebeli and Sokratov2004). The bottom of the snow sample was heated with a film heater. With sensors both at the top and the bottom of the snow sample the heat flux and the snow temperature could be measured. With this experimental setup temperature-gradient snow metamorphism was observed directly for the first time. Schneebeli and Sokratov (Reference Schneebeli and Sokratov2004) measured the heat conductivity and found that it depends strongly on the snow structure and texture, even when the density stays constant. This showed the importance of a detailed understanding of the microstructural changes in snow. Pinzer and others (Reference Pinzer, Schneebeli and Kaempfer2012) showed in further experiments that individual snow grains do not grow during temperature-gradient metamorphism. A high mass turnover occurs and the ice mass is completely relocated within few days.
Pinzer and others (Reference Pinzer, Schneebeli and Kaempfer2012) refined the Snowbreeder 1. Alternating temperature gradients can be imposed to a snow sample in the Snowbreeder 2 by two Peltier elements at the top and the bottom. With the Snowbreeder 2 temperature variations similar to the diurnal cycle can be simulated. Pinzer and Schneebeli (Reference Pinzer and Schneebeli2009b) found that even under high-temperature gradients faceting does not necessarily occur, when the sign of the temperature gradient changes with a diurnal cycle. A rounded structure forms superficially similar to isothermal conditions. Even for higher periods than the diurnal cycle a rounded structure forms (M. Wiese and M. Schneebeli, unpublished data).
For the experiments of M. Wiese and M. Schneebeli (unpublished) the data transfer of the Snowbreeder was improved. The Snowbreeder has to rotate during the micro-CT measurements. At the bottom of Snowbreeder 2 cables are connected to slip rings to ensure the data transfer and Peltier-element control during the micro-CT measurements. At the top of Snowbreeder 2 a spiral cable was used. However, due to the low temperatures in the cold room moving cables undergo rapid fatigue. This problem was solved in Snowbreeder 3 by using another slip ring at the top. Based on the Snowbreeder 3, Scanco Medical built a similar Snowbreeder, the Snowbreeder 4, in which additionally different snow sample heights are possible (Scanco Medical, 2015, personal communication). Ebner and others (Reference Ebner, Grimm, Schneebeli and Steinfeld2014) extended the Snowbreeder construction, so that temperature-gradient metamorphism can be investigated under the influence of an airflow. The cryogenic cell developed by Calonne and others (Reference Calonne, Flin, Geindreau, Lesaffre and Rolland du Roscoat2014) allows temperature-controlled time-lapse tomography at room temperature.
With all these Snowbreeders important results on the influence of a temperature gradient on the snow microstructure were found. Settlement of snow is also a fundamentally important process. Experiments of snow settlement under isothermal conditions have been done for example by Schleef and Löwe (Reference Schleef and Löwe2013) and Theile and others (Reference Theile, Löwe, Theile and Schneebeli2011). Schleef and others (Reference Schleef, Löwe and Schneebeli2014) developed a microcompression device for time-lapse micro-CT measurements to analyse the structural evolution of snow during compaction under isothermal conditions. So far both temperature-gradient metamorphism and settlement have been investigated separately with micro-computed time-lapse measurements.
In order to investigate the structural snow evolution under the influence of both a temperature gradient and overburden pressure in micro-CT time-lapse measurements another Snowbreeder was constructed based on the Snowbreeder 4, which we present here. A passive load can be placed on top of the snow sample in addition to imposing a constant temperature gradient. The vertical stress due to the passive load leads to snow settlement. In the following sections, we describe in detail the construction and experimental setup of this Snowbreeder and show first measurement results.
2. CONSTRUCTION
The snow metamorphism experiments with the Snowbreeder 5 are done in a Micro-CT placed in a cold room at − 15°C (Fig. 1). The Snowbreeder inside the Micro-CT (Fig. 2) is controlled with a LabVIEW program from a computer outside the cold room. The same program is used for saving the measured data.
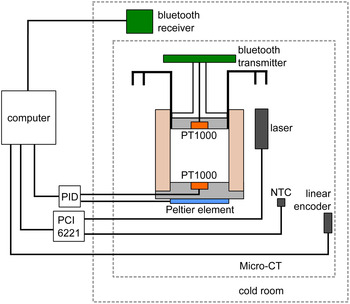
Fig. 1. Block diagram with the Snowbreeder 5 sensor locations and data flow.
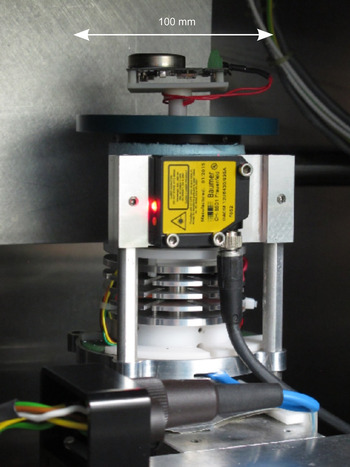
Fig. 2. Snowbreeder 5 inside the Micro-CT.
Like the previous Snowbreeders this new one is built to fit into the Micro-CT 80 from Scanco Medical. This desktop device provides enough space for cables for the Snowbreeder and the Snowbreeder itself. Additionally, this Micro-CT can run in the low temperatures inside the cold room. The temperature inside the Micro-CT changes as the X-ray tube heats up. To keep the temperature inside the Micro-CT constant a fan blows cold air from the cold room into the Micro-CT. With the heat from the X-ray tube and the cold air blown by the fan the temperature inside the Micro-CT can be varied.
The Snowbreeder is constructed such that micro-CT measurements are possible while imposing a temperature gradient on the snow sample and letting the snow settle. The Snowbreeder has a diameter of 100 mm and a height of 126.6–145 mm (Fig. 3). During a micro-CT measurement the snow sample is moved up and down and rotated by 360° by step motors. Light materials were used for the construction such that the load capacity of ~1 kg of the Micro-CT motors was not exceeded. No materials with high X-ray absorption coefficient, such as iron, were used around the snow sample to avoid image artefacts. Due to the rotation of the Snowbreeder, data are transmitted to the computer via a slip ring or wirelessly via Bluetooth. The bottom of the Snowbreeder contains a pin to mount the Snowbreeder in the Micro-CT.
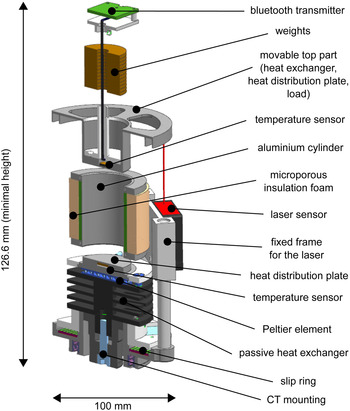
Fig. 3. Construction of the Snowbreeder 5.
To measure the absolute position of the Snowbreeder during time-lapse tomography, we installed a linear encoder (accuracy = ±1 nm) inside the Micro-CT. Thus, we measured the snow microstructure always at the same height in the snow sample and could position subsequent images of the time-lapse measurements absolutely.
The Snowbreeder consists of three parts, which can be taken apart to insert a snow sample. The top and bottom parts are both used to set the temperature gradient. The top part can additionally induce the snow settlement. The middle part consists of an aluminium cylinder (wall thickness of 0.5 mm) surrounded by a styrofoam cylinder (wall thickness of 7 mm), in which the snow sample is inserted. This part can be fixed with headless screws both to the top and the bottom part. The inner diameter of the aluminium cylinder, and hence the diameter of the snow sample is 34 mm.
The snow temperature is controlled with a Peltier element at the bottom of the Snowbreeder. The Peltier element and the snow sample are in contact via an aluminium heat-distribution plate. This plate leads to a homogeneous temperature of the snow bottom as the Peltier element is quadratic. On the other side of the Peltier element, a passive heat exchanger removes the heat arising from the Peltier element during cooling. The top part of this Snowbreeder consists of aluminium acting both as heat-distribution plate and passive heat exchanger. The snow temperature at the top is controlled by heat conduction through the top part and by setting the air temperature inside the Micro-CT. The highly porous styrofoam ring (WDS Ultra from Porextherm) around the snow sample thermally insulates the sample from the temperature inside the Micro-CT. The aluminium cylinder on the inner wall of the styrofoam ring acts as temperature guide. Due to the high thermal conductivity of aluminium (250 W K−1 m−1) the cylinder leads to a uniform vertical temperature gradient in the snow sample. The thin aluminium cylinder does not affect the X-ray image quality.
The temperature at the top and bottom of the Snowbreeder is measured with PT1000 thermal resistors (S665PFY40BC from Minco) inserted into the heat-distribution plates. The PT1000 at the bottom provides the temperature feedback for the temperature control of the Peltier element at the bottom of the Snowbreeder. The distance between the temperature sensor and the Peltier element is 6 mm. The Peltier element is controlled with a proportional-integral-derivative (PID) controller (TC0806 from Cooltronic) outside the cold room. The PID values of the PID controller are as follows: proportional gain = 30, integral gain = 1 and derivative gain = 50. In contrast to the Snowbreeder constructed by Pinzer and Schneebeli (Reference Pinzer and Schneebeli2009a) and Scanco Medical, the controller is programmed such that only a constant temperature can be set at the Peltier element.
The wiring of the Snowbreeder was constructed such that it allows for a full rotation of the Snowbreeder, which occurs during the time-lapse micro-CT measurements. Hence, the cables for the PT1000 and the Peltier element at the bottom are connected to an axial slip ring below the Snowbreeder. The data of the PT1000 at the top are transmitted wirelessly via Bluetooth. The Bluetooth transmitter is attached to the top part of the Snowbreeder. The Bluetooth receiver lies outside the Micro-CT in the cold room and is directly connected to the computer outside the cold room. The temperature values are read and saved by the LabVIEW program at a rate of 0.2 Hz.
In addition to the snow temperature, the air temperature inside the Micro-CT is measured with a NTC sensor installed close to the Snowbreeder. The data are transmitted via the NI data acquisition card PCI 6221 to the computer outside the cold room. At a rate of 0.2 Hz an average value of 10 values is measured and saved.
The settlement of the snow sample is induced by placing a passive load on top of the snow sample. This top part of the Snowbreeder lies on top of the snow sample and can slide downwards inside the aluminium cylinder as the snow settles due to the weight. Ten additional weight discs can be inserted into this part to increase the vertical stress on the snow sample. These metal discs have a diameter of 30 mm and a weight of 10 ± 0.02 g each. The minimum weight on the snow sample, i.e. the weight of the top part without the extra weights, is 61 g. The maximum weight is 161 g, when all ten discs are inserted. Additionally, the top part can be fixed with headless screws on the aluminium cylinder, so that no settlement occurs. The different weights on the snow sample simulate different snow heights on top of the snow sample (Table 1). The vertical stress σ and the snow depth h s of snow lying on the snow sample according to the chosen weight can be calculated as follows:
 $$\sigma = \displaystyle{{m_{\rm s}g} \over {A_{\rm s}}}, $$
 $$h_{\rm s} = \displaystyle{\sigma \over {\rho _{\rm s} g}},$$
where m s, A s and ρ s are the mass, area and density of the overlying snow.
Table 1. Overview of the weights w and vertical stresses σ applied to the snow sample. The weight of the empty top part corresponds to the minimum and the full top part with all weight discs is the maximum. The according snow depths h s of snow with two different densities ρ s are calculated as an example with Eqn (2)
The settlement is measured with a laser sensor (OADM 12I6430/S35A from Baumer) measuring the distance to the rim of the top part. The laser is fixed with a metal frame on the side, which does not move during a CT measurement, so that the image does not get disturbed by the laser. The data from the laser are also transmitted via the NI data acquisition card PCI 6221 to the computer outside the cold room. Like the measured temperatures, the distance measurement data are saved with a rate of 0.2 Hz by the LabVIEW program. The measurement range of the laser is 10 mm between 16 and 26 mm distance and the resolution is 5 µm.
The temperature gradient across the snow sample leads to water vapour transport, also into the narrow free space between the aluminium cylinder and the top part of the Snowbreeder. To prevent the sliding top part from freezing due to the water vapour transport, it is lubricated with a thin film of silicone grease, so that the movement is not disturbed.
The sample height has to be in the range of 23–33 mm due to the measurement range of the laser. To have unconstrained conditions at the walls during settlement, the height of the snow sample should be chosen to be half of the diameter of the snow sample, i.e. a height of 17 mm (ASTM International, 2011). Since this is below the minimum sample height at which the laser can still measure the distance, the snow sample has to be raised by inserting an ice lens at the bottom with a height of up to 16 mm. In any case, an ice lens has to be inserted at the warmer end of the snow sample as a water vapour supply. Without an ice lens, an air gap would form between the heat-distribution plate and the snow sample at the bottom or an apparently increased settlement would be measured at the top due to sublimation.
3. MEASUREMENTS
The goal of measurements with the presented Snowbreeder 5 is the analysis of the microstructural snow evolution under the influence of both a constant temperature gradient and an overburden pressure, similar to natural conditions.
In the first two test experiments, we measured the settlement under isothermal conditions and a constant temperature gradient of 43 K m−1. For both experiments, we took nature-identical snow, which was stored in a styrofoam box for several months to get rounded (Fig. 4a). The initial snow density was ~230 kg m−1. The initial specific surface area (SSA), i.e. the ratio of the ice surface area to the ice mass, was 13.25 m2 kg−1 and the initial pore size was 0.5 mm for both experiments. We placed the maximum weight of 161 g on top of the snow sample. For the isothermal conditions, we turned off the Peltier element and controlled the snow temperature only with the air temperature inside the Micro-CT, which was set to −10°C in both experiments. The temperatures measured at the top and the bottom of the Snowbreeder were stable (± 0.1°C) besides a small increase of maximum 0.3°C during the micro-CT measurements (Fig. 5). In comparison, the temperatures of the Snowbreeder developed by Ebner and others (Reference Ebner, Grimm, Schneebeli and Steinfeld2014) showed variations of ~± 0.4°C and an increase of up to 0.5°C during micro-CT measurements. We improved the temperature stability of Snowbreeder 5 primarily with an improved ventilation of the Micro-CT to prevent the effects of temperature variations in the cold room that occurred in the measurements of Ebner and others (Reference Ebner, Grimm, Schneebeli and Steinfeld2014). Secondly, we use different PID values for the controller of the Peltier element. Compaction changes the temperature gradient due to a decreasing sample height. However, the change is <2% for a deformation of up to 2%.
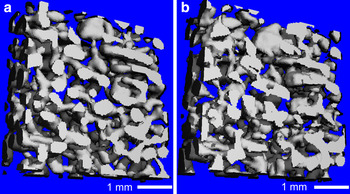
Fig. 4. Reconstructed micro-CT images of the temperature-gradient experiment at the beginning (a) and after 4 d (b). The temperature gradient in the snow sample was 43 K m−1.
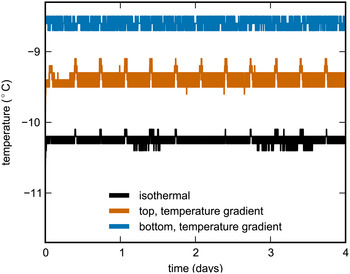
Fig. 5. Top and bottom temperature measured at the Snowbreeder during the isothermal and the temperature-gradient experiment. In the isothermal experiment, both temperatures were the same, in the temperature-gradient metamorphism experiment the temperature gradient in the snow sample was 43 K m−1.
For the micro-CT measurements we chose the peak energy and the current of the X-ray tube to be 45 kVp and 88 µA, respectively. The integration time was 300 ms and the voxel size was 36 µm. We measured a height of 5.6 mm in the middle of the snow sample. With these settings one measurement took 50 min. The measurement duration of one scan should not be much longer. A small imbalance of the top part of the Snowbreeder disturbs the distance measurements during a micro-CT measurement. Because the Snowbreeder rotates during the measurement, the imbalance of the top part leads to large variations in the distance measured by the laser. Therefore, the distance data are unusable during a micro-CT measurement. We took a micro-CT measurement every 8 h.
According to Eqn (2) we calculated the stress of the snow's own weight to be 38 Pa for a sample height of 17 mm and a snow density of 230 kg m−3. Compared with the stress of the passive load, i.e. 1736 Pa, the additional stress of the snow is 2%, which we consider negligible. Hence, the density measurements in the middle of the snow sample are representative for the whole snow sample, because the stress differs only by 38 Pa between the top and the bottom of the sample.
For the analysis of the 3-D images we selected a cubic volume of interest (VOI) within the entire image. This VOI had a side length of 5.4 mm, according to the representative volume of snow. We applied a Gauss filter with a sigma of 1 and a support of 2 voxels and segmented the greyscale images into ice and air voxels with a threshold based on the histogram of the greyscale values. The density calculation in the segmented VOI was voxel-based and the SSA was calculated by triangulation of the ice surface. We did the entire image processing with IPL (Image Processing Language, developed by Scanco Medical AG).
4. FIRST RESULTS
In both experiments, we measured a monotonous decrease in snow height. We calculated the strain ε from the measured laser distance d l as follows:
 $${\rm \varepsilon} = \displaystyle{{d_{{\rm l,0}} - d_{\rm l}} \over L},$$
where d l,0 is the initial distance measured with the laser and L is the height of the snow sample, which was L = 17.64 and L = 17.17 mm in the isothermal and in the temperature-gradient experiment, respectively. Due to settlement the strain increased temporally in both experiments (Fig. 6). This increase slowed with time due to the decreasing settlement. The strain increase was slower under the influence of a constant temperature gradient than under isothermal conditions.
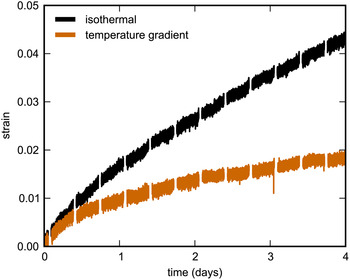
Fig. 6. Temporal strain evolution calculated from the laser distance measurement with Eqn (3). The temperature gradient in the snow in the temperature-gradient experiment was 43 K m−1.
Corresponding to the settlement, we measured the snow densification in the micro-CT images of both experiments (Fig. 7). In the isothermal experiment, the strain increased by 4.3% and in the temperature-gradient experiment the strain increased by 1.9%. This strain increase corresponds to a density increase of 10.2 and 4.3 kg m−3, respectively. We measured a density increase of 8.6 and 7.1 kg m−3 in the isothermal and in the temperature-gradient experiment, respectively. The difference between the density increase calculated from settlement versus the increase observed in the images may have several reasons. We guess that temperature-gradient metamorphism led to an inhomogeneous density distribution, which could not be observed in the imaged volume.
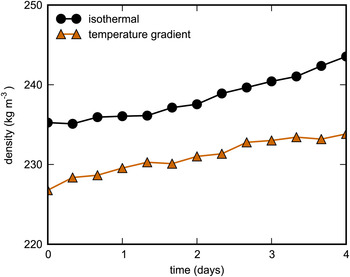
Fig. 7. Temporal evolution of the snow density derived from the micro-CT images. The temperature gradient in the snow in the temperature-gradient experiment was 43 K m−1.
In both experiments, the SSA decreased with time due to coarsening of the snow structure. We observed a stronger SSA decrease in the temperature-gradient experiment. In this experiment, additionally faceting occurred parallel to the densification due to the imposed temperature gradient (Fig. 4b).
We estimated the compactive viscosity η of the snow from the strain rate $\dot \varepsilon $
. The strain rate
$\dot \varepsilon $
. The strain rate $\dot \varepsilon $
is related to the applied vertical stress σ by (Schleef and Löwe, Reference Schleef and Löwe2013):
$\dot \varepsilon $
is related to the applied vertical stress σ by (Schleef and Löwe, Reference Schleef and Löwe2013):
 $$\dot \varepsilon = \displaystyle{1 \over L}\displaystyle{{\Delta L} \over {\Delta t}} = \displaystyle{{v_{\rm s}} \over L} = \displaystyle{\sigma \over \eta}, $$
where L is the height of the snow sample and v s is the settlement velocity. Hence, we calculated the compactive viscosity η as follows with the measured settlement:
 $$\eta = \displaystyle{{\sigma L} \over {v_{\rm s}}}. $$
The stress applied by the maximum weight on the snow sample was 1736 Pa (Table 1). After 12 h the viscosity was still similar in both experiments with values of 10.6 and 8.2 GPa in the temperature-gradient experiment and in the isothermal experiment, respectively. After 4 days, the compactive viscosity increased stronger in the temperature-gradient experiment than in the isothermal experiment, according to the observed strain rate, resulting in values of 32.4 and 14.1 GPa, respectively.
In the temperature-gradient experiment, the snow temperature was maximum 1.7°C higher than in the isothermal experiment. This temperature difference corresponds to a 0.6% difference in homologous temperature, i.e. the ratio of the snow temperature to the melting point of snow.
5. CONCLUSIONS
We developed the new Snowbreeder 5, which imposes a constant temperature gradient on a snow sample and induces settlement simultaneously while measuring the snow microstructure with time-lapse micro-CT measurements. The temperature gradient is set with a Peltier element at the bottom and controlling the air temperature at the top. A passive load is placed on top of the snow sample to induce the settlement. By inserting several weight discs the vertical stress can be varied. By this the overburden pressure of snow of various heights, typical for a natural snowpack, can be simulated on top of the snow sample. The settlement is measured with a laser distance sensor. Simultaneous snow temperature measurements are enabled by wireless data transfer via Bluetooth at the top of the Snowbreeder.
We did two test experiments with rounded snow under isothermal conditions and a constant temperature gradient. In both experiments, we observed a temporal increase in strain, density and compactive viscosity due to settlement. Especially in the temperature-gradient experiment the density increased less in the 3-D images than calculated from settlement, which might have resulted from an inhomogeneous density distribution due to temperature-gradient metamorphism. However, in future we can additionally measure the full snow sample to attain more data on the structural snow evolution, which should show a density increase matching the settlement. Measuring the full snow sample will require more measuring time, which leads to the loss of more distance measurements. But since the snow height decreased monotonously less distance data are required.
The calculated compactive viscosity for the isothermal experiment was in the range of the values for snow of a density ~230 kg m−3 given in Shapiro and others (Reference Shapiro, Johnson, Sturm and Blaisdell1997). In the temperature-gradient experiment, the compactive viscosity increased about twice as fast compared with isothermal conditions. We can exclude that the top part of the Snowbreeder was frozen. After both experiments we could lift up the top part of the Snowbreeder. Hence, the weight on top of the snow sample moved freely during the experiments. We can also exclude a strong effect of different snow temperatures in both experiments, because the homologous temperature differed only by 0.6% between both experiments. Additionally, based on the temperature difference, the isothermal sample should have settled slower than the temperature-gradient sample. We hypothesise that temperature-gradient metamorphism influences settlement by increasing the compactive viscosity. Further experiments with the Snowbreeder 5 will shed light on the reasons for the strain-evolution dependence on the temperature gradient in the snow.
ACKNOWLEDGEMENTS
The development and construction of the Snowbreeder 5 was supported by the Swiss National Science Foundation project number 200021_143839. We thank Matthias Jaggi, the workshop at the SLF and especially the apprentice Luca Frank. Moreover, we thank Scanco Medical for their support. Construction plans are available on request from the authors.


 Open access