Introduction
The interpretation of landforms in formerly glaciated areas is fundamental to reconstruction of the ice dynamics of past glaciations. Studies based on satellite imagery (e.g. Reference ClarkClark, 1993;Reference Clark and StokesClark and Stokes, 2001;Reference Stokes and ClarkStokes and Clark, 2002, Reference Stokes and Clark2003a, Reference Stokes and Clarkb;Reference Dunlop and ClarkDunlop and Clark, 2006) and swath bathymetry (e.g. Reference Canals and UrgelesCanals and others, 2000, Reference Canals2002; Reference Wellner, Lowe and ShippWellner and others, 2001; Reference Cofaigh, C., Pudswey, Dowdeswell and Morris.O Cofaigh and others, 2002, Reference Cofaigh, C.2005;Reference Lowe and AndersonLowe and Anderson, 2003; Reference Evans, Dowdeswell, Cofaigh and BenhamEvans and others, 2006) have established an association between different types of landform and the inferred ice velocity. For example, in the former Laurentide ice sheet, coherent patterns of subglacial bed forms have elongation ratios that vary in proportion to the inferred ice velocity (Reference Stokes and ClarkStokes and Clark, 2002). Ribbed moraine and drumlins (two members of a continuum of subglacial bed forms (Reference RoseRose, 1987)) are thought to be indicative of the onset zone, where ice flow speeds are relatively slow, while megascale glacial lineations (MSGLs) with lengths up to 13 km develop further downstream in the fast-flowing trunk of the ice stream. Such bed-form assemblages are found in highresolution bathymetric images of the Antarctic continental shelf (Reference Wellner, Lowe and ShippWellner and others, 2001;Reference Cofaigh, C., Pudswey, Dowdeswell and Morris.O Cofaigh and others, 2002; Reference Lowe and AndersonLowe and Anderson, 2003). It is argued from the offshore data (Reference Wellner, Lowe and ShippWellner and others, 2001) that drumlins form where ice flows over a basal transition zone between crystalline bedrock and sediments. The speculation is that the ice accelerates from slow sheet flow to fast streaming flow as the transition from bedrock to sediment is crossed. Thus the Antarctic examples (Reference Wellner, Lowe and ShippWellner and others, 2001; Reference Cofaigh, C., Pudswey, Dowdeswell and Morris.O Cofaigh and others, 2002;Reference Lowe and AndersonLowe and Anderson, 2003) describe a simple progression from eroded crystalline bedrock through a transition zone with thin sedimentary cover and drumlinoid bed forms to a soft sediment substrate with MSGLs. This apparently straightforward Antarctic interpretation contrasts with a more complex North American case. Beneath the Dubawnt Lake palaeo-ice stream, the substrate was mixed crystalline bedrock and soft (unmetamorphosed) rock, particularly in the onset zone, yet drumlins and MGSLs are found overlying both hard and soft rocks (Reference Stokes and ClarkStokes and Clark, 2003a, Reference Stokes and Clarkb). In this case, there is no clear relationship between the nature of the substrate and the distribution of bed forms.
There are few observations of the shape, internal structure or setting of bed forms beneath modern ice sheets that can be used to link definitively geomorphology to ice dynamics. Reference SmithSmith and others (2007) described the formation of a drumlin within a 7 year period beneath the fast-flowing (>350ma–1) part of Rutford Ice Stream, West Antarctica. Repeated seismic surveys were conducted over the same location in 1991, 1997 and 2004. Between the first two surveys, a section of the bed approximately 500 m wide was eroded by 6m. Between the second two surveys a drumlin 10 m high and 100 m wide formed within the same section of the bed that had undergone erosion.
Here we present high-resolution seismic and radar images from the onset zone of Rutford Ice Stream which show a variety of streamlined subglacial bed forms in an area where the flow speed increases from 72 to >200 m a–1 and water-saturated and unconsolidated sediment is widespread. This work establishes an observational baseline for future monitoring of bed-form evolution in this location.
Location
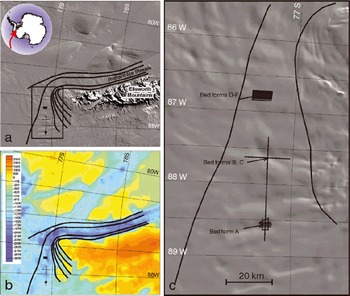
We surveyed the onset region of Rutford Ice Stream (Fig. 1). This is the area where the main flow element of the ice stream accelerates and converges, delivering ice from the north and west of the Ellsworth Mountains into the trunk of the ice stream that flows down the eastern side of the mountains. The trunk of the ice stream flows in a deep, welldefined bedrock trough (Fig. 1b), while the onset region is underlain by a series of basins. The southern margin of the flow in the onset region is well defined on satellite images (T. Haran and others, http://nsidc.org/data/nsidc-0280.html)

Fig. 1. (a) Location map. Background image is moderate-resolution imaging spectroradiometer (MODIS) visible satellite image (Haran and others, http://nsidc.org/data/nsidc-0280.html). Rutford Ice Stream drains ice from the west and northwest of the Ellsworth Mountains and flows to the southeast. Lines delineate different flow elements that coalesce into the main trunk of the ice stream. Inset shows location in Antarctica, and box shows limits of (c). (b) Bedrock elevation map based on British Antarctic Survey aerogeophysical surveys. Scale bar is in metres relative to sea level, green and blue colours are below sea level, and orange shades are above sea level. (c) Detailed locations of lines used in this study (a subset of a larger survey).
(Fig. 1a) and overlies a bedrock step that marks the edge of the mountain block. The northern margin appears more diffuse and the location appears to be only partially controlled by bed topography.
Over the area of our survey the flow accelerates from ∼72 to >200 m a–1 (as measured by global positioning system (GPS) monitoring of marker poles) over a distance of ∼-60 km. The width of the ice stream reduces from 37 to 17 km over the same distance. The ice is 2200–3200 m thick and the flow volume is about 8 Gta–1 (approximately 50% of the flux across the grounding line of the ice stream).
Data Acquisition
Seismic data
The data were acquired using 300 g explosive charges fired at 20 m depth in holes drilled using hot water. The receiving array comprised 72 geophones spaced at 10 m intervals with the first geophone located 30m from the shot hole.
The geophones had a natural frequency of 100 Hz and were critically damped. The signals were recorded on a Bison 9000 digital seismograph at a sample interval of 0.2 ms. The shot spacing was 360 m, and one-half of the geophone array was moved to the front of the line after each shot, so the recording geometry was single-fold. Shots were fired only when wind speed was below 10 knots (18.5 km h–1), ensuring low ambient noise. As a result of the low-noise environment and the use of energetic high-explosive charges, the signal:noise ratio of the data is very good. A portion of one line was shot with closer shot hole spacing, allowing six-fold recording. The data from this section were used for analysis of interval velocities in the sub-ice material, which is not possible with single-fold data. This experiment showed that the average seismic velocity in the sub-ice material was 1815 ± 25 m s–1 (Reference King and WoodwardKing and others, 2004). Processing of the seismic data involved bad trace removal, static corrections, spherical divergence correction, bandpass filtering, normal move-out correction and migration.

Fig. 2. Line drawing of a single-fold seismic profile parallel to the flow direction of Rutford Ice Stream. Ice flow is from west to east, flow velocities were determined from GPS surveys. No shading is ice, light shading is poorly consolidated sediment (seismic velocity =1815 m s–1, determined from a walk-away experiment), and darker shading is consolidated sediment (seismic velocity = 3000 m s–1). Vertical axis is twoway travel time; depth scale on the left is approximate. Horizontal axis is in kilometres.
Radar data
The radar data were acquired with the British Antarctic Survey’s DELORES (Deep Look Radio Echo Sounder) system. This is a monopulse radar capable of operating between 1 and 20 MHz. The transmitter comprised a Kentech pulse generator that produced ±2000 V pulses at a repetition rate of 1–5 kHz. The data presented here were acquired with dipole antennae of 40 m length that have a peak frequency of 1 MHz. The receiving system comprised an identical antenna pair coupled to a digital oscilloscope via a balun and amplifier. Three thousand pulses were stacked for each trace. Processing involved bandpass filtering, a gain function, a two-dimensional median filter to remove noise spikes and Kirchhoff migration.
Data Description
We have acquired a total of 60 km of seismic lines and >1000 km of radar lines in the onset area (Fig. 1b shows the subset of these data used in this paper). Within this network we have identified four key bed forms or bed-form groups which will each be described in this section. The main flowparallel seismic line (Fig. 2) links three of these bed forms together; it shows an undulating bed to the ice stream 2400– 2900 m below the surface (1200–1700m below sea level).
Bed form A
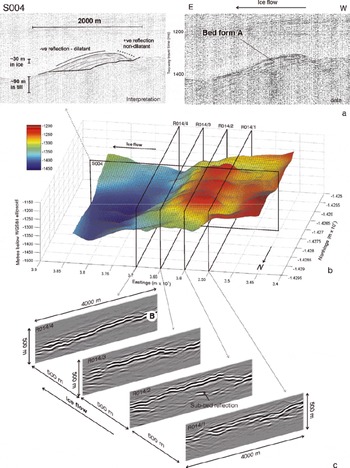
Bed form A was delineated using one seismic section (Fig. 3a) and a grid of seven radar profiles (Fig. 3b and c). In seismic cross-section, the 1.5 km long bed form has a rough upstream side and a smooth downstream side. A subhorizontal reflector occurs at 82 ms two-way travel time below the ice base, and some of the bed-parallel reflectors downlap onto it. If we assume that the sub-ice material has a seismic wave speed of 1815 ± 25 m s–1, then the thickness of material is about 74 m.
The bed form has a roughly rectangular shape, 2 km wide in the cross-flow direction and 1.5 km in the along-flow direction (Fig. 3b). The three-dimensional view (Fig. 3b) emphasizes that there are three distinct high points on a generally streamlined form and there is a moat around the front and sides.
On some of the radar profiles (Fig. 3c) there is a reflector below the ice base. Careful consideration of the cross-line data shows that this event is not an off-line diffraction but is a genuine sub-bed reflection. Depth conversion with a radar wave speed of 0.05 m ns–1 (a value suitable for watersaturated sand or silt) gives a thickness of 50–100m, consistent with the seismic data.
To our knowledge, there have been no previous documented cases of sub-bed penetration of radar energy beneath such thick ice. The radar system used had a 2 kV transmitter and we stacked 3000 radar shots for each trace. These values are higher than for previous systems used in this region of Antarctica, which may account for the better performance. Also, the close grid of lines is crucial in eliminating doubt about the origin of particular events. The observation of a sub-bed reflector suggests that the pore-water in the sediments is fresh, as the presence of solutes would cause strong attenuation of the radar signal.
Bed form B
Bed form B is crossed by two lines, both with seismic and radar profiles (Fig. 4). The bed form in longitudinal profile (Fig. 4a and b) is 6 km long and 500 m high. It has a relatively steep upstream side and a lower-angle, smooth downstream side. The seismic profile shows few coherent returns below the ice base on the upstream side but numerous returns on the downstream side.
The cross profiles (Fig. 4c) show that the feature is a ridge running across the ice stream. There is a notch or saddle in the ridge 1 km to the south of the crossover with the longitudinal line, and a larger notch (2 km across, 200 m deep) centred 3.5 km to the south of the crossover. The crest of the ridge is apparently horizontal for 2.5 km northwards from the crossover, then undulates with a mean apparent slope downward to the north.
Bed form C
Bed form C was delineated using a grid of nine radar lines and two seismic lines. Orthogonal to flow there is a package of reflectors (Fig. 5b), mounded in the cross-flow direction and with internal reflectors that dip to the north and progressively terminate against an underlying reflector. The same reflector package when seen in the along-flow direction (Fig. 5a) has a rough steep upstream end and a smooth low-angle downstream end.
Bed forms D–F
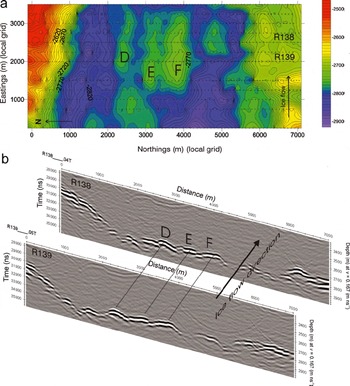
Bed forms D, E and F were identified and mapped with a grid of radar lines. This grid covered a 7 km x 3.5 km area with lines spaced at 250 m intervals (Fig. 6a). The bed topography map derived from these data shows a group of three elongate bed forms 300–500 m wide and 1.2–1.6 km long (Fig. 6a). These features are smooth mounds in crosssection (Fig. 6b).

Fig. 3. Detail of bed form A. (a) Seismic profile. (b) Three-dimensional wireframe view of the bed form from the northwest. Northings and eastings in polar stereographic coordinates. Open rectangles show locations of the seismic and radar profiles. (c) Radar profiles at 500 m intervals across bed form A. Radar used was a 1 MHz monopulse unit. The bed is the most prominent reflection, labelled B on line 14/4. Note on line 14/2 the prominent reflector below the bed.
Interpretation
In this section we first describe what the bed material is and the geological background. We then provide our interpretation of each of the bed forms.
Reference King and WoodwardKing and others (2004) showed that the material forming the bed of the ice stream over the majority of the area was dilatant till (Reference Atre and BentleyAtre and Bentley, 1993;Reference SmithSmith, 1997a, Reference Smithb), i.e. soft water-saturated material undergoing active deformation due to shear between the mobile ice above and more consolidated sediment beneath. The till probably overlies marine sediment in the trough occupied by the ice stream. The present bed elevation is approximately 1200–1600m below present sea level. Hence, this area would have been below sea level during the last Interglacial, even allowing for isostatic rebound. The situation is therefore analogous to that of the Siple Coast ice streams where aerogeophysical and ground seismic surveys suggest an extensive marine sediment drape in those areas below the isostatically adjusted palaeo-shoreline (Reference BlankenshipBlankenship and others, 2001; Reference Studinger, Bell, Blankenship, Finn and ArkoStudinger and others, 2001). The marine units overlie rift basin sediments in narrow fault-bounded troughs formed during Jurassic or Cenozoic extensional tectonics. The trough occupied by Rutford Ice Stream is part of the same West Antarctic rift system (Reference Dalziel and LawverDalziel and Lawver, 2001).

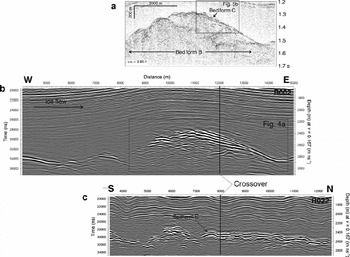
Fig. 4. Seismic and radar lines over bed form B: (a) seismic profile in the flow direction; (b) radar profile in the flow direction; (c) radar profile in the cross-flow direction.
We have identified streamlined bed forms at several different scales (bed forms A–F, Figs 3–6). The common characteristics are: (i) steep upstream faces with positive polarity bed reflections and short discontinuous internal reflections; and (ii) smooth downstream tails with negative polarity bed reflectors.
Bed form A is difficult to classify. Based on the bed morphology alone, one interpretation would be that it is a group of three closely spaced drumlins. However, the radar profiles suggest that it is a single body of soft sediment, presumably till, and therefore a description of drumlinized transverse moraine may be more appropriate. The size and form match those of the ‘broad rectangular’ type of ribbed moraine ridges in the classification of Reference Dunlop and ClarkDunlop and Clark (2006), but ribbed moraines are normally found in large groups and we have only mapped a single bed form. The internal structure shown by the seismic line suggests a migrating depositional feature rather than an erosional feature because the internal reflectors are conformable with the bed rather than truncated by it. There are similarities in size and shape between bed form A and the group of drumlins D, E and F and it is possible to view bed form A as a prototype of the downstream group. Thus, while a good morphological description may be drumlinized transverse moraine, a process description may be proto-drumlin.
Bed form B is streamlined only in vertical profile; in plan, it is a ridge orthogonal to the flow direction. Our interpretation is that the upstream face of the ridge is undergoing erosion and has no significant covering of till, whereas the downstream face is a zone of till deposition. It may be described as a crag-and-tail feature, but in this case the ‘crag’ is a linear ridge rather than an isolated bedrock high.
Bed form C is an elongate, smooth mound with an elongation ratio of approximately 4:1, located in the deposition zone of bed form B. We interpret this feature as a drumlin, and the seismic evidence is that depositional surfaces within the drumlin dip both down-flow and crossflow (with respect to the gross ice-stream flow direction). If the internal depositional surfaces indicate the direction of migration of the bed form, then there may be an element of localized flow at the bed that is aligned at an angle with the main ice flow.

Fig. 5. Seismic data and interpretations for orthogonal lines crossing bed form C, a small drumlin located on the tail of bed form B (shown in Fig. 4a). Vertical axis is time, and point of crossover is shown by lines marked ‘X’. Vertical scale bar is distance in ice with a sound velocity of 3860ms−1. (a) Cross profile shows a mound of sediment with a maximum thickness of about 150m (assuming low-velocity sediment at 1815ms−1) which has internal reflectors dipping to the north. (b) Longitudinal profile images only the northern flank of the feature. Apparent length:width ratio for this drumlin is 3.5 : 1.0. Yellow, orange and red colours denote subunits of the unconsolidated sediment shaded light grey in Figure 2.
Bed forms D–F are a group of closely spaced drumlins 1.2–1.6 km long occupying the centre of a small basin. We do not have seismic data over these features and there is no indication of sub-bed penetration of radar energy as seen at bed form A. There are a number of similarities of scale and form between this group of bed forms and bed form A.
The surface flow speed at the location of bed form A is ∼72 m a−1 and at the location of bed forms D-F is ∼125 m a−1. Our interpretation is that at lower flow speeds on Rutford Ice Stream, till deposition results in transverse moraines, while at higher flow speeds drumlins are the normal form. This matches the downstream evolution of subglacial bed forms suggested by Reference Dunlop and ClarkDunlop and Clark (2006, see fig. 19).
Discussion
In the lower, faster-moving part of Rutford Ice Stream, erosion and deposition at the bed has been observed directly and proceeds at high rates, resulting in the formation of a drumlin within 7 years (Reference SmithSmith and others, 2007). The evidence presented here suggests that the onset region of the ice stream is also an active sedimentary system with areas of both erosion and deposition.
Considering bed forms A and C, the bed over the downstream tail is smooth and has a negative polarity reflection, indicating the presence of dilatant till which is sediment undergoing active shearing and transport (Reference Alley, Blankenship and BentleyAlley and others, 1986; Reference SmithSmith and others, 2007). Conversely, the upstream side is steeper, rougher, has a positive polarity reflection and has a number of short discontinuous reflectors apparently truncated at the bed. Truncation and possible distortion of reflectors on the upstream side strongly suggests erosion and/or deformation there (Fig. 3a). This combination of features is compatible with the classical deforming-bed hypothesis of drumlin formation (Reference BoultonBoulton, 1987). During Interglacials it is likely that this area would have been an enclosed deep marine basin, either open ocean or covered by ice shelf. In such a setting, laterally continuous near-horizontal stratified sediments would be expected. The internal structures we have observed are not horizontal and are truncated at the bed only on the upstream side of the bed forms; they are therefore not compatible with a hypothesis of formation by erosion of pre-existing horizontally bedded interglacial glacio-marine sediments.
The features revealed by the seismic imaging are entirely compatible with a presently active system of subglacial sediment deformation; however, the question arises as to whether the features observed are the result of a previous ice dynamic regime that are now being either passively overridden or modified by current ice flow. Were the bed forms generated under a different flow direction, a different flow speed or under thinner ice? The only way to determine unequivocally whether the bed forms are presently active would be to perform repeat seismic surveys in several years’ time to investigate any changes in the location and form of the drumlins. In the meantime we consider the balance of probabilities to be in favour of a presently active drumlin-forming system for the following reasons: (i) The location of the Rutford Ice Stream is controlled topographically by a well-defined basal trough, particularly the southern margin (Fig. 1); it is therefore unlikely that the ice flow direction has changed significantly since streaming flow became established. (ii) Theoretical treatments of drumlin formation as the evolved form of an instability in the viscous flow of a till layer (Reference HindmarshHindmarsh, 1998;Reference FowlerFowler, 2000) predict that the timescale for drumlin formation is of the order of years to a few decades. Thus drumlins form quickly and they travel downstream at a rate slightly less than the basal ice speed (Reference FowlerFowler, 2000). This means that, if we see drumlins with internal architecture conformable with the present ice base, then they are likely to have formed under the present flow regime. (iii) The bed is 1200–1600 m below present sea level, therefore ice here must be thick to be grounded at all: there is no reasonable scenario for the observed drumlins to have formed beneath the thin margin of an expanding ice sheet to be subsequently overridden by the ice stream. Thus our interpretation is that the observed drumlins are in a state of growth or maintenance under present flow conditions, in an area of accelerating flow.

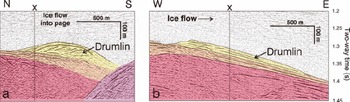
Fig. 6. (a) Contour plot of close-spaced grid of radar lines showing bed forms D, E and F. North Is to the left. (b) Two of the radar profiles used In construction of part (a), showing continuity of mounded features.
The drumlin observed by Reference SmithSmith and others (2007) formed from deforming till within a period of 7 years. That drumlin is lower (10 m vs 30–50 m) and narrower (100 m vs 200– 500 m) than those described here, but may be about the same length (1200–1600 m).
A good analogue for the onset region of Rutford Ice Stream is the offshore area at the mouth of George VI Sound (Reference Cofaigh, C., Pudswey, Dowdeswell and Morris.O Cofaigh and others, 2002, fig. 2). The swath bathymetry image shows a complex area of crudely streamlined bed forms, often with fluted top surfaces (cf. bed form A) as well as occasional small drumlins (1–2 km long) of classical form (cf. bed forms C–F) and areas of low-relief topography draped by sediment (cf. the basin on line S004 between 13 and 21 km (Fig. 2)).
Summary
We have shown the form and internal structure of streamlined bed forms beneath a modern ice stream. The bed forms include transverse moraine large-scale crag and tail and drumlins. The transverse moraine and drumlins comprise unconsolidated sediment, with deforming till at the ice–sediment interface, lying over consolidated sediment. The internal sedimentary structures are consistent with downstream and cross-stream migration or growth. The elongation ratios, the acoustic properties and the form and distribution of the bed forms are similar to features seen in palaeo-ice-stream tracks on the Antarctic continental shelf. These data provide a baseline for future surveys of the same features that will determine whether they are evolving.
Acknowledgements
We acknowledge the field support provided by C. Bailey, J. Bursnall, G. Middleton and C. Griffiths, together with the operations staff of Rothera Research Station. We thank A. Nygard and an anonymous reviewer for their constructive comments.