


1. Introduction
Jakobshavn Isbræ (Greenlandic: Sermeq Kujalleq), an outlet glacier in West Greenland that drains >5% of the Greenland ice sheet (Reference Rignot and KanagaratnamRignot and Kanagaratnam, 2006), is currently undergoing a rapid retreat. In the late 1990s the lower glacier began to thin (Reference Abdalati and SteffenAbdalati and Steffen, 2001; Reference Thomas, Abdalati, Frederick, Krabill, Manizade and SteffenThomas and others, 2003; Reference KrabillKrabill and others, 2004) due to intense submarine melting of a >10 km long floating tongue (Reference Holland, Thomas, de Young, Ribergaard and LyberthHolland and others, 2008; Reference Motyka, Truffer, Fahnestock, Mortensen, Rysgaard and HowatMotyka and others, 2011). The resultant loss of buttressing forces caused the glacier to accelerate and stretch (Reference Joughin, Abdalati and FahnestockJoughin and others, 2004; Reference Luckman and MurrayLuckman and Murray, 2005), causing the floating tongue to disintegrate (Reference Podlech and WeidickPodlech and Weidick, 2004), and initiating a sustained retreat (Reference Moon and JoughinMoon and Joughin, 2008). This pattern of retreat is consistent with studies of sediment cores from nearby Disko Bay, which show coincident variability between ocean conditions and the location of the glacier terminus throughout the 20th century (Reference LloydLloyd and others, 2011).
There is a pattern of seasonal variation in terminus position superimposed on the long-term retreat. Previous studies suggested that these modulations can be attributed to variations in the strength of the proglacial ice melange, a dense pack of icebergs that persists year-round, extends >15 km down-fjord of the calving front, contains distinct shear bands and is densest near the terminus. Thus the ice melange may act like a weak, granular ice shelf that inhibits calving by transmitting stresses from the fjord walls to the glacier terminus (Reference JoughinJoughin and others, 2008, Reference Joughin2012; Reference Amundson and TrufferAmundson and Truffer, 2010). Ice melange variability, which is affected by the growth and decay of sea ice, is a leading hypothesis (Reference StraneoStraneo and others, 2014) for the observed seasonal variations in iceberg calving observed here and at other tidewater glaciers with less persistent and less extensive ice melange (Reference Howat, Box, Ahn, Herrington and McFaddenHowat and others, 2010; Reference WalterWalter and others, 2012). Seasonal variations in calving are important because they influence a glacier’s long-term rate of retreat through nonlinear processes (Reference Amundson and TrufferAmundson and Truffer, 2010; Reference JoughinJoughin and others, 2012), and longer warm periods that extend the calving season could lead to greater rates of retreat.
Previous attempts to investigate ice melange behavior have typically suffered from poor temporal and/or spatial resolution, particularly during winter months when visible satellite imagery is unavailable, and when ice melange is expected to have its largest impact on glacier dynamics. To overcome these issues we utilize MODIS-derived (Moderate Resolution Imaging Spectroradiometer) sea surface temperatures (Fig. 1), based on thermal infrared emission, to generate a 12 year proxy record of daily fjord ice conditions in Ilulissat Icefjord. We validate our approach using time-lapse photographs of the proglacial fjord, and then use our record to compare daily-to-seasonal variations in sea ice and ice melange conditions to glacier dynamics.

Fig. 1. (a) Thermal infrared derived surface temperature (ST) data product map of Ilulissat Icefjord and Disko Bay from a MODIS granule acquired on 24 December 2009 at 14:50 UTC. The data have been reprojected and filtered to reduce cloud contamination. Disko Bay was largely ice-free on that day (ST ∼0°C; yellow) with patchy areas of sea ice (ST∼–5°C; green). Ilulissat Icefjord (black rectangle) is mostly frozen over (ST<–15°C; blue) except for an area of open water near our time-lapse camera (black triangle). (b) Photograph recorded 39 min after the MODIS image shows the open water within the melange. Photographs from this and other cameras were used to track mobility of the ice cover.
2. Methods
We evaluated near-daily observations of winter fjord ice and glacier conditions at Jakobshavn Isbræ between July 2000 and June 2012. We used satellite imagery, time-lapse photography, local and regional seismic data (to identify calving events), and meteorological data from weather stations operated and maintained by the Danish Meteorological Institute (DMI).
2.1. Sea-ice and ice melange conditions
Quantifying daily-to-seasonal variations in sea-ice and ice melange conditions in a narrow fjord is difficult due to cloud cover and the abbreviated daylight of Arctic winter. Therefore, we chose to generate a proxy of sea-ice and ice melange conditions using Moderate Resolution Imaging Spectroradiometer (MODIS)-derived surface temperatures. In addition to reflected light, the MODIS instrument measures energy emitted from the Earth’s surface in the thermal infrared bands. Several MODIS products are available, but we chose a sea surface temperature dataset processed by NASA’s Ocean Data Processing System (Reference Feldman and McClainFeldman and McClain, 2012) for our analysis because this data product (1) preserves the instrument’s original pixel resolution (1 km), and (2) provides daily observations of the proglacial fjord. Daily, 11 μm, level-2, Terra granules imaged over Jakobshavn Isbræ and the Disko Bay region (Fig. 1) were acquired and reprojected to 1 km Cartesian space. The level-2 data product applies atmospheric corrections and an emission model to produce sea surface temperatures in units of °C. Our analysis uses the relative contrasts in pixel values, rather than absolute temperatures, to track phenomenological changes in fjord ice surface conditions. Herein we refer to the data product values as surface temperatures (ST) to reflect variations in sea ice, icebergs and open water observed in the record.
There are two caveats in using this data product for this application: (1) the use of a land mask in production that pre-dates the recent retreat of the glacier front, and (2) cloud contamination. Although the level-2 product masks the innermost fjord, including the melange immediately adjacent to the glacier terminus, the melange extended well beyond the masked area for much of the study period, and thus provided adequate observations. MODIS thermal bands are sensitive to water vapor in clouds, therefore measurements include cloud top temperatures. It is difficult to completely remove temperatures related to clouds and maintain a high resolution of melange variability. To reduce cloud contamination, we used the ephemeral nature and extremely low temperatures of clouds (e.g. ST ≪ −40°C) to filter the data and minimize apparent multi-day cooling trends due to clouds. Statistics were generated over a 7 day moving window and applied to the surface temperature data twice. The first pass screened pixels for temperatures more than half a standard deviation below the 7 day median, and replaced those values with the median. Statistics were generated a second time, and surface temperatures below the 7 day mean were replaced with the mean. The purpose of the smoothing scheme was to reduce the very cold and transient temperature variations related to clouds while preserving the geophysical signal of the fjord surface; the data were not filtered spatially.
After filtering, a profile from near the glacier terminus to Disko Bay was sampled and stacked to create a time series of daily melange conditions. Temperatures along the width of the fjord (1–8 pixels in the data product) were investigated for cross-fjord variations in surface temperatures, and compared with a center-line transect. Center-line temperatures were determined to be well within the standard error (SE) of temperatures across the fjord surface along the inner (mean SE through time = 0.45°C), central (0.47°C) and outer fjord (0.54°C). Therefore, we used temperatures along the center-line profile in our analyses to reduce the potential for biasing from lateral shear margins and landfast ice. The resultant profiles (e.g. Figs 2 and 3) are centered on winters to highlight seasonal variations in ice melange conditions. (We refer to winters by the year in which the winter ended. For example, winter 2010 refers to the winter that began in 2009 and ended in 2010.) Finally, the boundary between the consolidated melange in the inner fjord and the unconsolidated melange in the outer fjord was determined using the minimum gradient in temperature (typically a high negative value) calculated along the profile for each winter day. For boundary identification, points >1 standard deviation from the mean winter values were considered outliers and removed. The data were then filtered using a 6 day median, and the gradients between the remaining points were used to delineate the melange boundary (e.g. Fig. 3).
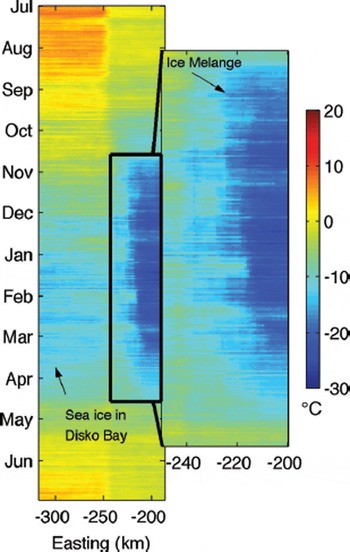
Fig. 2. The 12 year mean of surface temperatures along transect shown in Figure 1. The ice melange in the proglacial fjord (east of –250 km) appears much colder than the sea ice in Disko Bay.
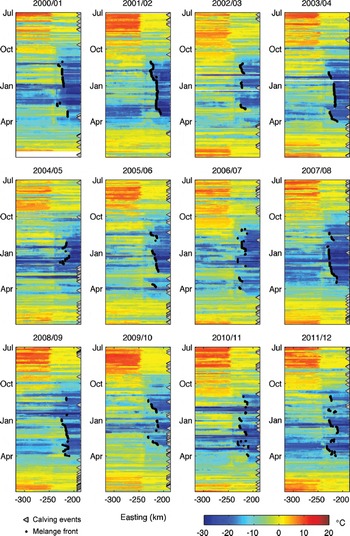
Fig. 3. Time series of surface temperature profiles of Ilulissat Icefjord and Disko Bay along transect shown in Figure 1. Transects are centered on the winter months to observe the seasonal variability of the ice melange. Gray triangles along right margins indicate the timing of calving events; calving record from January to June 2012 is missing. The gradient in surface temperature in the fjord (black dots) delineates the ice melange boundary.
To compare the seasonal changes in terminus front positions with fjord ice conditions across multiple years, a degree-day type of calculation was performed on the surface temperatures. We use the term degree-day in a manner that is starkly different than the traditional use in climatological estimates, though the variables are conceptually similar. Herein, the ‘cumulative degree-day’ (CDD; Eqn (1)) is defined as the sum of the differences between the temperature in each pixel and the minimum temperature recorded in the fjord (STmin = –41°C), multiplied by the width of each pixel (W pixel = 1 km), summed over the central fjord (between –198 and –218 km east) and over each winter (1 October to 31 March), and then divided by the surface area of the fjord sampled (20 km2); units are in °C d. A high number of CDDs indicates winters with sustained warm surface conditions and unconsolidated fjord ice, and thus represents winters with a weaker, more mobile melange. The purpose of the CDD is to highlight annual variations in sustained occurrence of warm winter conditions.
2.2. Terminus position
A history of terminus positions was generated using satellite imagery. Landsat 7 panchromatic (band 8) scenes comprise the bulk of the record; TerraSAR-X (TSX) and MODIS 250m data (NASA/Goddard Space Flight Center (GSFC), Rapid Response) supplement the record during the winters of 2008–09 and 2010–12, respectively, to delineate the melange–glacier boundary and provide context for our analysis in the glacier velocity record. Cloud-free images were downloaded, the termini were digitized and points within ±1.5 km of an interpreted center flowline of the glacier’s southern branch were calculated; the mean front position was determined as the mean of these locations (Fig. 4). Data points along the lateral fringes of the glacier were excluded to avoid skewing of the data due to slow or stagnated ice decoupled from the rapid changes (e.g. the convex neck of ice between the north and south branches, and the embayment area along the southern wall). The mean position was then plotted over time to document 12 years of terminus variability.
Fig. 4. Jakobshavn Isbræ’s terminus, 2000–12. (a) Landsat-derived front positions superimposed on a 19 June 2012 image. Red points are the digitized front positions, blue line depicts an along-flow direction of the glacier’s main channel, and yellow indicates points used to determine the mean position. (b) Time series of the mean front position; each point represents the mean front position from a single image. The y-axis is the mean front position relative to the along-flow line. Positive (negative) trending values indicate seasonal advance (retreat).
The mean rate of change in winter terminus position was evaluated to compare the annual changes in melange and terminus behavior each winter. The rate was calculated as the difference between the minimum fall (July to December) and the maximum spring (January to June) position divided by the time interval between these values. These intervals were chosen to accommodate the relatively sparse availability of images (due to clouds, seasonal solar illumination, orbital parameters) and seasonal variation in advance/retreat modes.
2.3. Velocity changes
Glacier velocities, and ice melange velocities when possible, were derived from TerraSAR-X (Reference JoughinJoughin and others, 2012) using speckle tracking (Reference JoughinJoughin, 2002) to measure displacements over each 11 day orbital cycle. Melange velocities are obtained during periods with relatively limited motion of the ice melange between satellite passes, typically during the winter months. During periods of high mobility (e.g. episodes of rapid ice melange turnover), the relative pixel motions are too large to estimate velocity due to speckle decorrelation or motion well outside the tracking window. We sampled velocities along a near-center flowline of Jakobshavn Isbræ’s southern branch and onto the melange in the proglacial fjord. Each velocity transect was then differenced from the minimum velocity profile in the record (3–13 March 2009) to remove background velocity patterns and highlight changes. A time series of velocity anomalies was created to show changes in speed between 2008 and 2011.
2.4. Ice flux
Significant change in speed and thickness of a calving tidewater glacier can profoundly affect the total ice flux of the system. An ice-flux calculation was performed between 2008 and 2011 to assess the effect of increased winter glacier velocities on the flux of ice delivered to the glacier terminus. We calculated the flux using velocity and ice thickness measurements at a fixed gate 6 km behind the 2010 terminus position. We assume that basal sliding dominates the flow regime along Jakobshavn, so surface speeds are representative of depth-averaged speeds. A cubic interpolation was used to resample the velocity data to daily values to account for speed between satellite passes and account for missing acquisitions. Reference Morlighem, Rignot, Mouginot, Seroussi and LarourMorlighem and others’ (2014) bed model was used for initial estimates of ice thickness. The data were smoothed along the flux gate using a 2 km median filter, and then adjusted by –1.5%a–1 over the duration of the velocity record to match the recent observed trend in thinning of ∼15 m a–1 (Reference JoughinJoughin and others, 2012). Glacier speed and ice thickness were sampled, multiplied by the width of each pixel (∼118 m) and then integrated along the ∼6 km long flux gate. Finally, the daily measurements were summed between February and May of each year, and normalized to 2009 to compare the late-winter variations in ice flux.
2.5. Photogrammetry, seismic and meteorological data
Beginning in 2007, digital cameras were deployed to monitor changes along the glacier terminus and proglacial fjord. Four cameras were located along the southern fjord and were positioned to monitor the present retreat and melange mobility. A fifth, west-facing (down-fjord) camera was located along the north wall at the former (1940s–90s) terminus position, and monitored ice melange conditions at 3 hour intervals. This camera was used primarily for validation of the MODIS surface temperature data product as a proxy for ice melange conditions (see below); it operated continuously from August 2009 to June 2013, except between 6 February and 17 April 2010 due to a power failure.
A feature-tracking algorithm based on a normalized cross-correlation was applied to photographs recorded by cameras along the southern wall. Images taken closest to local noon comprise the majority of the record; however, additional images supplement the data during periods of rapid melange turnover due to calving, or poor lighting conditions due to clouds. We calculated the pixel displacement between photographs and produced a record of melange motion in units of pixels per day. A profile of melange motion was sampled and then normalized by dividing by the mean winter 2009 value; the purpose of normalization was to remove artifacts in the displacement field related to oblique image geometry while emphasizing variations in melange mobility (Fig. 5). The resultant speeds are shown as a percent difference relative to the mean 2009 winter values. Melange motion 20 days before and after calving events was analyzed to determine if melange mobility increased prior to calving events or, conversely, if calving processes led to the disruption and sudden increase in melange motion.
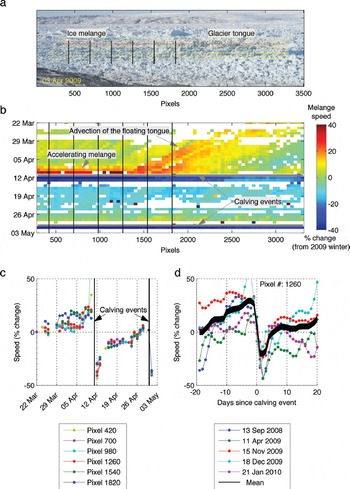
Fig. 5. Melange mobility prior to calving. (a) Sample of feature-tracked results from time-lapse photography; black lines identify pixel locations in (b) and (c). (b) A time series of melange motion along the red line in (a) leading up to the 11 April 2009 calving event. (c) Time series of speed at discrete pixels leading up to calving events on 11 April and again on 30 April; legend identifies pixels as melange or glacier. (d) Similar analysis, for four additional calving events spanning several years. All speeds are shown as the percent difference from the 2009 winter mean.
The calving catalog of Reference Amundson, Clinton, Fahnestock, Truffer, Lüthi and MotykaAmundson and others (2012) was used for the timing of calving events in the fjord. Those authors used seismic data recorded at Kangerlussuaq (∼250 km away; Global Seismographic Network station SFJ/SFJD) to identify clusters of low-frequency (2–5 Hz), long-duration (20–120 min) seismic events associated with the calving and capsizing of icebergs near glacier termini, and then verified events using MODIS imagery and time-lapse photographs. The timing of calving events appears as gray triangles along the right margin of ST transects, allowing one to compare ice melange conditions with the seasonal onset of spring calving events. Data gaps and periods of high noise exist in the record, especially prior to 2005. Therefore, some seasonality may be unaccounted for during the early part of the calving catalog and during the 2012 winter.
Regional temperature and wind data were obtained from the DMI weather station located at Ilulissat Airport, ∼60 km west of the present terminus, to aid with interpretation of ice melange conditions.
3. Results
3.1. Seasonal melange variability
The down-fjord boundary of the ‘cold’, consolidated winter sea ice and ice melange is apparent in the surface temperature transects. Conditions vary spatially and temporally, but can be generalized using the 12 year mean (Fig. 2). Summer ST values in Disko Bay (west of –250 km) typically approach +8°C, indicating that the bay is largely ice-free. The fjord surface is cooler than Disko Bay due to the presence of icebergs and a cold fresh surface layer. Surface temperature values drop in autumn, and by winter sea ice typically appears in Disko Bay (ST product values between –10°C and –15°C). Concurrent with these seasonal changes in the bay is a much colder signal (≤–20°C) in the fjord as the mix of icebergs, brash ice and surface water in the fjord freezes. The cold melange persists through the winter until late March or early April, when ST product values increase and approach 0°C.
The full record of ST product values (Fig. 3) shows annual variability in ice melange conditions and calving events. The delineation between the cold ice melange in the fjord (east of –250 km) and the higher surface temperatures of the outer fjord and Disko Bay is evident in most years. In particular, the winters of 2001, 2002, 2004, 2008 and 2009 all have a cold and clearly defined melange boundary (black dots) that persists for several months; few, if any, midwinter calving events occurred during those winters. The 2006 winter melange maintained a delineated boundary, but it was short in duration and showed warming earlier in the spring. The melange lacks an enduring front for the remaining winters, and instead shows intervals of midwinter warming coincident with an early onset of calving.
3.2. Terminus changes
The terminus position of Jakobshavn Isbræ varied seasonally while it retreated >16 km over the last 12 years (Fig. 4). The glacier retreated during summer months and advanced during winter months, with winter readvances showing a roughly bimodal response. It advanced ≥4 km (mean ∼5 km) for half of the winters in the record, which is consistent with previous observations of a seasonally advected floating tongue (Reference Amundson, Truffer, Lüthi, Fahnestock, West and MotykaAmundson and others, 2008; Reference JoughinJoughin and others, 2008; Reference Amundson and TrufferAmundson and Truffer, 2010). Contrasting with these large seasonal variations are winters (2003, 2005, 2006, 2010, 2011, 2012) with substantially smaller readvances, with the mean readvance for these years (excluding 2003) being just 1.3 km. Most significant was the nearly 200 m retreat of the terminus during winter 2003, which coincided with final break-up of the longstanding floating tongue.
4. Discussion
Our results show that the temperature and spatial extent of the melange, the frequency of calving, and the seasonal readvance of the terminus all co-vary in time. This is consistent with Reference Amundson and TrufferAmundson and Truffer (2010) who show temporal variations in ice melange strength can influence terminus geometry. Those authors used a force-balance analysis to demonstrate that the ice melange can influence the timing and style of calving at Jakobshavn Isbræ. Our observations support those conclusions and further suggest that a cold, dense, winter ice melange inhibited calving at Jakobshavn Isbræ during multiple winters over our study period. In addition, abrupt warming and increased mobility in the winter melange led to calving. Our findings indicate a melange influence on calving, which has implications for the seasonal readvance of the glacier terminus. There remains the possibility that these observations are purely coincidental; the persistence of a cold and immobile melange might also be explained from a lack of disruption by winter calving. To investigate this further, we examined time-lapse photographs and looked for evidence of melange mobility preceding calving.
4.1. Ice melange influence on calving
In an effort to better understand the relationship between the ice melange and calving, and to constrain the timing of events, we feature tracked time-lapse photographs taken around calving events. Feature-tracked images from the 11 April 2009 calving event, the first event of that year and the onset of the break-up of the seasonal floating tongue show an increase in melange mobility in the days leading up to calving (Fig. 5b). A profile of speed shows the floating tongue advected into the field of view near pixel 2500 on 22 March. The tongue progressed steadily down-fjord over the next 20 days. By 8 April, the melange in front of the tongue (pixel numbers <1200) started to speed up, and on 11 April a large calving event caused the floating tongue to disintegrate and disappear from the profile. The speed of the melange increased >40% over mean winter values in the days leading up to calving. Following the event, speeds were much slower as the advancing glacier terminus pushed the post-calving melange down-fjord and compacted it. Time series of speed at discrete pixels (Fig. 5c) show that between calving events the melange (beige, magenta, cyan) moved slower than the ice tongue (blue, then green and then red), but prior to the next calving event the melange rapidly increased in speed, while the glacier did not. Following the calving event on 11 April, speeds decreased to 40% below mean winter values, and then began to increase again leading up to the 30 April calving event.
A similar analysis was completed on four additional calving events that were isolated in time (Fig. 5d), i.e. calving events that occurred within 20 days of a previous event were excluded to prevent influence from an already weakened ice melange. A stack of these events shows that, on average, melange speed increased by ∼20% in the days leading up to calving, suddenly decreased to values 27% below the median after calving and then gradually returned to background values over several days. The multiple observations of enhanced melange motion preceding calving events, taken in different seasons of the year, bolster support for a melange influence on calving. The ability of the melange to prevent ice at the terminus from overturning decreases as the mobility of the melange increases, leading to more frequent calving during periods of enhanced mobility. We now build upon this evidence to compare melange variability with the seasonal location of the calving front, the seasonal variation in glacier speed, and the resultant effect on ice flux to evaluate melange control on terminus dynamics. Lastly, we compare melange conditions with local weather observations to probe for an atmospheric influence on melange variability.
4.2. Ice melange influence on seasonal terminus position
Changes in fjord ice conditions correlate with timing and variability in the number of winter calving events and the seasonal readvance of the glacier terminus (Table 1; Fig. 6a). Furthermore, a trend of enhanced warming (melange weakening or increased mobility), a high number of winter calving events, and small seasonal readvances occur late in the record. The winters of 2010, 2011 and 2012 are the warmest in the record, with CDD totaling 4.92, 4.71 and 4.66 × 10³°C d, respectively. Seasonal readvances were 4.6, 6.8 and 1.7 m d–1, while winter calving events totaled 20, 11 and 6, respectively; a gap in the calving record precludes observations between January and June 2012, so calving was likely higher during the 2012 winter, but is not accounted for here (see Section 2.5). The winters of 2005 and 2006 exhibited a high number of CDD (4.35 and 4.59 × 10³°Cd) and calving events (10 and 7), and the glacier advanced the next smallest rates at 10.7 and 11 m d–1, respectively. This covariation supports the idea that mobile ice in the fjord, as shown by higher surface temperature values and lack of well-defined fronts in the melange, is related to active winter calving and minimal readvance of the glacier terminus.

Fig. 6. (a) The cumulative degree-days (CDD, red), with the number of winter calving events in parentheses, and the mean rate of change in winter terminus position (blue). (b) Linear regression between CDD and the mean rate-of-change winter position of the glacier front.
Table 1. Summary of results. Boldface highlights winters in which CDD, the number of winter calving events and the change in front position exceed the 12 year mean
Winter 2003 was notably different than the rest of the record. The CDD totaled 4.61 × 10³°C d, the glacier retreated an average of 0.9 m d–1, yet the seismic data suggest a single calving event occurred. The lack of seismicity can be attributed to a difference in calving styles. The final disintegration of the floating tongue occurred in March 2003 (Reference Joughin, Abdalati and FahnestockJoughin and others, 2004). Tabular icebergs that calve from a floating tongue are much larger than icebergs from a grounded terminus (Reference Amundson, Truffer, Lüthi, Fahnestock, West and MotykaAmundson and others, 2008; Reference JoughinJoughin and others, 2008), drift away from the terminus largely intact and do not immediately roll as unbalanced icebergs do from a grounded front (Reference Amundson and TrufferAmundson and Truffer, 2010). Thus more ice could be calved from the tongue but with minimal iceberg capsize and associated seismicity (Reference Amundson, Truffer, Lüthi, Fahnestock, West and MotykaAmundson and others, 2008).
The winters of 2001, 2002, 2004, 2007, 2008 and 2009 had fewer calving events (negative anomalies: measured– mean) and larger seasonal readvances (positive anomalies) than their respective 12 year means. All but 2007 had CDD lower than the 12 year mean (negative anomalies). Overall, our data suggest that winter sea-ice and ice melange conditions modulate the seasonal advance of Jakobshavn Isbræ’s calving front. The strong negative correlation (r = –0.80) between CDDs and the mean rate of change of the winter terminus supports this assertion (Fig. 6b); winters that are ‘warm’ and have an unconsolidated ice pack in the fjord coincide with years of minimal terminus advance. Conversely, winters that are ‘cold’ and have a consolidated melange in the proglacial fjord lead to a significant advance of the calving front. Several factors account for the lack of an even higher correlation: (1) Our data provide only a proxy for a distinction between an immobile, consolidated melange and a faster-moving, unconsolidated melange, based on observations in time-lapse imagery that the melange behaves as a more rigid ice pack when its surface shows lower temperatures; (2) conditions of subsurface waters likely affect melange conditions, but are not evaluated here and may not be reflected in the melange condition proxy we developed; (3) the composition of the melange (i.e. size, location and orientation of iceberg clasts within the matrix), which affects its structural rigidity, is dynamic, but is not accounted for in our approach; (4) the geometry of the glacier is evolving and the continued retreat has forced the terminus into deeper water (Reference Joughin, Smith, Shean and FloricioiuJoughin and others, 2014; see Section 4.3), which has created greater instability along the terminus and reduced the ability of the glacier to readvance (Reference Meier and PostMeier and Post, 1987; Reference PfefferPfeffer, 2007).
4.3. Impact of ice melange on glacier velocities
Variability in winter ice melange conditions has a direct effect on melange velocities near the glacier, and possibly on the velocity of the glacier (Fig. 7), though the latter may be through the indirect effect of seasonal readvance of the terminus, as this requires thickening of the grounded ice. In March 2009, sea ice filled Disko Bay, the entire fjord was frozen, and surface temperatures show cold, consolidated ice over much of the fjord. Velocities of the glacier terminus and the ice melange were tightly coupled as the glacier pushed the rigid ice melange down-fjord. In contrast, observations from April 2010 show a warm (i.e. less rigid) ice melange that was at least partially decoupled from the glacier terminus; the melange moved slower than the glacier over an 11 day velocity measurement period, and the glacier terminus was moving faster than in the previous winter.

Fig. 7. Varying winter conditions near Jakobshavn Isbræ. (a) 7 March 2009 ST profile (colors west of –200 km) superimposed on a Landsat image shows a frozen and rigid ice melange in the fjord and sea ice in Disko Bay; TerraSAR-X derived velocities (colors east of –195 km) show uniform flow along the glacier terminus and ice melange at that time. Asterisks show camera locations in the fjord; long black trace indicates the location of the velocity profile sampled in Figure 8. (b)11 April 2010 ST profile on a Landsat image shows a less dense melange with open water in the fjord and in Disko Bay; TSX velocities show that while melange at the terminus is well coupled to glacier flow, lower velocities down-fjord indicate partial decoupling of the melange from the terminus. Magenta line shows the location of flux gate for Figure 9; black U-shaped traces perpendicular to flow delineate the calving fronts in the Landsat images.
A transect of velocity anomalies (V Measured − V Mean) was sampled between 2008 and 2011 to assess ice melange influence on glacier speed (Fig. 8b). There was little observed difference in surface velocity between the ice melange and the glacier throughout the 2009 winter, the melange remained rigid and consolidated, and the glacier and melange flowed uniformly down-fjord all winter. By early April, fjord surface temperatures started to increase, calving initiated, the terminus retreated and velocity anomalies show an increase in glacier flow at the calving front (symbols in Fig. 8b). The melange (region to the left of the symbols) was too mobile to be tracked by interferometric synthetic aperture radar (InSAR) at that time; it remained mobile throughout the spring and summer, and the increase in speed along the terminus, initiated when the melange warmed and calving resumed, propagated upstream.

Fig. 8. (a) Time series of ST values and calving events; (b) velocity anomalies and mean terminus positions from TSX; and (c) a cross section of the glacier based on surface and bed elevations useful for the interpretation of the terminus in (b). The ice melange was cold and less mobile during the 2009 winter, calving was inhibited, the terminus advanced and velocities remained low. Calving initiated when the melange surface warmed and became mobile; the glacier retreated into deeper water, destabilized and velocities along the terminus increased. The grounding zone (GZ) represents the variation in grounding line during the observation period and is based on the location of the terminus positions in (b).
As winter 2010 approached, the melange surface cooled (Fig. 8a) and began to consolidate (Fig. 8b; velocities slowed and are again measurable), the glacier slowed and the terminus started to readvance; however, the retreat of the melange front and subsequent calving in late December 2009 led to a ∼3 m d–1 increase in velocities at the glacier terminus. The melange reconsolidated briefly in early January, calving ceased and velocities began to slow, but by late January the region destabilized a second time. The melange surface warmed and became mobile, calving reinitiated and the terminus was moving ∼4 m d–1 faster than during the previous winter, again with melange velocities exceeding satellite measurement capability. Despite an abundance of ice in the fjord late in winter, February melange temperatures were high. The melange was mobile and did not provide enough stress to keep the fragmented terminus from calving or allow a seasonal tongue to develop. The winter calving forced the terminus to a retreated position (Fig. 8b). The calving front flowed as much as 7 m d–1 faster than in the previous winter, and the increase in velocities propagated up-glacier soon after. The seasonal speed-up typical of summer months at Jakobshavn initiated much earlier (February) in 2010 and continued throughout the summer. The extended period of rapid flow at the terminus increased dynamic thinning, feeding back on enhanced flow (Reference PfefferPfeffer, 2007).
The 2011 and 2012 winters also show strong departures from the seasonal behavior of the previous decade, with a late onset of rigid melange conditions, an increase in winter calving, and large changes in seasonal pattern of acceleration along the glacier. Winter 2011 melange temperatures were progressively lower from December through March, and the glacier advanced ∼2.0 km over this period; velocities remained low despite a melange that was more mobile than in 2009. The seasonal acceleration of the glacier did not start until the middle of the 2011 summer, coincident with a retreat of the terminus to a new minimum position. The velocity peaked in late fall, and ice flow was still fast early in the 2012 winter. These observations indicate that the location of the terminus along the bed slope influences glacier velocities, which is consistent with previous studies (Reference Howat, Joughin, Tulaczyk and GogineniHowat and others, 2005; Reference Amundson, Truffer, Lüthi, Fahnestock, West and MotykaAmundson and others, 2008; Reference NettlesNettles and others, 2008; Reference JoughinJoughin and others, 2012, Reference Joughin, Smith, Shean and Floricioiu2014; Reference Podrasky, Truffer, Lüthi and FahnestockPodrasky and others, 2014). Our observations further suggest that the ice melange indirectly influenced glacier speed by controlling the location of the terminus in the fjord as proposed by Reference JoughinJoughin and others (2008). This is important because the glacier flows through a deep trough whose depths are not well known. If, in the glacier’s current state, it is retreating down a bedrock slope into deep water (Reference JoughinJoughin and others, 2012) and thus becoming increasingly unstable (Reference Meier and PostMeier and Post, 1987), the ability of the melange to inhibit calving may be reduced (Reference Amundson, Fahnestock, Truffer, Brown, Lüthi and MotykaAmundson and others, 2010). Jakobshavn Isbræ calves full-glacier-thickness ice (Reference Amundson, Fahnestock, Truffer, Brown, Lüthi and MotykaAmundson and others, 2010) and so the thickness, or vertical dimension of unrotated icebergs, will increase as the glacier retreats into deeper water. Energy released by a capsizing iceberg is proportional to the cube of the thickness (Reference MacAyeal, Abbot and SergienkoMacAyeal and others, 2011; Reference BurtonBurton and others, 2012), so for an iceberg of the same along-flow dimension, more stiffness is required for the melange to inhibit calving, which is unlikely under current conditions. This may translate to a reduced melange influence and a greater dependence on other variables, such as depth of the glacier bed.
The depth of Jakobshavn Isbræ’s bed has limited measurements; interpretations (Fig. 8c) are based on Reference Morlighem, Rignot, Mouginot, Seroussi and LarourMorlighem and others’ (2014) bed model which incorporates them. CReSIS (Center for Remote Sensing of Ice Sheets, University of Kansas) values (Reference GogineniGogineni, 2012) are used for elevations down-fjord of the glacier terminus not included in Reference Morlighem, Rignot, Mouginot, Seroussi and LarourMorlighem and others (2014). Depth to the bed is not as clear below the grounding zone where the glacier is close to flotation and may be floating for the early part of the radar record. (Note the term grounding zone used here to capture the variation in grounding line over several years is different than Antarctic grounding zones, which are defined by observed variability over ocean tidal cycles.) Combining the bathymetry of the fjord with observations discussed above, we infer that a cold, rigid, winter ice melange (e.g. 2009) inhibited calving; this allowed the terminus to advance and ice at the grounding line to thicken and led to a more stable geometry, which consequently reduced velocities on seasonal timescales. In winters with weaker melange (e.g. 2010), calving was not inhibited and the glacier failed to advance; the terminus remained in deeper water, which kept winter speeds high. The terminus did advance to a more stable location along the bed slope during the 2011 winter and remained there, which kept velocities low. Intense calving later that summer forced the terminus back into a deeper location along the bed slope, and velocities increased to the highest levels in the satellite record (Reference Joughin, Smith, Shean and FloricioiuJoughin and others, 2014).
Our observations suggest that the ice melange indirectly influenced the seasonal speed-up of the glacier for multiple years following the final disintegration of the floating tongue by seasonally modulating calving, thus exerting control over the location of the terminus in the fjord. The continued retreat has moved the terminus into deeper water over the past few years, which, coupled with warmer winter conditions, has effectively reduced the ability of melange to inhibit calving. This departure may represent a new regime for Jakobshavn Isbræ.
4.4. Melange influence on ice flux
Ice melange control of calving, and indirectly glacier velocities, has implications for the volume of ice delivered to the ocean seasonally, and changing seasonal patterns can thus affect the ice sheet’s annual mass loss. Seasonally, the changes in ice velocity in the terminal reach have driven variations in ice flux of ∼30% (Fig. 9), with the higher flux occurring during the summer months (Reference Howat, Ahn, Joughin, Van den Broeke, Lenaerts and SmithHowat and others, 2011). The increase in melange mobility in the middle of the 2010 winter, and the subsequent retreat of the terminus and increase in glacier speed, led to higher values of ice flux at the terminus that winter. Integrated between February and May, the period of enhanced speed in 2010, ice flux was 9% higher than during the same period a year earlier. Extrapolating this example to a future scenario where the glacier continues to retreat into deeper water and the ability of the melange to control the terminus location diminishes, seasonal variations in velocity will likely decrease, but the total ice flux would increase. The glacier would effectively deliver more ice to the ocean for a longer part of the balance year.

Fig. 9. Ice flux over time. Yellow regions indicate the time period (February–May) used in the late-winter ice flux integration; percent change in flux relative to 2009 values is shown in parentheses.
4.5. Melange variability and atmospheric conditions
Comparing surface temperature observations with DMI climate data (Fig. 10) suggests local atmospheric conditions may have influenced melange behavior, which consequently affected the stability of the glacier terminus. The stable front of the consolidated winter melange retreated in late December 2009 and again in late January 2010 (Fig. 10a and b), coincident with unseasonally high air temperatures (Fig. 10c) and persistent down-fjord winds (Fig. 10d). The high air temperatures (+10.9°C and +8.3°C respectively) and high, sustained easterly winds (19.4 and 19.8 m s–1) may have disrupted the sea ice in the outer fjord, including the sea ice that binds iceberg clasts together within the ice melange fabric. This sequence of events, when sustained for several days, could mobilize the winter ice melange, which could lead to mid-winter calving and changes in ice dynamics at the glacier terminus. While the correlation with down-fjord winds seems to indicate an atmospheric driver, it is difficult to attribute cause because open water in the fjord would also favor higher air temperatures, so it is not clear if high air temperatures are a cause or an effect. Furthermore, subsurface water conditions, such as warm ocean inflow in winter (Reference Holland, Thomas, de Young, Ribergaard and LyberthHolland and others, 2008; Reference StraneoStraneo and others, 2012), are not accounted for in our data and could also affect melange stability. Therefore, the extent to which atmospheric conditions and ocean forcing each play a role in melange stability remains an open question.

Fig. 10. Surface conditions between November 2009 and March 2010. (a) Melange surface temperatures; (b) melange speed from feature-tracked time lapse; (c) air temperatures; and (d) wind velocities at Ilulissat Airport.
5. Conclusions
We used MODIS surface temperature data and photographic time series to infer daily ice melange conditions at Jakobshavn Isbræ from 2000 to 2012. We show that an increase in melange mobility preceded calving on multiple occasions. Our record of melange conditions demonstrates that winters with persistently low surface temperatures, taken to indicate rigid and immobile ice melange, had few calving events, which permitted the glacier terminus to advance several kilometers and form a floating tongue. Though an ice melange may not have sufficient strength to directly impact the glacier force balance, it can impact glacier velocities indirectly by regulating calving. Recent winter warming and weakening of the ice melange, coupled with the retreat of the ice melange front, led to the onset of calving and a series of dynamic changes at the glacier terminus. The ability of the melange to influence calving seems to have diminished in recent years, however, as conditions warmed and the glacier has retreated into deeper water.
Our work implies that a proglacial ice melange, when dense enough, can affect tidewater glacier dynamics by modulating calving. If recent observed winter warming and increased mobility in the winter ice melange continue, and winter calving continues to occur, the glacier terminus will retreat into deeper water more rapidly each summer, and the fraction of the year in which Jakobshavn Isbræ calves and experiences faster flow is likely to increase. The result would be a faster-flowing glacier that delivers more ice to the ocean; this has long-term implications for the dynamics of this tidewater glacier and the mass balance of the Greenland ice sheet.
Acknowledgements
This research was supported by funds from the Gordon and Betty Moore Foundation (GBMF2627), NASA (NNX08AN74G), the US National Science Foundation (ANT0944193 and ANS0909552) and the New Hampshire Space Grant Consortium (NNX10AL97H). We thank CH2M HILL Polar Services and Air Greenland for logistics support, and PASSCAL (Program for the Array Seismic Studies of the Continental Lithosphere) for the use of seismic instrumentation. Ian Joughin derived TerraSAR-X velocities and terminus positions from images provided by the German (DLR) space agency under NASA grant NNX08AL98A. We acknowledge the use of Rapid Response imagery from the Land Atmosphere Near-real time Capability for EOS (LANCE) system operated by the NASA/GSFC/Earth Science Data and Information System (ESDIS) with funding provided by NASA HQ. Glacier surface elevations were provided by CReSIS, and bed elevations by CReSIS and Mathieu Morlighem. The manuscript was significantly improved by comments from Tim Bartholomaus and an anonymous reviewer.


