


1. INTRODUCTION
Glaciers on the Tibetan Plateau (TP) are very important fresh water sources for several large Asian river basins and are sensitive indicators of climate variability (Yao and others, Reference Yao1997; Immerzeel and others, Reference Immerzeel, van Beek and Bierkens2010; Zhang and others, Reference Zhang, Yao, Xie, Kang and Lei2013). Under global warming, Tibetan glaciers have shown widespread and accelerating shrinkage/mass loss across most of High Asia (Bolch and others, Reference Bolch2012; Yao and others, Reference Yao2012; Zhang and others, Reference Zhang, Hirabayashi and Liu2012; Yang and others, Reference Yang, Guo, Yao, Zhu and Wang2016); however, there has been anomalous stability or slight mass gain for some glaciers in the western Kunlun-Pamir-Karakoram region (Kääb and others, Reference Kääb, Berthier, Nuth, Gardelle and Arnaud2012, Reference Kääb, Treichler, Nuth and Berthier2015; Yao and others, Reference Yao2012; Gardelle and others, Reference Gardelle, Berthier, Arnaud and Kääb2013). This contrast in behavior has caused remarkable differences in changes in regional hydrology (Sorg and others, Reference Sorg, Bolch, Stoffel, Solomina and Beniston2012; Zhang and others, Reference Zhang, Hirabayashi and Liu2012) and natural hazards (such as glacial lake outbursts and ice avalanches) in some basins (Wang and others, Reference Wang, Yao, Yang, Joswiak and Zhu2012; Tian and others, Reference Tian2017), which raises concerns regarding glacier mass-balance changes and their relationships with climatic signals on the TP (Immerzeel and others, Reference Immerzeel, van Beek and Bierkens2010; Fujita and Nuimura, Reference Fujita and Nuimura2011; Yao and others, Reference Yao2012), especially for glaciers in the Karakoram-western Kunlun-eastern Pamir region.
Tibetan glacier recession is known to be linked to increasing air temperature (Rupper and Roe, Reference Rupper and Roe2008; Wang and others, Reference Wang, He, Pu, Jiang and Jing2010; Yang and others, Reference Yang, Guo, Yao, Zhu and Wang2016), but the climatic mechanisms controlling anomalous glacier changes in the Karakoram-western Kunlun-eastern Pamir region have been widely debated. Some studies have suggested that the Pamir/Karakoram stability can be attributed to increasing precipitation from strengthened westerlies (Bolch and others, Reference Bolch2012; Yao and others, Reference Yao2012; Gardelle and others, Reference Gardelle, Berthier, Arnaud and Kääb2013). Kapnick and others (Reference Kapnick, Delworth, Ashfaq, Malyshev and Milly2014) found that the nonmonsoonal winter precipitation led to the Karakoram Anomaly. Nevertheless, Zafar and others (Reference Zafar2016) concluded that the region's air temperature and cloudiness are contributing factors to the Karakoram Anomaly. An and others (Reference An2016) suggested that a possible recent warming hiatus on the northwestern TP has contributed to the relatively stable status of glaciers in this region. Wang and others (Reference Wang, Wu, Wu and Chen2015) proposed that the P (precipitation)–E (evaporation) balance in the western Kunlun mountains has shown a slightly positive trend, which leads to a lower regional equilibrium line, despite an increasing trend in the mean annual temperature.
The lack of long-term measurements of glacier mass balance in the Karakoram-western Kunlun-eastern Pamir region impairs the understanding of relationships between climatic signals and glacier variations in these regions. Glaciers with ongoing mass-balance measurements are mostly located in the Tien Shan (e.g. Urumqi Glacier No.1 and Tsentralniy Tuyuksuyskiy glacier) and Qilian mountains (Yao and others, Reference Yao2012; WGMS, 2013); these glaciers are dominated by the westerlies and have all shown significant mass loss under global warming (Yao and others, Reference Yao2012; Farinotti and others, Reference Farinotti2015; Liu and Liu, Reference Liu and Liu2015). This pattern is contrary to the glacier area and mass-balance changes in the Karakoram-western Kunlun-eastern Pamir region during the same period. Therefore, it is necessary to reconstruct the past glacier mass balances in the Karakoram-western Kunlun-eastern Pamir region to assess the impacts of climatic variables on glacier mass balance. Based on an energy-based mass-balance model and corresponding meteorological data, mass balance was well reconstructed for some glaciers on the TP, and the reconstructed glacier mass balance has been used to analyze the relationship between glacier changes and climatic factors (Zhang and others, Reference Zhang, Hirabayashi and Liu2012; Huintjes and others, Reference Huintjes2015; Yang and others, Reference Yang, Guo, Yao, Zhu and Wang2016).
Muztag Ata (38.17°N, 75.06°E) reaches 7546 m a.s.l. and is in the eastern Pamir (Fig. 1). This region is well suited for investigating the anomalous mass-balance changes in the northwestern TP due to the low rate of mass loss indicated by in situ and geodetic measurements (Yao and others, Reference Yao2012; Holzer and others, Reference Holzer2015; Zhang and others, Reference Zhang2016b). In addition, meltwater from these glaciers is important for the water supply in the downstream oases. The Muztag Ata region contains 128 glaciers covering a total area of more than 377 km2 (Holzer and others, Reference Holzer2015; Zhang and others, Reference Zhang2016b). The meltwater from these glaciers forms the headwaters of the Tarim River and contributes to over 60% of the discharge of some rivers (Yang, Reference Yang1991). Moreover, although Shen and others (Reference Shen, Xie, Ding and Liu1997) and Duan and others (Reference Duan, Xu and Wu2015) derived the regional mass balance of the Muztag Ata region for the periods of 1960–1990 and 1958–2002, respectively, there remains a lack of mass-balance data over the last decade, during which the anomalous behavior of glaciers has been noted in the Karakoram mountains, western Kunlun mountains and eastern Pamir.

Fig. 1. Location of Muztag Ata No.15 (MZ15) glacier in the eastern Pamir (red five-pointed star), Chinese meteorological stations (yellow point) and four other glaciers (Tsentralniy Tuyuksuyskiy glacier, Kara-Batkak glacier, Golubin glacier and Abramov glacier) (blue triangle) near MZ15 glacier, as well as the scope and name of some mountain ranges (italics and dashed outline) (a); the site of MZ15 glacier (black outline) and distribution of three AWSs (green squares) in the Muztag Ata region; the blue shading indicates the scope of glacier and light red shading indicates the extent of glacier-free land (b); topographical map showing the distribution of ablation stakes in 2011 on MZ15 glacier (green dots) (c).
In this study, based on in situ glacio-meteorological measurements in the eastern Pamir, a long-term time series (1980–2012) of mean specific annual mass balance of Muztag Ata No. 15 glacier (MZ15) is reconstructed using an energy-based mass-balance model to analyze the annual mass-balance characteristics. Next, the relationships between mass-balance and regional climate variables are discussed to gain insights into the macroscale atmospheric circulations responsible for mass-balance changes in the eastern Pamir and northwest TP. Lastly, the spatial patterns of glacier changes over the past few decades are compared by reviewing recently published data on glacier area and mass balance for the TP. These results will aid in the understanding of the main patterns of glacier mass-balance changes and their relationships with regional climatic factors in the eastern Pamir, which will provide a useful benchmark for managing water resources in the Tarim basin.
2. STUDY REGION AND METHOD
2.1. Research area and data collection
MZ15 glacier (38°14′N, 75°03′E) is located in the eastern Pamir and is affected year-round by the westerlies (Yao and others, Reference Yao2012) (Fig. 1). This glacier is free of debris, has an area of ~0.96 km2 and a length of 1.8 km (Yao and others, Reference Yao2012). The altitudinal range of this glacier is between 5237 and 5935 m. This glacier faces west with a mean equilibrium line altitude of 5640 m a.s.l., and the annual mean mass balance was 0.248 m w.e. during 2005–2010 (Yao and others, Reference Yao2012). The annual mean precipitation is ~75 mm, and the precipitation period is concentrated between April and September according to the data from the Taxkorgen national meteorological station. The meltwater from MZ15 glacier drains into the Kangxiwa River, which is the headwater of the Tarim River.
Three Auto Weather Stations (AWSs) (AWS1, AWS2 and AWS3) were deployed near MZ15 glacier to collect basic meteorological data (Fig. 1). These three AWSs have the same sensors and measure the same meteorological variables. Thus, Table 1 just shows the technical specifications of all sensors in AWS1 and AWS2. Further details of these AWSs can be found in Zhu and others (Reference Zhu, Yao, Yang, Xu and Wang2017a). A 4-year time series of air temperature, relative humidity, incoming shortwave radiation and incoming longwave radiation recorded by AWS2, along with a 4-year precipitation time series recorded by AWS1, are required for this study. To produce a continuous meteorological dataset from 1979 to 2012, data from a new China Meteorological Forcing Dataset (CMFD (He and Yang, Reference He and Yang2011)) and Chinese national meteorological stations (CMS) were compared with the AWS2 measurements. Surface air temperature, wind speed and specific humidity in the CMFD data were generated according to the observations from ground meteorological data in China and were merged with the corresponding Princeton meteorological forcing data (Sheffield and others, Reference Sheffield, Goteti and Wood2006). The precipitation field was derived by merging three precipitation datasets (Huffman and others, Reference Huffman2007; Yatagai and others, Reference Yatagai2009; Chen and others, Reference Chen2011), and the incident shortwave radiation of the CMFD was generated by correcting the Global Energy and Water Cycle Experiment-Surface Radiation Budget (GEWEXSRB) shortwave radiation data, which referenced radiation estimates from Chinese station data using a hybrid radiation model (Yang and others, Reference Yang, Koike and Ye2006). The temporal and spatial resolution of the CMFD data selected herein were 3-hourly and 0.1° × 0.1°, respectively. Empirical relationships between the AWS data and the CMFD data in the corresponding grid/CMS data were then established. S in from CMFD at a 3-hourly resolution was downscaled to a 1-hourly resolution by interpolation. Monthly coefficients for hourly S in, daily mean RH and daily mean WS from CMFD and daily mean T a from CMS were calculated using linear regression analysis. A time series of these meteorological variables during 1980–2010 were reconstructed based on the above referenced monthly coefficients. Daily precipitation from Taxkorgen national meteorological station was corrected via consultation of the practical precipitation occurrence, ratio and seasonal distribution method following Yang and others (Reference Yang2013) and Zhu and others (Reference Zhu2017b). Please see Figure B1 in the Appendix for more information. Figure 2 displays the observed and corrected air temperature, relative humidity, wind speed and incoming shortwave radiation at the AWS2 site, and monthly precipitation at the AWS1 site over the measurement period, as well as their corresponding root mean square errors (RMSE). These data are single-point data and serve as input variables for the energy-based mass-balance model.

Fig. 2. Measured (black) and corrected (blue) air temperature, relative humidity, wind speed and incoming shortwave radiation at the AWS2 site, and monthly precipitation at the AWS1 site over the period of 2009–2012 with their RMSE value. These corrected meteorological variables are single-point data and serve as input variables for the model.
Table 1. Sensor information and technical specifications of AWS2 and AWS1
T a, air temperature (°C); RH, relative humidity (%); WS, wind speed (m s−1); P, precipitation (mm); Press, air pressure (hPa); S in and S out, incoming and outgoing shortwave radiation (W m−2); L in and L out, incoming and outgoing longwave radiation (W m−2).
Stakes deployed on MZ15 glacier have consecutive mass-balance records for the period of 2006–2012, which were obtained following a standard glaciological method (Fig. 1c). Mass balance is usually measured at the end of an ablation season. Due to logistical issues, no fieldwork was carried out in 2009, and the stakes drilled in 2008 were missing when the sites were revisited in September 2010. The number of monitoring stakes over the entire glacier surface was six in 2008 and 11–12 for other years. The ice density was assumed to be 900 kg m−3 when converting ice ablation into water equivalent. The Shuttle Radar Topography Mission (SRTM) with a resolution of 90 m was used to obtain geographical coordinate information, altitude, slope and aspect. Because the glacier-covered area showed almost no changes between the 1970s and 2014 (Holzer and others, Reference Holzer2015; Zhang and others, Reference Zhang2016b), the model only uses the boundary of MZ15 glacier from the Second Glacier Inventory Dataset of China (Version 1.0) (Guo and others, Reference Guo2014). Lastly, monthly geopotential height/wind fields at the 300 hPa level obtained from the National Center for the Environmental Predictions-National Center for Atmospheric Research (NCEP/NCAR) were used to analyze the relationship between glacier mass change and macroscale atmospheric circulations. Some studies have identified a high-level westerly jet with a core at 200–300 hPa as a crucial element connecting mid-latitude and monsoon dynamics (Ding and Wang, Reference Ding and Wang2005; Bothe and others, Reference Bothe, Fraedrich and Zhu2011). Monthly geopotential height/wind fields at the 200–300 hPa level were used to characterize the atmospheric circulation associated with snow accumulation and mass balance for glaciers on the TP (Mölg and others, Reference Mölg, Maussion and Scherer2014; Duan and others, Reference Duan, Xu and Wu2015).
2.2. Glacier mass-balance model
Here, we use the energy-based mass-balance model described in detail in Appendix C. This model has been used by Zhu and others (Reference Zhu2015, Reference Zhu2017b) and Yang and others (Reference Yang, Guo, Yao, Zhu and Wang2016). The primary components of the model are briefly reviewed as follows.
 $$M = \int {\left( {\displaystyle{{Q_{\rm M}} \over {L_{\rm m}}} + \displaystyle{{H_{{\rm lat}}} \over {L_{\rm v}}} + C_{{\rm en}} {\rm +} P_{{\rm snow}}} \right)} {\rm d}t.$$
The point mass balance (M) is composed of melting (Q M/L m), sublimation/evaporation (H lat/L v), refreezing (C en), and solid precipitation (P snow). L m is the latent heat of ice melt and L v is the latent heat of evaporation/sublimation. Melt energy (Q M) is calculated using the surface energy balance equation:
 $$Q_{\rm M} = S_{{\rm in}} ({\rm 1} - \alpha ) + L_{{\rm in}} + L_{{\rm out}} + H_{{\rm sen}} + H_{{\rm lat}} + QG,$$
where S in is the incoming shortwave radiation, which consists of the direct solar radiation and diffuse solar radiation. In addition, S in is calculated using the method suggested by Brock and Arnold (Reference Brock and Arnold2000). The snow and ice albedo (α) is parameterized following Oerlemans and Knap (Reference Oerlemans and Knap1998). The ice albedo is set as a constant, which contrasts with Zhu and others (Reference Zhu2015). Incoming longwave radiation (L in) is parameterized following Sicart and others (Reference Sicart, Hock, Ribstein, Litt and Ramirez2011) and includes the longwave emission from surrounding slopes. Outgoing longwave radiation (L out) is computed from the surface temperature using the Stefan–Boltzmann law. H sen and H lat are the sensible and latent heat fluxes calculated using the bulk method (Fujita and Ageta, Reference Fujita and Ageta2000). Subsurface heat flux (QG) and C en are estimated following Fujita and Ageta (Reference Fujita and Ageta2000). For detailed model information and parameters, refer to Table A1 and Appendix C. The primary data involved with the application of the above stated model include daily air temperature, relative humidity, wind speed and incoming shortwave radiation from AWS2, as well as precipitation from AWS1.
3. RESULTS
3.1. Model calibration and uncertainty
Figure 3 compares simulated and measured mass balance over different timescales at MZ15 glacier. Figure 3a summarizes the model performance at all stake points from 2008 to 2012. The correlation coefficient (R) is 0.91 and the RMSE is 176 mm w.e. Figure 3b compares the simulated and measured annual glacier-wide mass balance from 2005/06 to 2011/12. The measured and modeled values closely agree, except for a discernible underestimation during the 2006–2007 mass-balance year. This may be linked to the abnormally low precipitation frequency and amount in the corrected precipitation time series during this mass-balance year. By differencing the digital elevation models, Holzer and others (Reference Holzer2015) estimated an average mass balance of 0.21 ± 0.27 m w.e. a−1 from 1999 to 2013 and Zhang and others (Reference Zhang2016b) reported an average mass balance of 0.05 ± 0.18 m w.e. a−1 from 1976 to 1999. Our values are 0.05 m w.e. a−1 from 1999 to 2013 and −0.13 m w.e. a−1 from 1980 to 1999. Both of our values lie within the uncertainties of the reconstructed time series from Holzer and others (Reference Holzer2015) and Zhang and others (Reference Zhang2016b). The good agreement between the simulated and measured mass balances at different intervals validates the model's performance. Owing to the lack of long-term mass-balance measurements in this region, another long-term dataset is needed to indirectly evaluate our simulations, particularly with respect to interannual variations. Abramov glacier (39.62°N, 71.56°E) is in the northwest Pamir, which is ~340 km northwest of MZ15 glacier (Fig. 1a). The mass balance of Abramov glacier was measured from 1987/1988 to 1997/1998, and the measurements can be downloaded from the glacier mass-balance bulletin in the world glacier monitoring service (WGMS, 2011, 2013). The mass balances of the two glaciers are in good agreement with a correlation coefficient of 0.82 at a significance level of 0.001 from mass-balance years 1987/1988 to 1997/1998. Figure 3b compares the modeled mass balance in this study with the modeled regional mass balance of the Kangxiwa River basin for the respective periods from Shen and others (Reference Shen, Xie, Ding and Liu1997) whose mass balances were reconstructed based on river runoff at the Kalakuli hydrology station (38°40′N, 74°58′E, 3300 m a.s.l.), which is close to Muztag Ata. A correlation yielded an R of 0.72 from 1980 to 1990 (p < 0.05). Lastly, the reconstructed mass balance of MZ15 glacier was compared with the annual discharge at Kelek Hydrological station (75°23′33.54″E, 38°48′52.42″N) from Li and others (Reference Li, Li and Wang2003) (Fig. 3b), which yield an R of −0.67 from 1980 to 2002 (p < 0.05). These results demonstrate that the energy-based mass-balance model, which is driven by the corrected meteorological data, can satisfactorily reconstruct the mass-balance variations (1980–2012) at MZ15 glacier.
Fig. 3. Comparison of modeled and measured mass balance at stakes on MZ15 glacier (a) and comparison between the modeled and measured glacier-wide annual mass balance for MZ15 glacier, along with the measured mass balance for Abramov glacier and reconstructed mass balance of the Kangxiwa River basin in Muztag Ata-Kongur Ata (Shen and others, Reference Shen, Xie, Ding and Liu1997) (b).
Sensitivity analysis of the model parameters can be used to assess uncertainties in the annual mass balance. Previous work has shown that the model output is most sensitive to parameters in parameterizations of α and turbulent heat fluxes, temperature lapse rate (T rate), precipitation lapse rate (P rate) and air temperature thresholds for snow (T snow) and rain (T rain) (Mölg and Hardy, Reference Mölg and Hardy2004; Hock and Holmgren, Reference Hock and Holmgren2005; Giesen and others, Reference Giesen, Van den Broeke, Oerlemans and Andreassen2008, Reijmer and Hock, Reference Reijmer and Hock2008; Zhu and others, Reference Zhu2015). Both T rate and P rate on MZ15 glacier were derived from field measurements, and uncertainties in the model parameters are associated with the a snow, a firn and snow (or ice) exchange coefficient of turbulent heat flux (C S) due to a lack of direct measurements. According to the sensitivity analysis, the most sensitive parameter at MZ15 glacier is the snow albedo (a snow) in α model. Thus, a snow modified by ±10% provided two new sets of annual mass balances, in which one had a negative bias and the other had a positive bias. The uncertainty is taken as the highest std dev. calculated between these two new series and the initial mass-balance series (Azam and others, Reference Azam2014). The resulting uncertainty in the annual mass balance is ±0.19 m w.e. a−1. The area of MZ15 glacier showed almost no change between 1971 and 2014 (Zhang and others, Reference Zhang2016b), so we have not considered changes in the ice-covered area or surface elevation during the study period.
3.2. Mass-balance characteristics
Annual mass balance of the glacier during the study period varied from −784 mm w.e. in the 1983/1984 balance year to 431 mm w.e. in the 2009/2010 balance year. The mean annual mass balance of this glacier was −63 mm w.e., and the cumulative mass balance was −2039 mm w.e. (Table 2). Sublimation (−317 mm w.e. a−1) was the greatest ablation process, which is the largest component of glacier-wide mass loss, especially during the cold season. Surface melt (−160 mm w.e. a−1), especially in July and August (which are the hottest months of the year), was the second largest factor for glacier-wide mass loss. Surface melt was only slightly (9 mm w.e. a−1) larger than sublimation in the ablation season (July to September). Snowfall (390 mm w.e. a−1) contributed the largest mass gain during both the ablation and cold seasons. Snowfall in the ablation season was only 96 mm w.e. (~1.65 times) higher than that in the cold season (October to May), and snowfall in the cold season mainly occurred in April and May. In addition, 23, 54, 13 and 10% of the annual snowfall occurred in spring, summer, autumn and winter. Compared with autumn and winter, the snowfall in the ablation season is the most important for glacier accumulation, and snowfall in spring is also important for glacier accumulation. This indicates that MZ15 glacier is a spring–summer accumulation-type glacier, according to the classification of glaciers on the TP proposed by Maussion and others (Reference Maussion2013). This is different from spring accumulation-type glaciers with most accumulation occurring in spring (Yang and others, Reference Yang2013) and summer accumulation-type glaciers with most accumulation occurring in summer (Fujita and Ageta, Reference Fujita and Ageta2000). The snowfall in the ablation season was 1452 mm w.e. (~3.80 times) higher than that in the cold season on Zhadang glacier in the south TP (Zhu and others, Reference Zhu, Yao, Yang, Xu and Wang2017a, Reference Zhub), and the snowfall in the ablation season was 1391 mm w.e. (~1.94 times) smaller than that in the cold season on Parlung No. 4 glacier in the southeast TP (Zhu and others, Reference Zhu, Yao, Yang, Xu and Wang2017a, Reference Zhub). Refreezing (24 mm w.e. a−1, 15% of the surface melt) also contributed to mass gain. Compared with Parlung No. 94 glacier in the southeast TP, Zhadang glacier in the south TP and Xiao Dongkemadi glacier in the central TP (Fujita and Ageta, Reference Fujita and Ageta2000; Yang and others, Reference Yang2013; Zhu and others, Reference Zhu2017b), MZ15 glacier showed relatively low melt and accumulation but high sublimation at an annual timescale. In addition, this glacier shows characteristics of spring–summer accumulation with most snowfall occurring in the ablation season or summer.
Table 2. Annual and seasonal mean values of meteorological variables, and annual and seasonal cumulative values of mass-balance components

3.3. Mass-balance change and its climatic drivers
During the past 32 years (1980–2012), MZ15 glacier experienced varying annual patterns of mass balance (Fig. 4a). Two distinct periods (1980–1997 and 1998–2012) in this mass-balance series were identified based on their mass gain or loss (Fig. 4a). The most likely abrupt change point during the mass-balance series occurred in 1997/1998 according to the Mann–Kendall (M–K) test, which is a nonparametric statistical test and has been used to analyze the abrupt change points of air temperature, precipitation, glacier mass balance, flooding, etc. (Wei, Reference Wei2008; Mallakpour and Villarini, Reference Mallakpour and Villarini2015; Wang and others, Reference Wang, Wang and Pu2016), as well as a cumulative mass balance for the reconstructed mass balance of MZ15 glacier. An equivalent change point was detected in 1997 in the mass balance on Glacier No. 1 at the headwaters of the Urumqi River (Yuan and others, Reference Yuan, Hao, Berndtsson, Jiang and Yasuda2016). The recent global warming hiatus after 1997/98 (Wang and others, Reference Wang, Yuan, Xie, Wu and Li2016b) was also found in the δ 18O records of the Kuokuosele ice core in the Muztag Ata region (Drolkar and others, Reference Drolkar2016). The results are further confirmed by the ice core δ 18O records and station measurement data, which showed little change in air temperature between 2000 and 2014 across the northwestern TP (An and others, Reference An2016). Thus, the identification of these two distinct periods is meaningful in the analysis of mass balance and climate change in the Muztag Ata region.
Fig. 4. Time series of the annual mass balance of MZ15 glacier (a), the annual mean meridional wind speed at the 300 hPa geopotential height over the northwest TP of 71–81°E and 35–44°N (b), and annual mean zonal wind speed at the 300 hPa geopotential height over the WEST region at 55–70°E and 35–50°N (c). Red horizontal lines are the average values between 1980–1997 and 1998–2012, respectively.
During period A (1980–1997), MZ15 glacier lost mass at rates of −161 mm w.e. a−1, whereas during period B (1998–2012), it gained mass slightly with a mean annual glacier-wide mass balance of 59 mm w.e. a−1 (Table 2). Analyzing the differences between each mass-balance component during both periods reveals that solid precipitation and glacier melt show large differences (Table 2). Snowfall was 57 and 56 mm a−1 larger during period B than period A, which was during both the ablation and cold seasons, respectively. The differences in the cold season snowfall between the two periods occurred mainly in spring and not in winter (Fig. 5). Glacier melt was 94 mm a−1 smaller in period B than in period A during the ablation season. The differences between periods A and B for the other components were smaller than 10 mm w.e. a−1. Thus, snowfall in the ablation season and in spring, as well as glacier melt were the primary factors responsible for the difference in mass balance between the two periods.

Fig. 5. Snowfall and precipitation in the ablation season (June to September), in spring (March to May) and in winter (December to February) for the different periods. Rainfall is too small to see in the figure. Precipitation = snowfall + rain.
Both the snowfall and glacier melt are linked to air temperature in the ablation season, as well as precipitation in spring and in the ablation season. Because almost all precipitation fell as snow on MZ15 glacier (Table 2, Fig. 5), we conclude that the amount of precipitation, but not air temperature, influenced snowfall. Compared with period A, air temperature in the ablation season was only 0.1°C higher and the annual precipitation was 112 mm a−1 higher in period B. A slight increase in air temperature did not result in a larger mass loss for period B. In fact, mass balance was slightly positive for period B due to increased precipitation, which occurred during both the ablation season and spring (Figs 5, 6a).
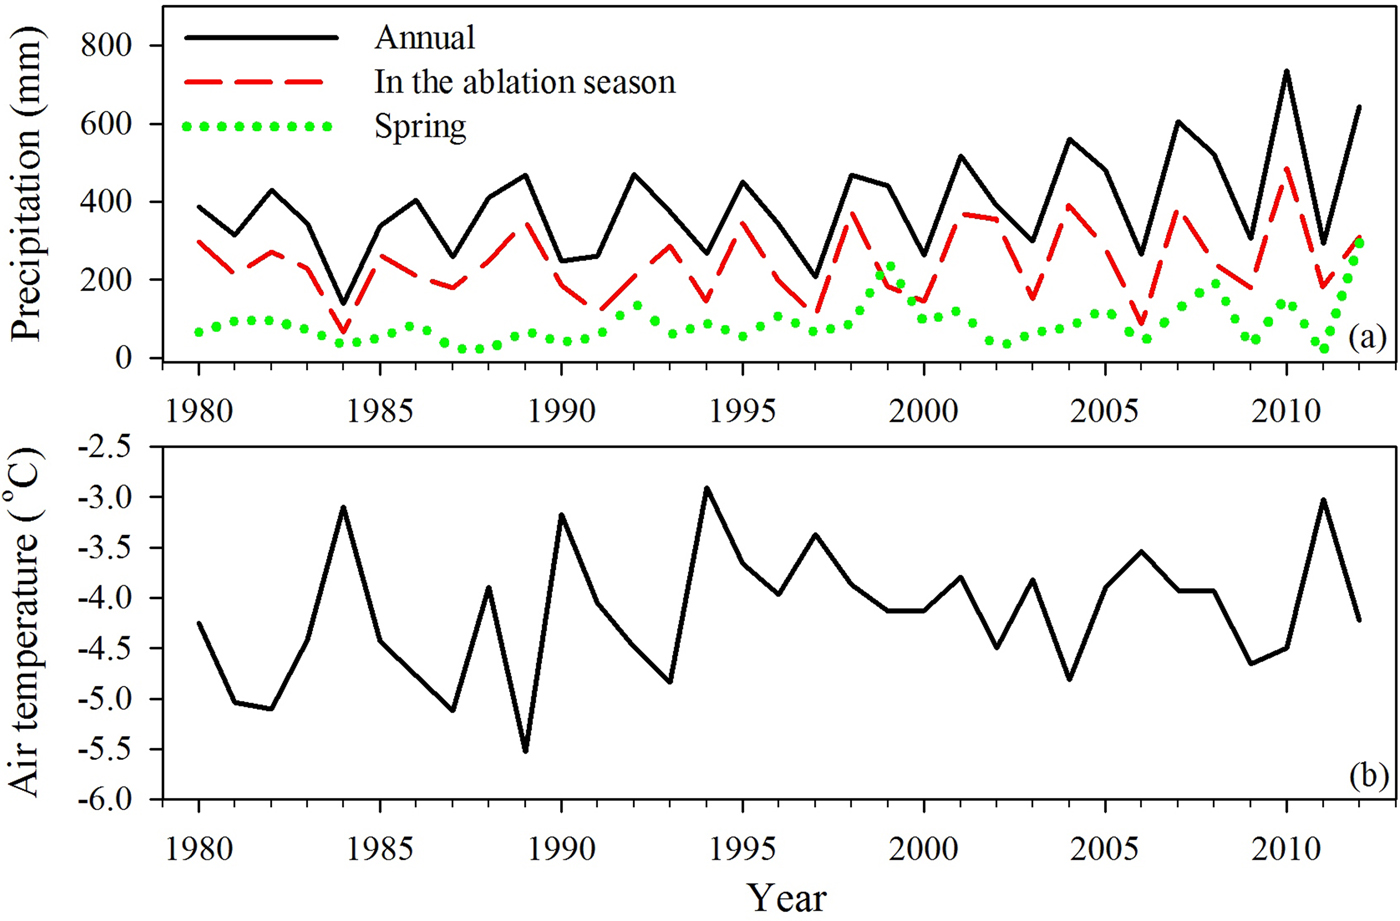
Fig. 6. Glacier-wide annual precipitation, precipitation in the ablation season and in spring (a), and (b) mean temperature in the ablation season for the period of 1980–2012.
To assess climatic drivers, the relationships among air temperature, precipitation and annual mass balance are reported in Table 3. During the ablation season, increased precipitation/snowfall reduced mass loss by increasing both mass accumulation and albedo. The high correlation coefficient (0.61) between albedo and precipitation in the ablation season demonstrates that precipitation in the ablation season has a large influence on albedo, and thus on mass balance. Owing to the surface snow albedo feedback mechanism (Oerlemans and others, Reference Oerlemans, Giesen and Van Den Broeke2009), less solar radiation will be absorbed for snowmelt when the albedo is higher following precipitation/snowfall, which in turn prolongs the duration of the snowpack and sustains a higher albedo. Thus, precipitation in the ablation season will have a larger influence on the mass balance of MZ15 glacier. However, the influence of the change in spring precipitation on the mass balance of MZ15 glacier occurs mainly through a change in accumulation. Spring precipitation does not influence surface melt (no melt occurring) and sublimation (controlled by air temperature and wind speed) in spring. In addition, spring precipitation has a low correlation with albedo in the ablation season (0.5), and this is due to spring precipitation influencing albedo in the ablation season through a change in snow thickness. If more snow falls on the glacier surface in spring, snow thickness is large at the beginning of the ablation season. This process can maintain snow surface longer, and thus albedo is higher in the ablation season. However, this influence on albedo is limited. Compared with spring precipitation, albedo in the ablation season is more strongly influenced by snowfall/precipitation in the ablation season through the snowfall amount and frequency, which are the main factors affecting albedo. After snowfall, albedo increases sharply and melting noticeably decreases (Favier and others, Reference Favier, Wagnon, Chazarin, Maisincho and Coudrain2004a). Thus, spring precipitation has a relatively low correlation with the mass balance on MZ15 glacier (Table 3). Air temperature in the ablation season also has a relatively low correlation with mass balance (Table 3), because the change in air temperature only directly affects incoming longwave radiation and turbulent heat fluxes and does not affect the change in snowfall. This reduces the influence of the air temperature change on the mass balance (Mölg and others, Reference Mölg, Cullen, Hardy, Kaser and Klok2008; Anderson and others, Reference Anderson2010).
Table 3. The correlation coefficient (r) among glacier-wide annual mass balance (MB) and glacier-wide precipitation in the different seasons, and glacier-wide annual MB and glacier-wide air temperature in the different seasons for different periods. The ‘**’ sign indicates that the correlation is significant at the 99.9% confidence level and the ‘*’ sign indicates that the correlation is significant at the 95% confidence level
Ablation season: 1 July–30 September; cold season: 1 October–31 May.
Furthermore, we separately analyze the relationship of precipitation and air temperature with mass-balance variation for the two periods (Table 3). Previous research has found that the climatic factors controlling the change in glacier mass balance may be different during different time periods (Zhang and others, Reference Zhang, Hirabayashi and Liu2012). In period A, the linear trends of mean air temperature in the ablation season increased significantly, whereas the linear trends of precipitation during the year and in the ablation season decreased (but not significantly) (Fig. 6). The correlation between annual mass balance and air temperature in the ablation season was nearly the same as that between annual mass balance and precipitation in the ablation season. During period B, there was little variation in the mean air temperature in the ablation season, but the linear trends of precipitation during the year and the ablation season increased significantly (Fig. 6). Compared with period A, the correlation between annual mass balance and air temperature in the ablation season decreased, but the correlation between annual mass balance and precipitation in the ablation season increased (Table 3). Overall, precipitation, especially in the ablation season, was the dominant factor controlling changes in mass balance at MZ15 glacier. Air temperature in the ablation season and precipitation in spring were also important factors controlling mass-balance changes at MZ15 glacier.
4. DISCUSSION
4.1. Large-scale circulation influences interannual changes in mass balance at MZ15 glacier
According to the above analysis, the processes controlling glacier mass balance at MZ15 glacier changed between the period of 1980–1997 and 1998–2012, perhaps due to a shift in the circulation pattern in this region. Figures 7a, b are composites of the annual mean 300 hPa geopotential height and horizontal wind anomalies for the two periods. An anomalously positive mass balance during the period of 1998–2012 for MZ15 glacier is associated with a region of anomalous cyclonic flow over Iran, Central Asia and north Pakistan, and a region of anomalous anticyclonic flow over eastern China (Fig. 7). During the negative mass-balance years, the anomalies at the 300 hPa geopotential height and horizontal wind direction were reversed. Therefore, the pattern of large-scale atmospheric flow over the TP may be important for changes in glacier mass balance. This relationship shows that the large-scale atmospheric circulation plays a key role in controlling the glacier mass balance by influencing precipitation and air temperature (Mölg and others, Reference Mölg, Maussion and Scherer2014; Yang and others, Reference Yang, Guo, Yao, Zhu and Wang2016).

Fig. 7. Composites of the 300 hPa geopotential height and horizontal wind anomalies for the years in which mass balance of MZ15 glacier was negative (1998–2012) (a) and slightly positive (1980–1997) (b) during the ablation season (June to September). Black dot shows the site of MZ15 glacier. The data were obtained from the National Center for the Environmental Predictions-National Center for Atmospheric Research (NCEP/NCAR).
The Muztag Ata region was influenced by southerly wind anomalies during the period of 1998–2012, and northerly wind anomalies during the period of 1980–1997. This contrasting pattern between the two periods is discernible in the temporal variation of air temperature/precipitation anomalies, especially that of precipitation in the ablation season (Table 2). As stated above, precipitation in the ablation season is the most important factor controlling temporal changes in mass balance at MZ15 glacier. Both Aizen and others (Reference Aizen, Aizen, Melack, Nakamura and Ohta2001) and Kononova and others (Reference Kononova2015) believed that a stronger meridional component of atmospheric circulation favored synoptic weather systems that promote precipitation. Thus, the mass balance of MZ15 glacier is linked to large-scale climate dynamics.
To study the relationship between glacier mass changes and large-scale circulations, we analyzed the correlation between the mass balance of MZ15 glacier and the area-averaged 300 hPa meridional wind component in a selected rectangular region (35–44°N, 71–81°E) as a representative zone of the northwest TP, which contains the Karakoram, western Kunlun mountains, Pamir and western Tian Shan mountains, during the period of 1980–2012 (Figs 4a, b). The correlation is significant (r = 0.66, p < 0.01) and the correlation using detrended data is also significant (r = 0.57, p < 0.01), with the positive sign indicating that stronger flow from the south favors a positive mass balance. This indicates that area-averaged 300 hPa meridional wind speeds in the ablation season are important for the mass balance of MZ15 glacier during the period of 1980–2012.
To test the strength of the relationship between glacier mass balance and area-averaged 300 hPa meridional wind at a regional scale, we further analyzed other glaciers with mass-balance measurements: Abramov glacier, Tsentralniy Tuyuksuyskiy glacier, Kara-Batkak glacier and Golubina glacier. Because these glacier mass balances are measurements, we can assume that all these data were accurate and were used to analyze the relationship between glacier mass balance and the 300 hPa meridional wind at a regional scale. Their shorter records complicate the statistical interpretation but the available mass-balance data also support the relationship (Fig. 8). During the periods of 1998–2012, the intensified meridional flow transported more water vapor to the TP (Gao and others, Reference Gao, Cuo and Zhang2013; Lu and others, Reference Lu, Trenberth, Qin, Yang and Yao2015). The warming and moistening increased atmospheric instability, which triggered vertical mixing, thicker cloud cover and more precipitation (Yang and others, Reference Yang2012).
Fig. 8. Direct measurements of annual mass-balance at Tsentralniy Tuyuksuyskiy glacier (1981–2012), Kara-Batkak (1988–1997), Golubin glacier (1988–1993 and 2011–2012) and Abramov glacier (1988–1998) as a function of the regional meridional wind at the 300 hPa geopotential height, with their correlation coefficient (R, p < 0.05). The locations of the four glaciers are shown in Figure 1a.
The climate of the Muztag Ata region is controlled by the westerly jet stream year-round and is not related to the Indian monsoon (Yao and others, Reference Yao2012). As part of a circumglobal wave train that transfers energy perturbations from the North Atlantic to eastern Asia (Ding and Wang, Reference Ding and Wang2005; Mölg and others, Reference Mölg, Maussion and Scherer2014), upstream zonal flow variations are linked to the regional circulation conditions in the Muztag Ata region (Duan and others, Reference Duan, Xu and Wu2015). When westerly winds between 30 and 50°N from the Mediterranean Sea to Pamir are weakened/strengthened, anomalous cyclonic/anticyclonic circulations develop in Iran, Central Asia and north Pakistan (Duan and others, Reference Duan, Xu and Wu2015). Thus, south/north wind anomalies occur in the Muztag Ata region. From this, we can deduce that the upstream zonal flow pattern can influence mass balance in the Muztag Ata region. A negative correlation (−0.55) exists between the annual mean zonal wind speed in the ablation season over the WEST region (35–50°N and 55–70°E, Mölg and others (Reference Mölg, Maussion and Scherer2014)) at a 300 hPa geopotential height and the reconstructed mass balance from 1980 to 2012 (Figs 4a, c), further verifying the above statements. Thus, we propose that changes in mass balance at MZ15 glacier are likely related to changing circulation patterns.
4.2. Comparing Muztag Ata No.15 glacier with other glaciers on the TP
The annual mass balance of MZ15 glacier followed a statistically significant positive trend at the 1% significance level. The most distinct feature is that a slight mass gain has occurred since 1998, but a significant mass loss occurred during 1980–1997. This trend is consistent with the net accumulation of the Kuokuosele ice core from the Muztag Ata region (Drolkar and others, Reference Drolkar2016), and is also consistent with the conclusion of Holzer and others (Reference Holzer2015) who found that mass balance was slightly positive during 2000–2013 and slightly negative during 1976–1999 in the Muztag Ata region. The slower retreat rate during 2000–2012 than during the 1970s–2000 also occurred on glaciers in the Karakoram mountains, western Kunlun mountains and eastern Pamir, according to the published data (Table 4). This trend is opposite to the ongoing and widespread glacier recession in the monsoon region and in some regions in the westerlies zone, such as the Tian Shan and Qilian mountains, where the glaciers have shown a stronger retreat and mass loss after the 2000s (Bolch and others, Reference Bolch2012; Yao and others, Reference Yao2012; Zhang and others, Reference Zhang, Hirabayashi and Liu2012; Azam and others, Reference Azam2014; Farinotti and others, Reference Farinotti2015; Yang and others, Reference Yang, Guo, Yao, Zhu and Wang2016).
Table 4. The area changes of glaciers in the Western Kunlun mountains, Karakoram mountains and eastern Pamir for the different periods

Inconsistent with the spatially different variations in the Tibetan glacier mass balance, the TP shows an overall warming and increased precipitation (except for some regions in the southeast TP) (Li and others, Reference Li, Yang, Wang, Zhu and Tang2010; Yao and others, Reference Yao2012; Gao and others, Reference Gao, Leung, Zhang and Cuo2015; Zhang and others, Reference Zhang2017). The precipitation and air temperature were larger during the period of 1998–2012 than during the period of 1976–1997 for most regions of the TP (Zhang and others, Reference Zhang2017). Under such warming and increased precipitation, glaciers in different regions of the TP have shown varying behaviors due to different responses to climate change under the effects of different regional climate and different topographic factors.
The regional climate conditions, especially air temperature and precipitation, are the most important factors contributing to these varied changes in the glaciers. The mean air temperature in the ablation season from Moderate Resolution Imaging Spectroradiometer (MODIS) land surface temperature data, CMFD data and the High Asia Refined analysis (HAR) data from the Advanced Weather Research and Forecasting numerical atmospheric (WRF) model show different spatial patterns on the TP (He and Yang, Reference He and Yang2011; Maussion and others, Reference Maussion2013; Zhang and others, Reference Zhang, Zhang, Ye, Che and Zhang2016a): the mean air temperature in summer is significantly lower in the Karakoram mountains, western Kunlun mountains and eastern Pamir than in most regions on the TP (figure is not shown). Such different spatial distributions of air temperature on the TP will cause spatial differences in the changes in glacier mass balance through spatial differences in snowfall change and melt energy change under warming and increased precipitation (Zhu and others, Reference Zhu2017b).
This raises the question as to how an increase in air temperature and precipitation resulted in the spatial differences in snowfall change on the TP. By analyzing the ratio of snowfall to precipitation in the ablation season from the HAR data (Fig. B2), Zhu and others (Reference Zhu2017b) found that for most glaciers on the TP, air temperature is near to or higher than the threshold temperature for snow; in contrast, for glaciers in the Karakoram mountains, western Kunlun mountains and eastern Pamir, air temperature has also increased but has remained lower than the threshold temperature for snow under warming and increased precipitation. We can deduce that snowfall is still decreasing in most regions of the TP and is increasing in the Karakoram mountains, western Kunlun mountains and eastern Pamir in the northwestern TP under warming and increased precipitation. This is in line with Hu and Liang (Reference Hu and Liang2014) and Wang and others (Reference Wang2016a) who found that snowfall is still decreasing in most regions of the TP due to increasing air temperature, and it is also increasing in the northwestern TP, according to weather station observations on the TP.
The low air temperature has little influence on the amount of snowfall due to almost all precipitation falling as snow, which leads to low-energy input (such as low incoming longwave radiation, sensible heat flux and latent heat flux) under warming and increased precipitation for glaciers in the Karakoram mountains, western Kunlun mountains and eastern Pamir. This has led to a very small decrease in albedo, and thus, there is a slight increase in melt and mass loss for glaciers in these regions under warming and increased precipitation. The small change in precipitation falling as snowfall under increased air temperatures led to low sensitivity of mass balance to air temperature change and high sensitivity of mass balance to precipitation change, which was also demonstrated by Favier and others (Reference Favier, Wagnon and Ribstein2004b), Francou and others (Reference Francou, Vuille, Favier and Cáceres2004), Mölg and others (Reference Mölg, Cullen, Hardy, Kaser and Klok2008) and Zhu and others (Reference Zhu2017b). In addition, it can be deduced that a change in the amount of snowfall for these regions was mainly the result of changes in the amount of precipitation based on the above statements. With increases in precipitation in the main precipitation seasons (Hewitt, Reference Hewitt2005; Yao and others, Reference Yao2012; Kapnick and others, Reference Kapnick, Delworth, Ashfaq, Malyshev and Milly2014; Zhang and others, Reference Zhang2017), such as in winter in the Karakoram, and in the ablation season in the Muztag Ata region, this leads to increases in snowfall and further decreases in melt energy in the ablation season due to increasing albedo under warming and increased precipitation. Thus, a small mass loss occurred in these regions under warming and increased precipitation. Even snowfall or mass accumulation may be slightly greater than mass loss for some glaciers in the Karakoram mountains, western Kunlun mountains and eastern Pamir. Moreover, although some studies have shown a significant warming trend for the period of 1970–2000 and a decreasing trend from 2001 to 2012 (An and others, Reference An2016), the mean air temperature was higher during 2001–2012 than 1970–2000 (Zhang and others, Reference Zhang2017). This means that a greater mass loss occurred during the period of 2001–2012 than during 1970–2000 for these regions, which was in contrast with the observed regional glacier changes. Both of these points illustrate that compared with air temperature variation, the precipitation variation has a greater contribution to the anomalously smaller mass loss and area shrinkage of glaciers in the Karakoram mountains, western Kunlun mountains and eastern Pamir during the past 10 years than during 1970–2000.
In contrast, the high air temperature leads to a decrease in snowfall due to most precipitation falling as rain and contributes a greater energy input (such as incoming longwave radiation, sensible heat flux and latent heat flux) to melting in the ablation season under warming and increased precipitation across most regions of the TP (Zhu and others, Reference Zhu2017b). This reduces the glacier surface albedo, thereby increasing the melting of glaciers through albedo feedback. Thus, a large mass loss occurred in these regions under warming and increased precipitation. In addition, Favier and others (Reference Favier, Wagnon and Ribstein2004b), Francou and others (Reference Francou, Vuille, Favier and Cáceres2004) and Mölg and others (Reference Mölg, Cullen, Hardy, Kaser and Klok2008) found that greater changes in precipitation falling as snowfall under increased air temperatures led to high sensitivity of the mass balance to air temperature changes. Thus, air temperature is a more important factor than precipitation for controlling mass-balance changes in these regions. This agrees with some studies in the monsoon region and some regions of the westerlies zone (Pu and others, Reference Pu2008; Wang and others, Reference Wang, He, Pu, Jiang and Jing2010; Dong and others, Reference Dong, Qin, Ren, Li and Li2012; Zhang and others, Reference Zhang, Hirabayashi and Liu2012; Yang and others, Reference Yang, Guo, Yao, Zhu and Wang2016; Zhu and others, Reference Zhu2017b).
Topographic factors such as aspects, sizes, shapes, hypsometry (area distribution with altitude) and altitudinal ranges of glaciers also contribute to the varying glacier responses to warming and increased precipitation. These variables influence the air temperature, precipitation, incoming solar radiation and incoming longwave radiation, which are the primary factors controlling glacier melt and accumulation. Among the different topographic factors, hypsometry of glaciers plays an important role in the response of glacier mass balance to climate changes (Oerlemans and others, Reference Oerlemans1998; Farinotti and others, Reference Farinotti2015; Liu and Liu, Reference Liu and Liu2015). Glaciers with a greater proportion of their areas at higher elevations are insensitive to the increase in air temperature and will lose a small amount of mass under warming and increased precipitation. This phenomenon is very significant for glaciers in the same region, where large differences in mass balance and retreat rate are observed in glaciers that are geographically close to one another (Bolch and others, Reference Bolch2010; Yao and others, Reference Yao2012; Farinotti and others, Reference Farinotti2015; Liu and Liu, Reference Liu and Liu2015). Take Zhadang and Gurenhekou glaciers in the West Nyainqentanglha Range as examples. According to the mass balance and glacier area-altitude distribution from Yu and others (Reference Yu2013), it was found that compared with Zhadang glacier, the mode of the area-altitude distribution is higher on Gurenhekou glacier, which has a smaller mass loss.
A similar result (small mass loss at high altitudes) can also apply to different regions with similar climate conditions. Glaciers in the Karakoram mountains, western Kunlun mountains and eastern Pamir are at higher altitudes than those in some regions of the north TP (such as the Qilian mountains) and Tian Shan mountains (Fig. 9). Although the median glacier height in eastern Pamir and the Qilian mountains is similar, the glacier area at low altitudes is proportionally greater in the Qilian mountains than in the eastern Pamir. The ratios of total glacier area below 5300, 5200, 5100 and 5000 m a.s.l. to regional total glacier area are 92.3% (68.6%), 83.4% (61.7%), 69.8% (54%) and 54% (46.1%) in the Qilian mountains (in the eastern Pamir), respectively.
Fig. 9. Glacierized area change with elevation in the Karakoram mountains, western Kunlun mountains, eastern Pamir, Qilian mountains and Tian Shan mountains. Altitude is obtained from the digital elevation model (DEM) which is the Shuttle Radar Topography Mission (SRTM) DEM with resolution of 90 m. The glacier outline is from the Second Glacier Inventory Dataset of China (Version 1.0) (Guo and others, Reference Guo2014).
At higher altitudes, there is higher precipitation, greater cloud cover and lower air temperature (Hewitt, Reference Hewitt2005). Therefore, because the air temperature is further below the threshold temperature for snow at higher altitudes, there is a weaker influence of the increased air temperature on snowfall and melt energy under warming and increased precipitation than at lower altitudes. The increased precipitation at higher altitudes also leads to more precipitation falling as snowfall than at lower altitudes. These processes lead to greater accumulation and reduce melt energy, and therefore, this results in a lower glacier mass loss in the Karakoram mountains, western Kunlun mountains and eastern Pamir under warming and increasing precipitation conditions. At lower altitudes, the above processes are reversed. Therefore, glacier mass loss is larger in the monsoon region and in some regions of the westerlies zone under warming and increased precipitation.
Overall, contrary to the accelerating mass loss and area shrinkage of most glaciers on the TP, glaciers in the Karakoram mountains, western Kunlun mountains and eastern Pamir have shown less mass loss and area shrinkage during the most recent 10 years than those during the 1970s–2000. This is primarily due to a varying response of snowfall to warming and increased precipitation. In addition, to a lesser extent, different topographic factors also contributed to these spatial changes in the Tibetan glaciers.
5. CONCLUSIONS
By applying an energy-based mass-balance model, the mass balance of MZ15 glacier in the eastern Pamir was reconstructed between 1980 and 2012, which yielded an estimated mean annual mass loss of 63 mm w.e. a−1. According to the results from the model, MZ15 glacier showed low melt, high sublimation and low accumulation and may be a spring–summer accumulation-type glacier, where most snowfall occurs in the ablation season or summer. In addition, the annual mass exhibited clear interannual fluctuations, with a significantly positive phase since 1998. Quantitative analysis of the role of temperature and precipitation in the mass-balance changes at MZ15 glacier revealed that precipitation in the ablation season is a primary driver of these mass-balance fluctuations, and precipitation in spring and air temperature in the ablation season are also important controls. Furthermore, changes since 1998 in glaciers in the Muztag Ata region are linked to more precipitation in the ablation season, which is associated with atmospheric circulation anomalies. More precipitation occurred when a southerly wind anomaly prevailed in the Muztag Ata region due to an enhanced meridional water vapor transport. During low precipitation years, a northerly wind anomaly in the Muztag Ata region caused a reduced meridional water vapor transport. These processes seem to be linked to the mid-latitude climate. Lastly, we assimilated the glacier mass-balance changes and glacier area changes reported in previous works, which show that glaciers in the Karakoram mountains, western Kunlun mountains and eastern Pamir have experienced reduced glacier retreat or mass loss over the past 10 years, when compared with the glacier mass-balance changes and glacier area changes during the 1970s–2000. This pattern is contrary to changes observed in most glaciers on the TP and is mainly attributed to regional differences in the impact of warming and increased precipitation on snowfall change due to different climatic conditions. Topographic factors have also played a role in these regional differences in glacier changes.
SUPPLEMENTARY MATERIAL
The supplementary material for this article can be found at https://doi.org/10.1017/jog.2018.16.
ACKNOWLEDGEMENTS
We acknowledge the staff at Muztagh Ata Station for Westerly Environment Observation and Research, Institute of Tibetan Research, Chinese Academy of Sciences, for help in the field. We thank two anonymous reviewers, chief editor Graham Cogley, and scientific editor Hamish Pritchard for valuable insights that greatly strengthened the manuscript. We thank the Third Pole Environment Database, Institute of Tibetan Research, Chinese Academy of Sciences and the National Climate Center, China Meteorological Administration, for providing the climate data used herein. We thank Dieter Scherer and Julia Curio (Technical University of Berlin) and Fabien Maussion (University of Innsbruck) for providing the HAR data, and Kun Yang (Institute of Tibetan Research, Chinese Academy of Sciences) for providing the CMFD data. The SRTM data and the Landsat data were provided by the US Geological Survey. This study is jointly funded by National Natural Science Foundation of China (grant Nos. 41601081, 41190081, 91547104, 41371085 and 40901047), the ‘Key Research Programs in Frontier Sciences’ of the Chinese Academy of Sciences (grant No. QYZDY-SSW-DQC003) and China Postdoctoral Science Foundation (grant No. 2017M611014).


 Open access