


1. INTRODUCTION
Fast-flowing ice in the Antarctic ice sheet accounts for the majority of mass transport to the oceans (e.g., Rignot and others, Reference Rignot, Mouginot and Scheuchl2011). Fast flow is accommodated primarily by slip at the bed (Morlighem and others, Reference Morlighem, Seroussi, Larour and Rignot2013; Arthern and others, Reference Arthern, Hindmarsh and Williams2015) and restrained in part by drag in the lateral shear margins (Echelmeyer and others, Reference Echelmeyer, Harrison, Larsen and Mitchell1994; Raymond, Reference Raymond1996; Joughin and others, Reference Joughin, MacAyeal and Tulaczyk2004). Lateral shear margins are bands of intense deformation that separate relatively fast-flowing ice from stagnant ice or rock (Fig. 1) and drag in shear margins is a function of the rheology of ice within the margin. The rheology evolves in response to damage, heating, melting, and the development of crystallographic fabric, each of which depend on rates of local shearing and cumulative strain (Budd and Jacka, Reference Budd and Jacka1989; Scambos and others, Reference Scambos, Echelmeyer, Fahnestock and Bindschadler1994; Suckale and others, Reference Suckale, Platt, Perol and Rice2014). Though fundamental to understanding glacier dynamics and to making reliable projections of future glacier states, our knowledge of the relative contributions of these rheological mechanisms is incomplete (Schulson and Duval, Reference Schulson and Duval2009; Cuffey and Paterson, Reference Cuffey and Paterson2010; Hudleston, Reference Hudleston2015), in part because of the dearth of suitable data.
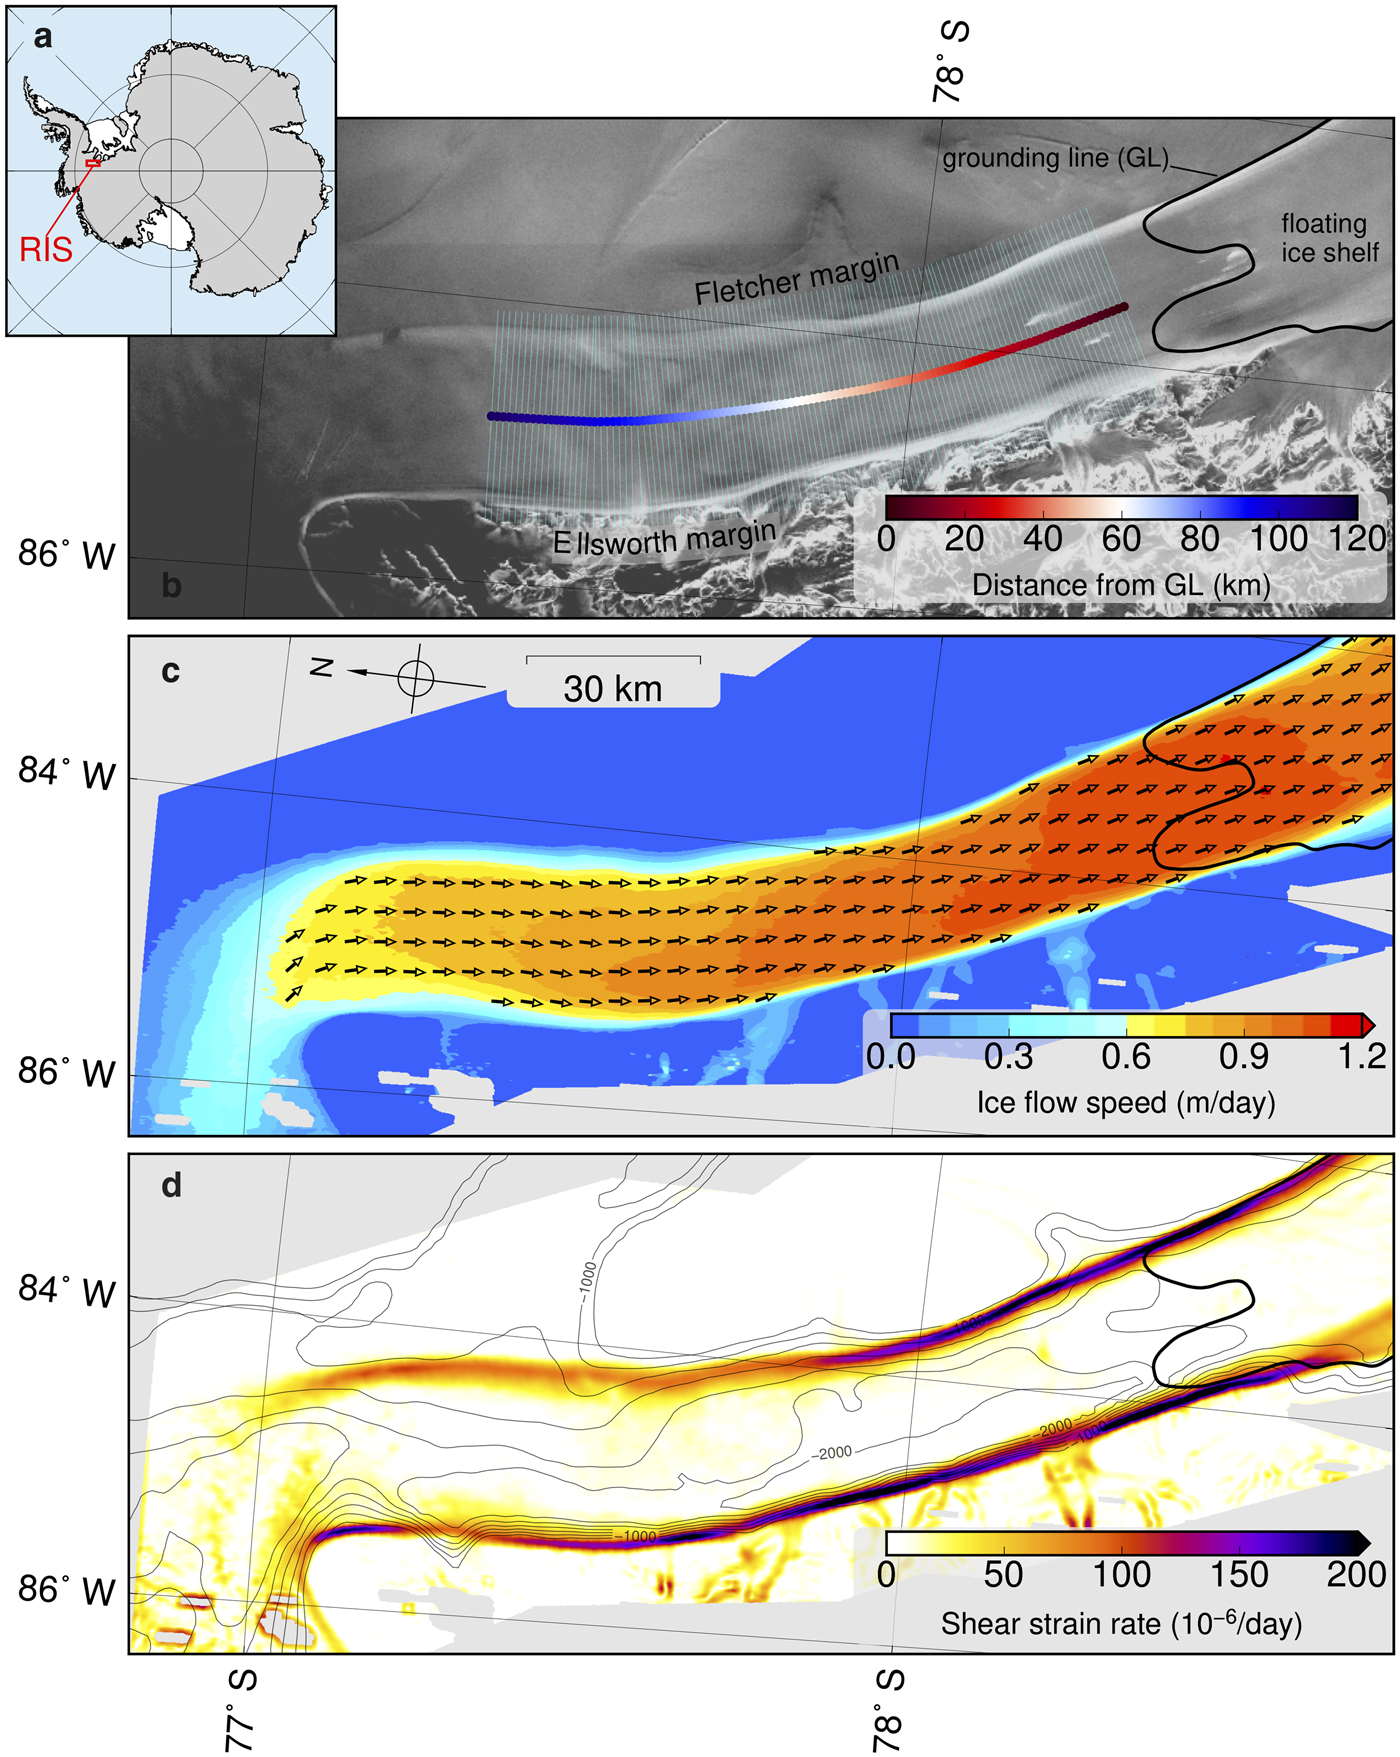
Fig. 1. Spatial characteristics of RIS. (a) Map of Antarctica showing the location of RIS and the outline of the region of interest in red. Ice shelves are shown in white and grounded ice in gray (Fretwell and others, Reference Fretwell2013). (b) Normalized radar backscatter amplitude (grayscale) from RADARSAT-1 AMM-1 (Jezek and others, Reference Jezek, Curlander, Carsey, Wales and Barry2013) overlain by transects (cyan) and distance color scheme used in Figures 2 and 4. (c) Surface velocity (Minchew and others, Reference Minchew, Simons, Riel and Milillo2017), where colormap indicates speed and equal-length arrows indicate flow direction. (d) Amplitude of lateral shear strain rate ( $\dot {\varepsilon }_{{\rm lat}}$) overlain by thin contour lines representing basal topography below −800 m elevation in 200 m increments (Fretwell and others, Reference Fretwell2013). In (b–d), the GL is indicated by the thick, sinuous black line (Minchew and others, Reference Minchew, Simons, Riel and Milillo2017). All maps are in South Polar Stereographic projection.
Sparse observations indicate that deformation heating warms ice at depth (Harrison and others, Reference Harrison, Echelmeyer and Larsen1998), potentially leading to the formation of temperate ice (Clarke and others, Reference Clarke, Liu, Lord and Bentley2000), and that crystalline fabric found at depth (~300 m) can enhance shear deformation rates for a given shear stress (Jackson and Kamb, Reference Jackson and Kamb1997). The existence of relatively warm ice at depth is consistent with rates of shear heating (e.g., Echelmeyer and others, Reference Echelmeyer, Harrison, Larsen and Mitchell1994; Scambos and others, Reference Scambos, Echelmeyer, Fahnestock and Bindschadler1994; Perol and Rice, Reference Perol and Rice2015) that are expected given the viscosity of ice (effective dynamic viscosity ~1012–1015 Pa·s), high shear strain rates (e.g. Fig. 1d), and the low thermal conductivity of ice (Table 1). The existence of crystalline fabric in shear margins is consistent with laboratory (Budd and Jacka, Reference Budd and Jacka1989; Jacka and Budd, Reference Jacka and Budd1989; Vaughan and others, Reference Vaughan2017), field (Hudleston, Reference Hudleston1977; Smith and others, Reference Smith2017) and borehole observations (Herron and Langway, Reference Herron and Langway1982) showing direction-dependent softening of ice.
Table 1. Model parameters. Unless otherwise stated, values are from (Cuffey and Paterson, Reference Cuffey and Paterson2010)
a. based on personal communication with R. Mulvaney
b. van Wessem and others (Reference van Wessem2014)
c. Doake and others (Reference Doake, Alley and Bindschadler2001)
d. Macayeal and others (Reference Macayeal, Rignot and Hulbe1998)
Mechanistic studies of shear margins often rely on observed surface velocities and models (e.g., Echelmeyer and others, Reference Echelmeyer, Harrison, Larsen and Mitchell1994; Raymond, Reference Raymond1996; Perol and Rice, Reference Perol and Rice2015; Elsworth and Suckale, Reference Elsworth and Suckale2016). These studies have illuminated numerous physical processes related to the thermomechanics of ice flow (e.g., Schoof, Reference Schoof2004, Reference Schoof2012; Hindmarsh, Reference Hindmarsh2004), the hydromechanical properties of subglacial till (e.g., Kyrke-Smith and others, Reference Kyrke-Smith, Katz and Fowler2013; Robel and others, Reference Robel, Schoof and Tziperman2016; Meyer and others, Reference Meyer, Fernandes, Creyts and Rice2016, Reference Meyer, Hutchinson and Rice2017; Lipovsky and Dunham, Reference Lipovsky and Dunham2017), the transport of subglacial till to form shear-margin moraines (Stokes and Clark, Reference Stokes and Clark2002; Hindmarsh and Stokes, Reference Hindmarsh and Stokes2008) and the detailed mechanics of the shear margin as a boundary-layer between a fast-flowing ice stream and the slow, convergent flow of an adjacent ice ridge (e.g., Schoof, Reference Schoof2012; Haseloff and others, Reference Haseloff, Schoof and Gagliardini2015). Most of these studies highlight the importance of heating through viscous dissipation, a prominent control on ice rheology because the softness of ice varies exponentially with temperature (Cuffey and Paterson, Reference Cuffey and Paterson2010; Hudleston, Reference Hudleston2015). Indeed, the temperature-dependence of ice rheology may give rise to thermoviscous instabilities that could help explain the formation of ice streams (Clarke and others, Reference Clarke, Nitsan and Paterson1977; Fowler and Johnson, Reference Fowler and Johnson1996; Hindmarsh, Reference Hindmarsh2004, Reference Hindmarsh2009).
Many studies that focus on the mechanics of ice stream shear margins take ice rheology in the margins to be constant (e.g., Schoof, Reference Schoof2004, Reference Schoof2012; Haseloff and others, Reference Haseloff, Schoof and Gagliardini2015), while others consider the influence of temperature and macroscopic damage but not fabric or texture on ice rheology (e.g., Thompson and others, Reference Thompson, Simons and Tsai2014; Suckale and others, Reference Suckale, Platt, Perol and Rice2014; Perol and Rice, Reference Perol and Rice2015; Elsworth and Suckale, Reference Elsworth and Suckale2016). These studies are often focused on understanding the complex mechanisms that govern the locations of ice stream shear margins that lack obvious lateral topographic control, so a simplified treatment of ice rheology may be justified. However, fabric, which describes the preferred crystalline orientation (see Cuffey and Paterson, Reference Cuffey and Paterson2010, §3.3.4), is important for large-scale ice flow (e.g., Ma and others, Reference Ma2010) and distinct from variations in temperature and melting for two important reasons: fabric induces anisotropy in ice rheology, thereby allowing ice to deform more readily in some directions than in others, and fabric tends to saturate under cumulative strains that can be reached within a few kilometers in shear margins, thereby mitigating the potential for fabric-induced dynamic feedbacks (Budd and Jacka, Reference Budd and Jacka1989; Jacka and Budd, Reference Jacka and Budd1989; Alley, Reference Alley1992). Fabric development depends on the deformational history of the ice (Alley, Reference Alley1988) and can take myriad complex forms with varying influences on ice rheology (Alley, Reference Alley1992; Cuffey and Paterson, Reference Cuffey and Paterson2010; Smith and others, Reference Smith2017). The effects of fabric are superimposed on the effects of crystal-size (texture), both of which are influenced by dynamic recrystallization, which can occur when the ice temperature approaches the melting temperature (Cuffey and others, Reference Cuffey2000a,Reference Cuffey, Thorsteinsson and Waddingtonb; Cuffey and Paterson, Reference Cuffey and Paterson2010).
Here, we use a unique ice-velocity dataset (Minchew and others, Reference Minchew, Simons, Riel and Milillo2017) to constrain thermomechanical and macroscopic damage models in order to decouple the mechanisms responsible for the downstream evolution of ice rheology in the margins of Rutford Ice Stream (RIS), West Antarctica (Fig. 1). Our velocity data were derived from spatially and temporally dense synthetic aperture radar observations collected with COSMO-SkyMed, a constellation of four satellites operated by the Italian Space Agency. The data resolve the surface velocity in both RIS shear margins with unprecedented spatial resolution (~100 m) and small errors (< 2 cm d−1), allowing us to accurately calculate shear strain rates from the velocity gradients along more than 100 km of the RIS margins (Minchew and others, Reference Minchew, Simons, Riel and Milillo2017). These margins partially restrain the flow of RIS, an ~2-km-thick ice stream that flows at an average speed of ~1 m d−1 through a deep, relatively straight trough before draining into the Filchner-Ronne Ice Shelf (Fig. 1). The locations of the RIS shear margins are controlled by basal topography. The western margin abuts the Ellsworth Mountains – potentially resulting in an ice-on-rock interface (Doake and others, Reference Doake, Alley and Bindschadler2001; Fretwell and others, Reference Fretwell2013) – while the eastern margin is adjacent to the Fletcher Promontory, resulting in an ice-on-ice interface (Figs 1, 2). The relatively simple geometry of the trough and the control of topography on the margin position allows us to avoid the complexities inherent in understanding the locations of the margins in unconfined ice streams (e.g. Schoof, Reference Schoof2012; Perol and others, Reference Perol, Rice, Platt and Suckale2015).
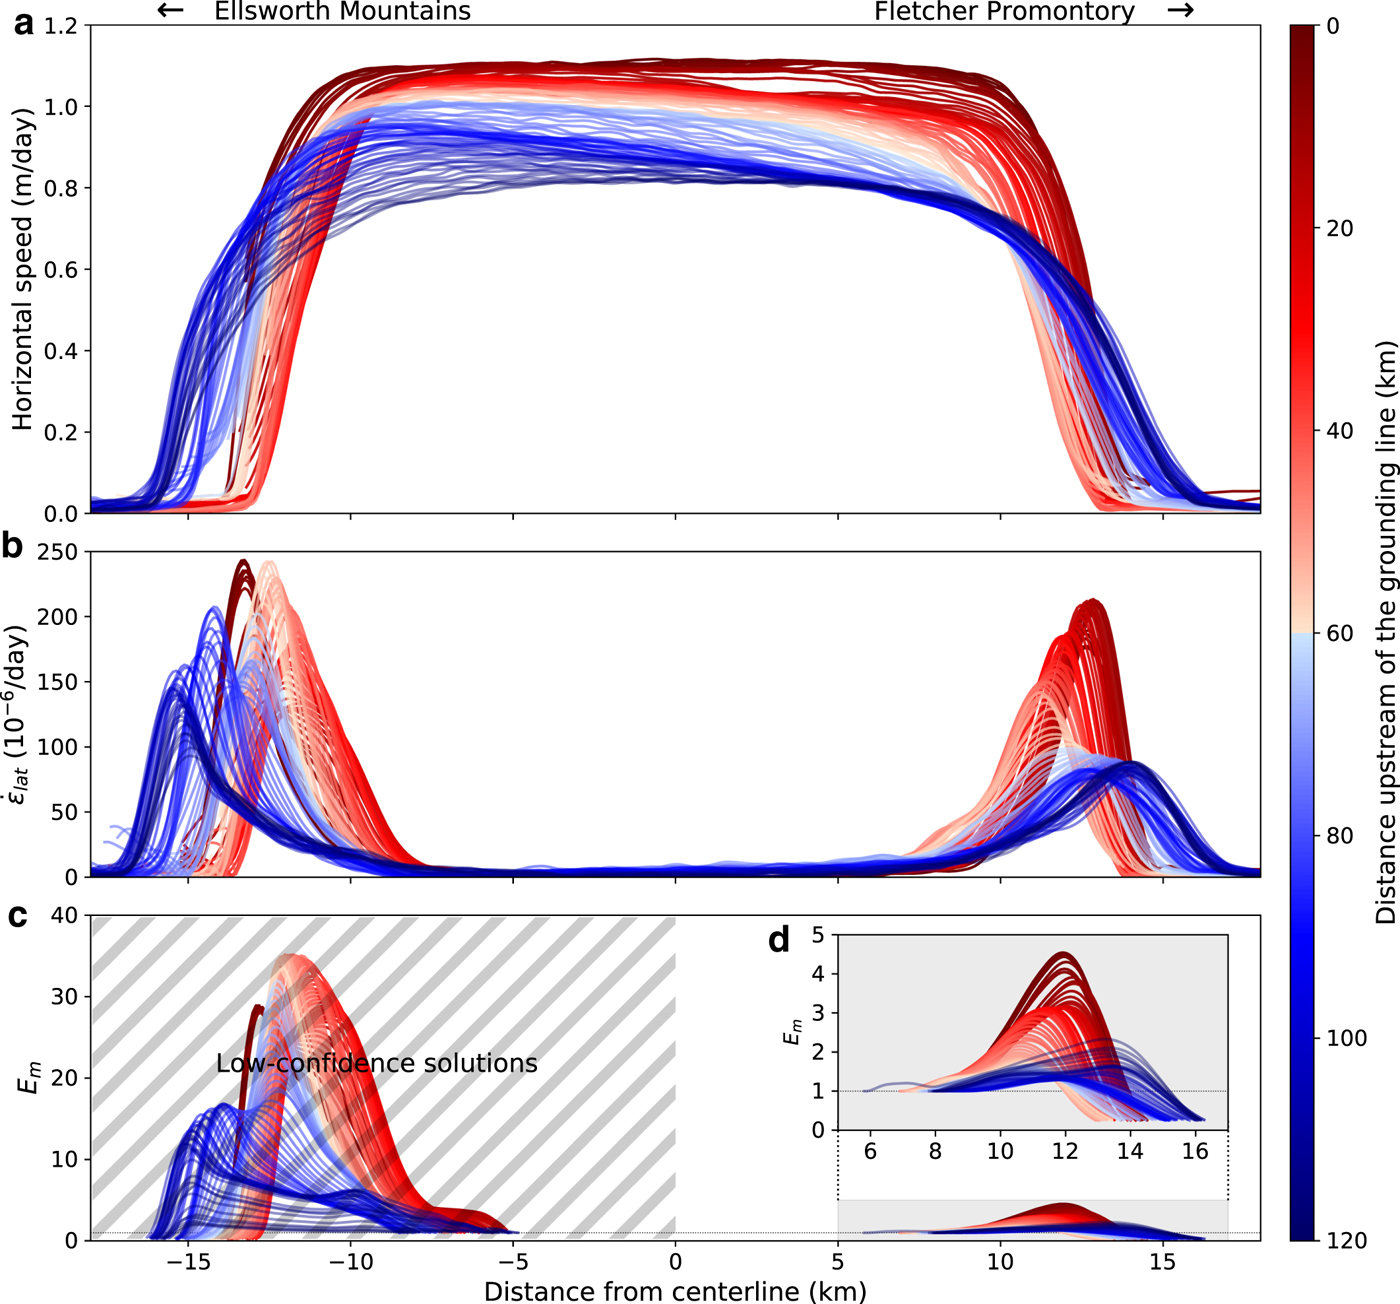
Fig. 2. Downstream variation in (a) observed horizontal surface speed, (b) lateral shear strain rate and (c, d) inferred values of E m ≡ E/E f along transects shown in Figure 1b. We have low confidence in the E m solutions in the Ellsworth margin (hatched region in panel c) because the local ice thickness is poorly constrained. Panel (d) shows a close-up view of E m in the Fletcher margin. We use the same color scheme for all panels and show it in map view in Figure 1b. In all panels, the ice flow direction is out of the page and from blue to red in the colormap. The Ellsworth Mountains are to the left and the Fletcher Promontory is to the right.
2. PHYSICAL MODELS
Glacier ice is an incompressible, non-Newtonian viscous fluid with a power-law rheology, commonly called Glen's flow law (Glen, Reference Glen1955; Goldsby and Kohlstedt, Reference Goldsby and Kohlstedt2001; Cuffey and Paterson, Reference Cuffey and Paterson2010). As indicated by observations of the strain rate tensor components on RIS (Minchew and others, Reference Minchew, Simons, Riel and Milillo2017, Figure S18), lateral shearing is the dominant deformation component in the shear margins of RIS and, therefore, the flow law can be approximated as (see appendix)
 $$ \dot{\varepsilon}_{{\rm lat}} \approx EA_0\tau_{{\rm lat}}^n, $$
where  $\dot {\varepsilon }_{{\rm lat}}$ is the lateral shear strain rate, τ lat is the lateral shear stress and A 0 is the reference rate factor for isotropic, undeformed glacier ice at T 0, the temperature of ice in the absence of shear heating. We prescribe n = 3, a value supported by laboratory experiments and field observations (Glen, Reference Glen1955; Budd and Jacka, Reference Budd and Jacka1989; Cuffey and Paterson, Reference Cuffey and Paterson2010).
In this study, we focus on E, the dimensionless, positive-valued total enhancement factor. For the purposes of this study, we consider depth-averaged values of E and A 0. The enhancement factor is a convenient parameterization to account for observed strain rates that are larger than would be expected for a given stress state and ice rheology determined only by A 0 and n = 3 (Echelmeyer and others, Reference Echelmeyer, Harrison, Larsen and Mitchell1994). Values of E greater than unity indicate net softening of the ice (i.e. lower viscosity for a given strain rate). We define E as the product of enhancement factors representing different ice properties
 $$ E = E_{\rm T} E_{\rm d} E_{\rm f}. $$
Each term in Eqn (2) corresponds to one or more mechanisms that influence ice rheology: the thermal enhancement factor E T represents internal heating and melting; the macroscopic-damage enhancement factor E d captures the influence of crevassing; and the fabric enhancement factor E f accounts for the combined effects of density, crystal size (texture), along-flow crystalline orientation (fabric), microscopic fractures and impurities like dust and sediment. We lump several mechanisms into E f because we cannot separate their individual contributions using available data. However, we will argue that crystallographic fabric is likely to be the dominant factor in E f, hence the moniker fabric enhancement factor. Fabric induces anisotropy in ice rheology, such that ice is softer in some stress directions and stiffer in others. Anisotropy is captured by the scalar fabric enhancement factor E f in the shear margins, where there is a single, dominant component of deformation (Hudleston, Reference Hudleston2015; Cuffey and Paterson, Reference Cuffey and Paterson2010). Note that including the thermal enhancement factor E T is a departure from the more traditional definition of E as representing properties of ice separate from temperature (Cuffey and others, Reference Cuffey2000a; Cuffey and Paterson, Reference Cuffey and Paterson2010). We make this adjustment to the definition of E because we are interested in the mechanisms that soften ice in shear margins and, therefore, wish to distinguish shear heating from other heat sources.
We use several physical models to decouple the mechanisms represented inEqn (2). We will detail each model, but the main ideas are as follows: we use a macroscopic damage model to constrain the maximum value of the damage enhancement factor E d, a thermomechanical model to infer the thermal enhancement factor E T, and an ice flow model to infer the total enhancement factor E absent the fabric enhancement factor E f. For convenience, we define  $E_{\rm m} \equiv E/E_{\rm f} = E_{\rm T}{\rm }E_{\rm d}$ to describe the enhancement factors in Eqn (2) that can be inferred with the ice flow model; for reasons we discuss later, we take E f to be approximately constant across the margins. The thermomechanical model accounts for shear heating, which influences E T and is sensitive to values of E f because softening due to fabric influences the viscous dissipation rate. Thus, we take E f to be the value that provides good agreement between inferred values of E m (from the ice flow model) and E TE d (from the thermomechanical and damage models, respectively).
2.1. Ice flow model
Following Echelmeyer and others (Reference Echelmeyer, Harrison, Larsen and Mitchell1994), we estimate the effective softening of ice in the shear margins E m ≡ E/E f = E TE d using the observed shear strain rates. In ice streams, it is generally the case that the flow is dominated by slip at the bed (e.g., Raymond, Reference Raymond1996). As a result, vertical shearing is negligible and we can apply the depth-integrated shallow-shelf approximation (SSA) to the linear momentum equations. When defined in a right-hand coordinate system – with x lying in the horizontal plane and parallel to the flow direction, y oriented across-flow in the horizontal plane and z is vertical and pointing downward – the momentum balance is given as
 $$\displaystyle{\partial \over {\partial x}}\left[ {h\left( {2\tau _{xx} + \tau _{yy}} \right)} \right] + \displaystyle{\partial \over {\partial y}}\left( {h\tau _{xy}} \right) + \tau _{\rm b} = \tau _{\rm d}$$
there τ ij are components of the deviatoric stress tensor, |τ xy| = τ lat, τ b is the basal shear traction, and τ d is the gravitational driving stress (MacAyeal, Reference MacAyeal1989, Reference MacAyeal1993). We use observed ice thickness h and ice-surface slope α (from Fretwell and others, Reference Fretwell2013) to calculate the gravitational driving stress τ d = ρ ighα, where ρ i is the density of ice and g is gravitational acceleration. We assume that when averaged along-flow over distances of order several ice-thicknesses, τ d and τ b covary across the flow such that  $\partial (\tau _{\rm {\rm b}}/\tau _{\rm d})/\partial y \approx 0$. We justify this assumption by noting that higher τ b leads to steeper surface slopes, resulting in higher τ d. Increases in τ b/τ d near the margins, which have been inferred in previous studies (Suckale and others, Reference Suckale, Platt, Perol and Rice2014; Perol and Rice, Reference Perol and Rice2015; Elsworth and Suckale, Reference Elsworth and Suckale2016), likely do not apply in our study area because the locations of RIS margins are controlled by the bed topography (Fig. 1). Applying these assumptions to Eqn (3) and neglecting the along-flow gradients of horizontal normal stresses (see Minchew and others, Reference Minchew, Simons, Riel and Milillo2017, Figure S18), the depth-averaged lateral shear stress is given as
 $$\tau _{{\rm lat}}(y) = \displaystyle{{1 - \tau _{\rm b}/\tau _{\rm d}} \over h}\int {\tau _{\rm d}} \;{\rm d}y,$$
where y = 0 along the centerline of the ice stream and we evaluate the integral subject to the boundary condition τ lat = 0 at y = 0. Applying the constitutive relation (Eqn (1)) and assuming that strain-rate is constant with depth (as in Echelmeyer and others, Reference Echelmeyer, Harrison, Larsen and Mitchell1994; Perol and Rice, Reference Perol and Rice2015), Eqn (4) can be rewritten as
 $$E_{\rm m} = \displaystyle{{{\dot \varepsilon }_{{\rm lat}}h^n} \over \theta }\left[ {\int {\tau _{\rm d}} \;{\rm d}y} \right]^{ - n},$$
where θ = E fA 0(1 − τ b/τ d)n contains only factors that are not observable and are invariant along y. Due to the lack of strain in the central trunk of the ice stream and the shear strain rate dependence of the processes represented by E m, we have the condition
 $$ \displaystyle \lim_{\dot{\varepsilon}_{{\rm lat}} \to 0} E_{\rm m} = 1.$$
 We solve for θ as the value that allows Eqn (5) to satisfy Eqn (6) as  $\dot {\varepsilon }_{{\rm lat}}$ becomes small within the ice stream trunk. Recalling that θ is constant along y, we then solve for the cross-flow profile of E m (cf. Echelmeyer and others, Reference Echelmeyer, Harrison, Larsen and Mitchell1994).
A key assumption in Eqn (5) is that E f is approximately uniform across-flow in the Fletcher margin. While taking E f to be uniform across the margins, without assuming a particular value, is simply a less restrictive variant of the common practice of prescribing a spatially constant value for E f (e.g., Jacobson and Raymond, Reference Jacobson and Raymond1998; Schoof, Reference Schoof2012; Suckale and others, Reference Suckale, Platt, Perol and Rice2014), we now further justify this assumption. Let us consider each mechanism in E f separately. First, it is reasonable to assume that horizontal gradients in density are negligible over spatial scales of order a few km (the width of the margins). Second, the absence of a spatially varying source of impurities in the Fletcher margin implies that the impurity content is likely to be approximately constant across the margin. Third, based on laboratory studies (Jacka, Reference Jacka1984; Jacka and Budd, Reference Jacka and Budd1989; Cuffey and Paterson, Reference Cuffey and Paterson2010), both crystal grain size and orientation should saturate under cumulative strains ε ~ 0.15, and a single-maximum fabric should form in simple shear under cumulative strains ε < 2 (Bouchez and Duval, Reference Bouchez and Duval1982; Jacka and Budd, Reference Jacka and Budd1989). Given upstream values of  $\dot {\varepsilon }_{{\rm lat}} \sim 10^{-4}$ d−1 and typical horizontal speeds in the shear margin ~0.4 m d−1 (Fig. 1), we expect the crystalline structure to evolve to near-steady-state within a few km downstream and to have single-maximum fabric in ~10 km. Because there are no significant along-flow changes in the orientation of the deformation field and shear strain is more concentrated (i.e. the margins narrow; see Fig. 1d) downstream, cumulative strains exceed the saturation threshold (ε ≫ 2) across the margin within our area of interest. Thus, we expect the crystalline structure to approximate a single-maximum fabric, with a preferred c-axis orientation parallel to the y-axis, across and along the margin within our study area. This expectation is consistent with our final results that suggest that there is a single preferred crystalline orientation.
A constant fabric type does not necessarily mean that E f is uniform across the margin because crystal size (i.e., texture) can influence rheology. Field observations show that the influence of crystal size on ice softness is small relative to the effect of fabric (Cuffey and others, Reference Cuffey2000a,Reference Cuffey, Thorsteinsson and Waddingtonb). Crystal size saturates under strains comparable with those of fabric saturation (Jacka, Reference Jacka1984; Jacka and Budd, Reference Jacka and Budd1989), which occur far upstream in our study area. Taken together, these arguments indicate that it is reasonable to assume that the effective fabric enhancement factor E f is approximately constant across the margins.
2.2. Damage model
To estimate E d, we adopt the continuum damage mechanics model of Borstad and others (Reference Borstad2012), who define the damage enhancement factor as
 $$ E_{\rm d} = \left(1 - a_{\rm d}\right)^{-n}, $$
where a d is a dimensionless damage parameter that represents the reduction in the effective load-bearing cross-sectional area (i.e. the ability of the material to withstand a load). Over a horizontal length scale ℓ > h, the characteristic length scale for stress transmission (Gudmundsson, Reference Gudmundsson2003), we expect some fraction of the ice λ to be crevassed. Therefore,
 $$a_{\rm d} = \lambda \displaystyle{d \over h},$$
where d is the maximum surface crevasse depth and λ ranges between 0 for undamaged ice and 1 for crevasses that extend uninterrupted over ℓ ≫ h. Based on observations (Vaughan, Reference Vaughan1993; Raymond and others, Reference Raymond, Echelmeyer, Whillans and Doake2001), we assume that λ < 0.5. Finally, when d/h ≪ 1, we note that Eqn (7) reduces to E d ≈ 1 + na d ≈ 1 + nλd/h.
The shear margins on RIS are extensively crevassed (Vaughan, Reference Vaughan1993; Doake and others, Reference Doake, Alley and Bindschadler2001). We expect surface crevassing to be the only important macroscopic damage mechanism in our study area because persistent basal crevasses predominantly exist only where ice is at or near floatation (Van der Veen, Reference Van der Veen1998a), which is not the case in our study area (Doake and others, Reference Doake, Alley and Bindschadler2001; Joughin and others, Reference Joughin2006). To estimate the maximum surface crevasse depth, d, we use the Nye model (Nye, Reference Nye1957), chosen because it is a simple damage model that provides plausible estimates of crevasse depth (Mottram and Benn, Reference Mottram and Benn2009). In the Nye model, d is the depth at which the tensile stress (mode I crack) is balanced by hydrostatic pressure, such that
 $$ 2\tau_{1} = \rho_igd, $$
where τ 1 is the principal tensile stress. Since our goal is to constrain the maximum crevasse depth, we neglect the fracture toughness of ice (Van der Veen, Reference Van der Veen1998b,Reference Van der Veena; Mottram and Benn, Reference Mottram and Benn2009), thereby allowing ice to fracture under any nonzero stress. We further note that crevassing in the RIS margins occurs in both tension and compression (Vaughan, Reference Vaughan1993) and that fractures can result from shearing (crack modes II and III). Therefore, we adopt the von Mises yield criteria and replace the tensile stress in the Nye model with the von Mises stress  $\tau _{\rm v} = \sqrt {3}\tau _{\rm e}$, where $\tau _{\rm e} = \sqrt {\tau _{ij}\tau _{ij}/2}$ is the effective deviatoric stress. From Glen's Law (Eqn (A1)), we find that $\tau _v = \sqrt {3}(\dot {\varepsilon }_e/(EA_0))^{1/n}$, where $\dot {\varepsilon }_e = \sqrt {\dot {\varepsilon }_{ij}\dot {\varepsilon }_{ij}/2}$ is the effective strain rate, $\dot {\varepsilon }_{ij}$ is the strain rate tensor and $\vert \dot {\varepsilon }_{xy}\vert = \dot {\varepsilon }_{{\rm lat}}$. When shearing is the dominant deformation regime, as it is on RIS (Minchew and others, Reference Minchew, Simons, Riel and Milillo2017), $\dot {\varepsilon }_{e} \approx \dot {\varepsilon }_{{\rm lat}}$, yielding the maximum crevasse depth
 $$d \approx \displaystyle{{2\sqrt 3 } \over {\rho _ig}}\left( {\displaystyle{{{\dot \varepsilon }_{{\rm lat}}} \over {EA_0}}} \right)^{1/n}.$$
To estimate the maximum crevasse depth d, and by extension maximum E d, we make two assumptions when calculating the values shown in Fig. 3c. First, we prescribe E = 1, noting that any value of E greater than unity would reduce E d by reducing d by a factor of E −1/n. In the results, we show that E d ≈ 1 even though we set E to unity in Eqn (10); we can expect the actual values for E d to be closer to unity, which strengthens our conclusion that macroscopic damage is negligible on RIS. Second, we take A 0 to be the value of A evaluated at the surface temperature T s using the Arrhenius relation discussed in the next section. By using surface temperature, we are not explicitly treating the possibility that cold-air ponding can decrease the air temperature in crevasses, thereby decreasing A 0 by a factor of ~3 (i.e., increasing d by a factor of 31/3 ≈ 1.4) for values taken in an ice stream shear margin on the Siple Coast, West Antarctica (Harrison and others, Reference Harrison, Echelmeyer and Larsen1998). For the small values we infer for d/h, ignoring the cold-air ponding effect introduces an error in E d of ~4%.
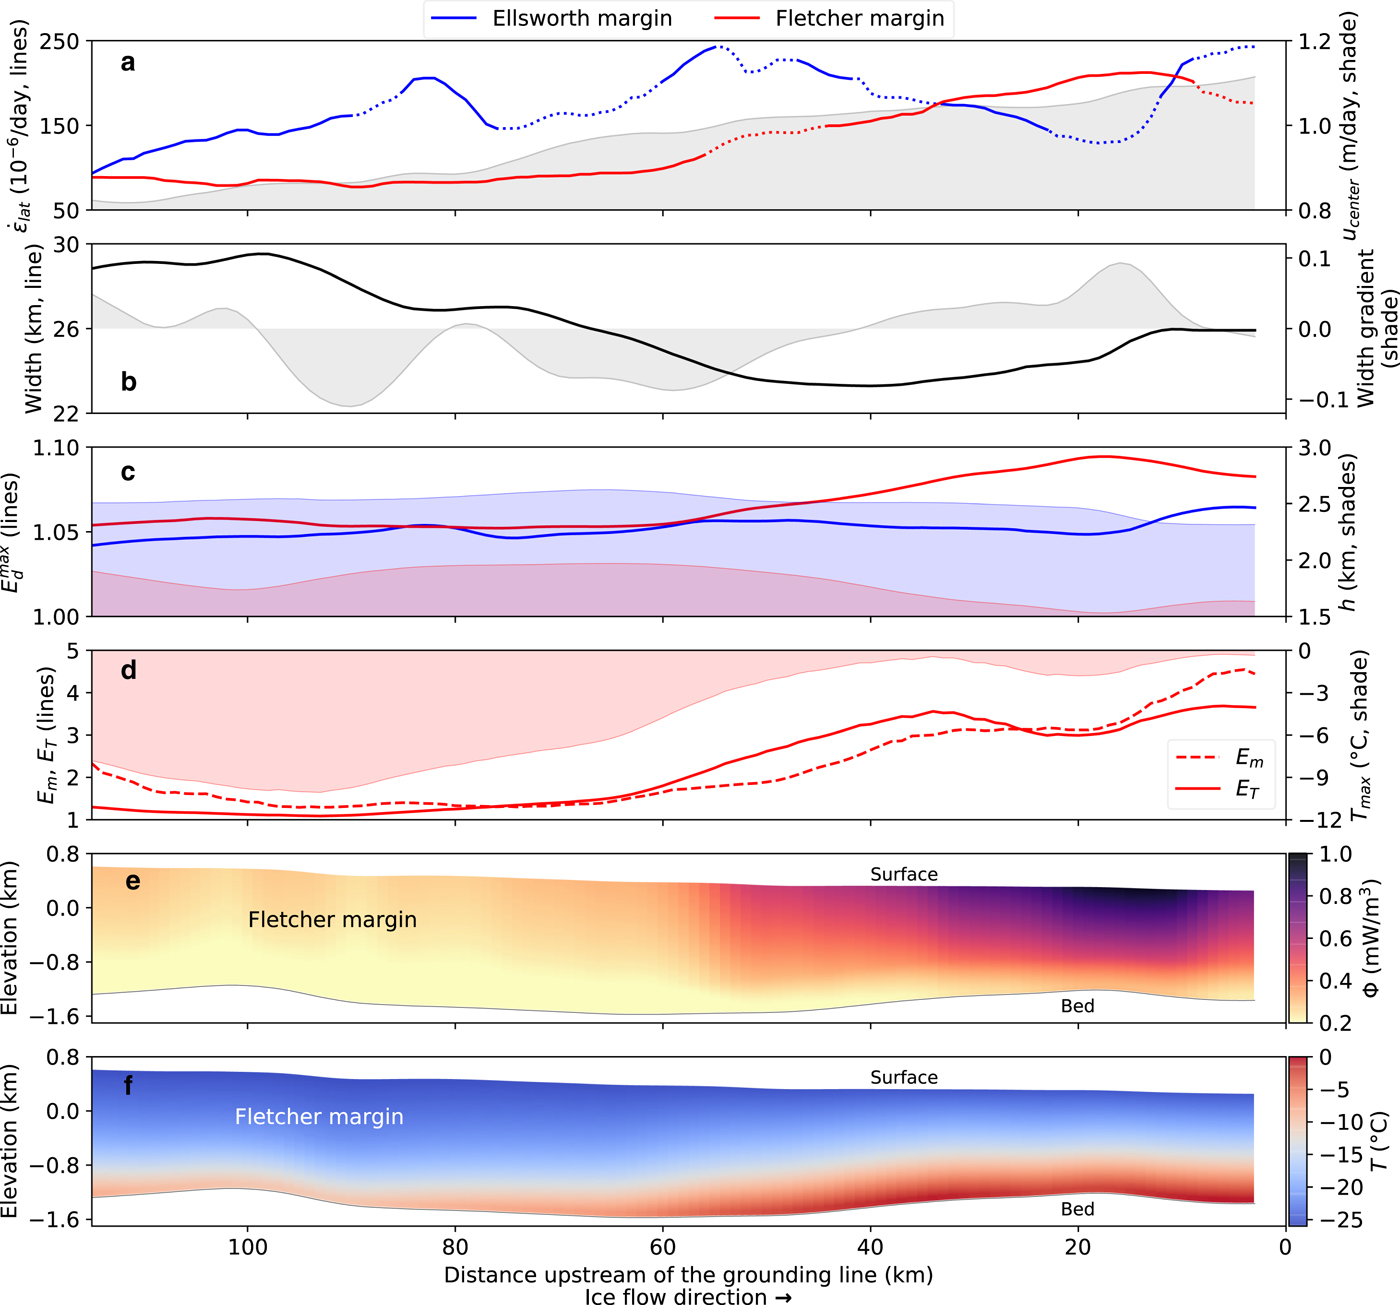
Fig. 3. Along-flow variations in the Ellsworth (blue) and Fletcher (red) margins of RIS. (a) Lateral shear strain rates (lines) and horizontal speed along the centerline (gray shade). Dashed line segments occur where tributary glaciers intersect RIS (Fig. 1b). (b) Total RIS width (black line) and along-flow gradient of width (gray shade). We define width to be the distance between strain-rate maxima in each margin (Fig. 2b). (c) Maximum macroscopic-damage enhancement factor  $E_{{\rm d}}^{{\rm max}}$ (lines) and ice thickness h in the margins (shaded regions). (d) Thermal, E T, (solid line) and margin, E m, (dashed line) enhancement factors overlaying inferred maximum (basal) ice temperature (shaded region). All values for E T and T are calculated using E fA * = 18 (see Table 1 for A * values). (e) Steady-state rates of shear heating, Φ, and (f) ice temperature with elevation defined relative to mean sea level. For reference, 1 mW/m3 ≈ 16.7 × 10⁻³ °C a−1, using values given in Table 1. We show only the Fletcher margin in (d–f) because ice thickness is poorly constrained in the Ellsworth margin.
2.3. Thermomechanical model
The softness of ice depends on temperature T(z) and water content ϕ(z), where ϕ is the porosity in temperate ice and we have assumed that pore spaces will be saturated (Meyer and Hewitt, Reference Meyer and Hewitt2017). Both temperature and water content are depth-dependent; we combine their effects and average over depth to get E T. Taking ice softness to be a function of local ice temperature, the depth-averaged thermal enhancement factor E T is given as
 $$E_{\rm T} = \displaystyle{1 \over h}\int_0^h {E_{\rm w}\displaystyle{{A_{\rm T}} \over {A_0}}{\rm d}z} .$$
The enhancement factor due to liquid water content E w = E w(ϕ(z)) can be approximated as (Duval, Reference Duval1977; Lliboutry and Duval, Reference Lliboutry and Duval1985; Cuffey and Paterson, Reference Cuffey and Paterson2010)
 $$ E_{\rm w} = 1 + 200\phi $$
and accounts for lubrication of the ice crystals by interstitial water content. The temperature-dependent rate factor A T = A T(T(z)) can be empirically represented by an Arrhenius relation defined as
 $$A_{\rm T} = A_\ast\exp \left\{ {{\rm - }\displaystyle{{Q_c} \over R}\left( {\displaystyle{1 \over {T_*}} - \displaystyle{1 \over T}} \right)} \right\},$$
where R is the ideal gas constant, A * is the value of A for isotropic and undeformed ice at T = T *,
 $$Q_c = \left\{ {\matrix{ {Q_c^ - } & {{\rm if}} & {T < T_*} \cr {Q_c^ + } & {{\rm if}} & {T_* \le T \le T_{\rm m}} \cr } } \right.$$
is the activation energy, T * is the temperature at which Q c changes value and T m is the melting temperature of ice, which we take to be independent of depth (further details in Cuffey and Paterson, Reference Cuffey and Paterson2010, §3.4.6). All parameter values are given Table 1 and we note that we use a range of values for A * based on studies conducted near RIS (Macayeal and others, Reference Macayeal, Rignot and Hulbe1998; Cuffey and Paterson, Reference Cuffey and Paterson2010).
The strong dependence of E T on temperature and water content means that shear heating plays an important role in setting the rheology of ice in areas with high shear strain rates. Shear heating arises from viscous dissipation, the irreversible conversion of kinetic energy to heat that occurs when a viscous fluid deforms. When ice is below the melting temperature, shear heating warms the ice, causing the ice to soften (increase E T). When ice is temperate, it is a mixture of ice and water that is at the melting temperature. Ice remains viscous even at its melting temperature and thus temperate ice generates heat when deformed. This heat melts the ice, thereby increasing the interstitial water content and further softening the ice (increasing E T) by allowing individual crystals to slip along their boundaries with less friction (Duval, Reference Duval1977; Lliboutry and Duval, Reference Lliboutry and Duval1985).
To estimate the depth-dependent temperature and meltwater production and transport, we adopt the model of Schoof and Hewitt (Reference Schoof and Hewitt2016). This model is capable of capturing the transition from cold to temperate ice along with the production of meltwater in temperate ice. The model includes advection, diffusion, shear heating as an internal heat source, meltwater production and meltwater transport that adheres to Darcy's Law. We solve the model in one vertical dimension (1-D), listing all parameter values in Table 1. In the Results section, we show that a temperate zone is unlikely to exist in our study area, meaning that the melt rate  $\dot {m} = 0$, ϕ = 0 and E w = 1 everywhere. In the following derivation, we retain the model terms related to meltwater production and ice softening due to water content for completeness but discuss only the salient features of the model for brevity. A more detailed summary of the model can be found in Hewitt and Schoof (Reference Hewitt and Schoof2017).
We focus our analysis on the Fletcher shear margin, where we can make some simplifications to the energy balance. First, by considering observed ice thickness and surface slope, we estimate rates of lateral advection of cold ice into the margin from outside the ice stream to be u y ≪ 0.1 m a−1. This advection rate was found by Suckale and others (Reference Suckale, Platt, Perol and Rice2014) to have a negligible influence on thermomechanical effects in a shear margin with values of shear strain rate and ice thickness comparable with the Fletcher margin. Thus, we neglect lateral advection of cold ice into the margins. Second, in line with numerous studies of deformation-induced heating in lateral shear margins (e.g., Echelmeyer and others, Reference Echelmeyer, Harrison, Larsen and Mitchell1994; Jacobson and Raymond, Reference Jacobson and Raymond1998; Schoof, Reference Schoof2004, Reference Schoof2012; Perol and Rice, Reference Perol and Rice2015; Suckale and others, Reference Suckale, Platt, Perol and Rice2014), we also neglect along-flow advection and provide further justification for this assumption in the discussion section. Then, by considering only vertical diffusion (Schoof and Hewitt, Reference Schoof and Hewitt2013), we can express the reduced form of energy conservation as
 $$\rho _ic_{\rm p}\left( {\displaystyle{{\partial T} \over {\partial t}} + u_z\displaystyle{{\partial T} \over {\partial z}}} \right) = k\displaystyle{{\partial ^2T} \over {\partial z^2}} + \Phi - \rho _{\rm w}{\rm {\cal L}}\dot m,$$
where T is the ice temperature, Φ is the viscous dissipation function, c p is the specific heat capacity of ice, k is the spatially constant thermal conductivity of ice, ρ w is the mass density of meltwater,  ${\cal {L}}$ is the specific latent heat of fusion and $\dot {m}$ is the melt rate. We adopt the common assumption that the downward advection of ice is linearly dependent on depth and snow accumulation rate, with maximum values at the surface and zero at the bed such that
 $$u_z = \dot s\left( {1 - \displaystyle{z \over h}} \right),$$
where  $\dot {s}$ is the surface accumulation rate (Clarke and others, Reference Clarke, Nitsan and Paterson1977; Echelmeyer and others, Reference Echelmeyer, Harrison, Larsen and Mitchell1994; Perol and Rice, Reference Perol and Rice2015). Based on the results of a regional climate model (van Wessem and others, Reference van Wessem2014), we take the surface accumulation rate to be spatially constant.
In areas where lateral shearing is the dominant component of deformation, the depth-dependent rate of shear heating is
 $$\eqalign{\Phi & = {\dot \varepsilon }_{ij}\sigma _{ij} \cr & \approx 2{\dot \varepsilon }_{{\rm lat}}\tau _{{\rm lat}} \cr & \approx 2\left( {\displaystyle{{\dot \varepsilon _{{\rm lat}}^{n + 1} } \over {E_{\rm f}E_{\rm d}E_{\rm w}A_{\rm T}}}} \right)^{1/n},} $$
where σ ij is the Cauchy stress tensor. We drive the model in Eqns (15)–(17) to steady state using a forward Euler, finite-volume method, subject to the boundary conditions:
 $$T = T_{\rm s}\quad {\rm at}\quad z = 0,$$
 $$ - k\displaystyle{{\partial T} \over {\partial z}} = q_{{\rm geo}}\quad {\rm at}\quad z = h,$$
where T s is the surface temperature taken from measurements collected in shallow boreholes (Doake and others, Reference Doake, Alley and Bindschadler2001), and q geo is the geothermal heat flux taken from borehole measurements collected on the Fletcher Promontory (R. Mulvaney, personal communication). We take T s and q geo to be spatially constant.
To solve for  $\dot {m}$ and ϕ, the model needs to account for the production and drainage of meltwater in a temperate zone as well as changes to the basal boundary condition (Eqn (19)). In a steady-state temperate zone, the ice is at the melting temperature throughout and the rate of meltwater production balances the viscous dissipation rate such that $\dot {m} = \Phi /(\rho _{\rm w}{{\cal L}})$ from Eqn (15). To capture the transition from cold to temperate ice, the model utilizes an enthalpy formulation and Darcy's Law is applied to calculate drainage within a temperate zone. However, our results indicate that T < T m within our study area, meaning that there is no temperate ice zone and $\dot {m} = 0$, ϕ = 0, and E w = 1 everywhere. Thus, in the interest of brevity, we end here the derivation of the thermomechanical model as the details of the enthalpy formulation and the drainage model are not germane to this study. The enthalpy formulation and applications of Darcy's Law are derived by Schoof and Hewitt (Reference Schoof and Hewitt2016) and further discussed by Hewitt and Schoof (Reference Hewitt and Schoof2017). As these authors show, when the temperature remains below the melting temperature, the enthalpy formulation reduces to Eqn (15) with $\dot {m}=0$.
3. OBSERVATIONAL DATA
We use previously published data that are publicly available through their respective publications. Data on ice geometry are from Fretwell and others (Reference Fretwell2013) and the velocity fields are from Minchew and others (Reference Minchew, Simons, Riel and Milillo2017). Building on methods developed for airborne interferometric synthetic aperture radar observations (Minchew and others, Reference Minchew, Simons, Hensley, Björnsson and Pálsson2015, Reference Minchew2016), the velocity fields used in this study were derived from synthetic aperture radar data collected from ascending and descending orbits along 32 unique flight tracks with COSMO-SkyMed, a 4-satellite constellation operated by the Italian Space Agency. These data span ~9 months and yielded 1644 correlated displacement fields over RIS. All displacement fields have ~100 m spatial resolution and were stacked to allow for inferences of the 3-D, time-dependent velocity fields (Minchew and others, Reference Minchew, Simons, Riel and Milillo2017). Here, we utilize the horizontal secular (time-averaged) velocity fields.
We extracted data along 112 transects that are orthogonal to the ice flow direction, span the entire ice stream width and are spaced 1 km apart as measured along the local flow vector (Fig. 1a). The most downstream transect is ~3 km upstream of the point where RIS first crosses the grounding line (GL) (i.e. the inland extent of the GL). We limit our region of interest to <120 km upstream of the GL to stay within the region with the highest data quality (Minchew and others, Reference Minchew, Simons, Riel and Milillo2017). From the transects of horizontal speed, we calculated the lateral shear strain rates by using a second-order Savitzky--Golay filter and a 2 km (≈ h) window. The Savitzky--Golay filter is an efficient method for fitting piecewise polynomials of a given order within a window of given size.
4. RESULTS AND DISCUSSION
All of the mechanisms represented by the various enhancement factors in Eqn (2) can be influenced by bed topography because of their dependence on cumulative strain and strain rate. RIS flows through a well-defined subglacial trough (Fig. 1). As the ice flows, it is squeezed between highs in the bed topography on either side (Figs 1c and 2). Taking RIS width to be the cross-stream distance between maximum shear strain rates in each margin, we can see that RIS narrows by ~6 km (≈25% of the total width) in the downstream direction between 120 and 40 km upstream of the GL (UGL), where the GL is the boundary between grounded and floating ice. In the final 40 km UGL, RIS widens by ~3 km (Fig. 3b). Along the Ellsworth margin, the encroachment of the Ellsworth Mountains into the path of the flow causes the ice to be compressed against the mountains, leading to variations in both amplitude and cross-stream position of maximum shear strain rates (Figs 2b and 3a). In the Fletcher Margin, shear strain rates increase as the ice stream slowly widens and flow accelerates following the encroachment of the Fletcher Promontory at ~60 km UGL (Figs 1c and 2b). The result is a roughly monotonic increase in shear strain rates in the Fletcher margin for ~50 km (Fig. 3a).
We use the observed strain rates to infer E m for each data transect using Eqn (5) (Figs 2c–d). The shapes of the inferred E m profiles reflect the shapes of the strain rate profiles (Fig. 2c), with maximum values of E m generally increasing downstream. In the Fletcher margin, the most substantial changes in ice rheology begin ~60 km UGL, coincident with increases in shear strain rate (Fig. 3). Recalling that E m ≡ E/E f, these results indicate continuous softening of ice in the Fletcher margin from E ≈ 1.25E f to a maximum of E ≈ 4.5E f near the GL. In the Ellsworth margin, where we have low confidence in inferred E m values due to the poor constraints on ice thickness, E could be as much as 5–10 times larger than in the Fletcher margin (Figs 2c) owing to the likelihood that the ice in the Ellsworth margin is hundreds of meters thicker than ice in the Fletcher margin (Fig. 3c). The relationship between ice thickness and E m can be seen in Eqn (5), which indicates that, for given values of  $\dot {\varepsilon }_{{\rm lat}}$, E m ∝ h n.
Shearing in the margins causes extensive surface crevassing that is apparent as light-colored bands in the radar backscatter amplitude image (Fig. 1a) and from field observations (Vaughan, Reference Vaughan1993). Our calculations of d (Eqn (10)) from the observed strain rates indicate that d < 100 m and d/h < 0.06 along both margins, where h is the local ice thickness (Fig. 3c). To estimate the maximum damage enhancement factor  $E_{{\rm d}}^{{\rm max}}$ (Eqn (7)), we prescribe the maximum value of a d = 0.5d/h and find that $1 \le E_{\rm d} \le E_{{\rm d}}^{{\rm max}} < 1.1$ with a mean along-flow value of $\bar {E}_{{\rm d}}^{{\rm max}} \approx 1.05$ (Fig. 3c). These results suggest that damage plays a negligible role in the evolution of ice rheology along both RIS margins. Given the shallow depths of surface crevasses relative to the ice thickness, the conclusion that damage has a negligible influence on ice rheology should apply to the grounded portions of most of the major outlet glaciers and ice streams in Antarctica (cf., Suckale and others, Reference Suckale, Platt, Perol and Rice2014).
The key to decoupling the thermal (E T) and fabric (E f) enhancement factors is in the viscous dissipation function Φ (Eqn (17) and Fig. 3e). Lateral shearing is dominant in the RIS margins, so the rate of deformation heating is proportional to the product of lateral shear stress and strain rate. After applying the flow law (Eqn (1)), it becomes clear that the rate of shear heating depends on all of the rheological mechanisms described by the total enhancement factor E (see Eqn (17)). Softening of ice caused by the development of crystallographic fabric (increasing E f), reduces the work rate needed to deform the ice at the observed rates. As a result, the rate of shear heating decreases as E f increases, which influences the temperature profile in the ice, resulting in smaller values of the thermal enhancement factor E T for a given strain rate. The dependence of shear heating on E f, combined with the fact that we independently infer E m = E dE T from an ice flow model (Eqn (5)), allows us to infer E f. Because damage has a negligible influence on ice rheology, E d ≈ 1 and E m ≈ E T. Only the values of thermal enhancement factor E T calculated from the thermomechanical model (Eqn (11)) have a direct dependence on fabric (E f), via the dissipation function Φ (Eqn (17)); inferred values of E m do not depend on E f. Thus, we take E f to be the value that minimizes the difference between E m, inferred from the ice flow model (Eqn (5)), and E T, inferred from the thermomechanical model (Eqn (11)) at the location of maximum shear strain rate along each transect in the Fletcher margin, where ice thickness is well-constrained. We find that 6 ≤ E f ≤ 10 for a range of reasonable values for other rheological parameters (Table 1). This range of E f values is consistent with laboratory measurements of single-maximum fabric (cf. Hudleston, Reference Hudleston2015, Figure 3) and provides good agreement between E m and E T along the length of study area (solid and dashed lines in Fig. 3d).
The temperature (Figs 3f and 4) and dissipation function profiles (Fig. 3e) inferred from the 1-D thermomechanical model provide a useful basis for discussing our assumption that along-flow advection is negligible in the shear margins. Temperature increases with depth and with along-flow distance at a given depth. As a result, along-flow advection will transport relatively cold ice to a given location. Colder ice is stiffer (i.e., A T will increase), which drives an increase in the rate of shear heating that acts to offset the effects of along-flow advection and to diminish the local along-flow temperature gradient. Thus, we expect the dominant terms in the energy balance to be vertical advection and viscous dissipation, which are captured by our 1-D steady-state model. Furthermore, values of E m and E T, which are derived from independent models, are in good agreement in the along-flow direction, thereby supporting our assumption of negligible along-flow advection.
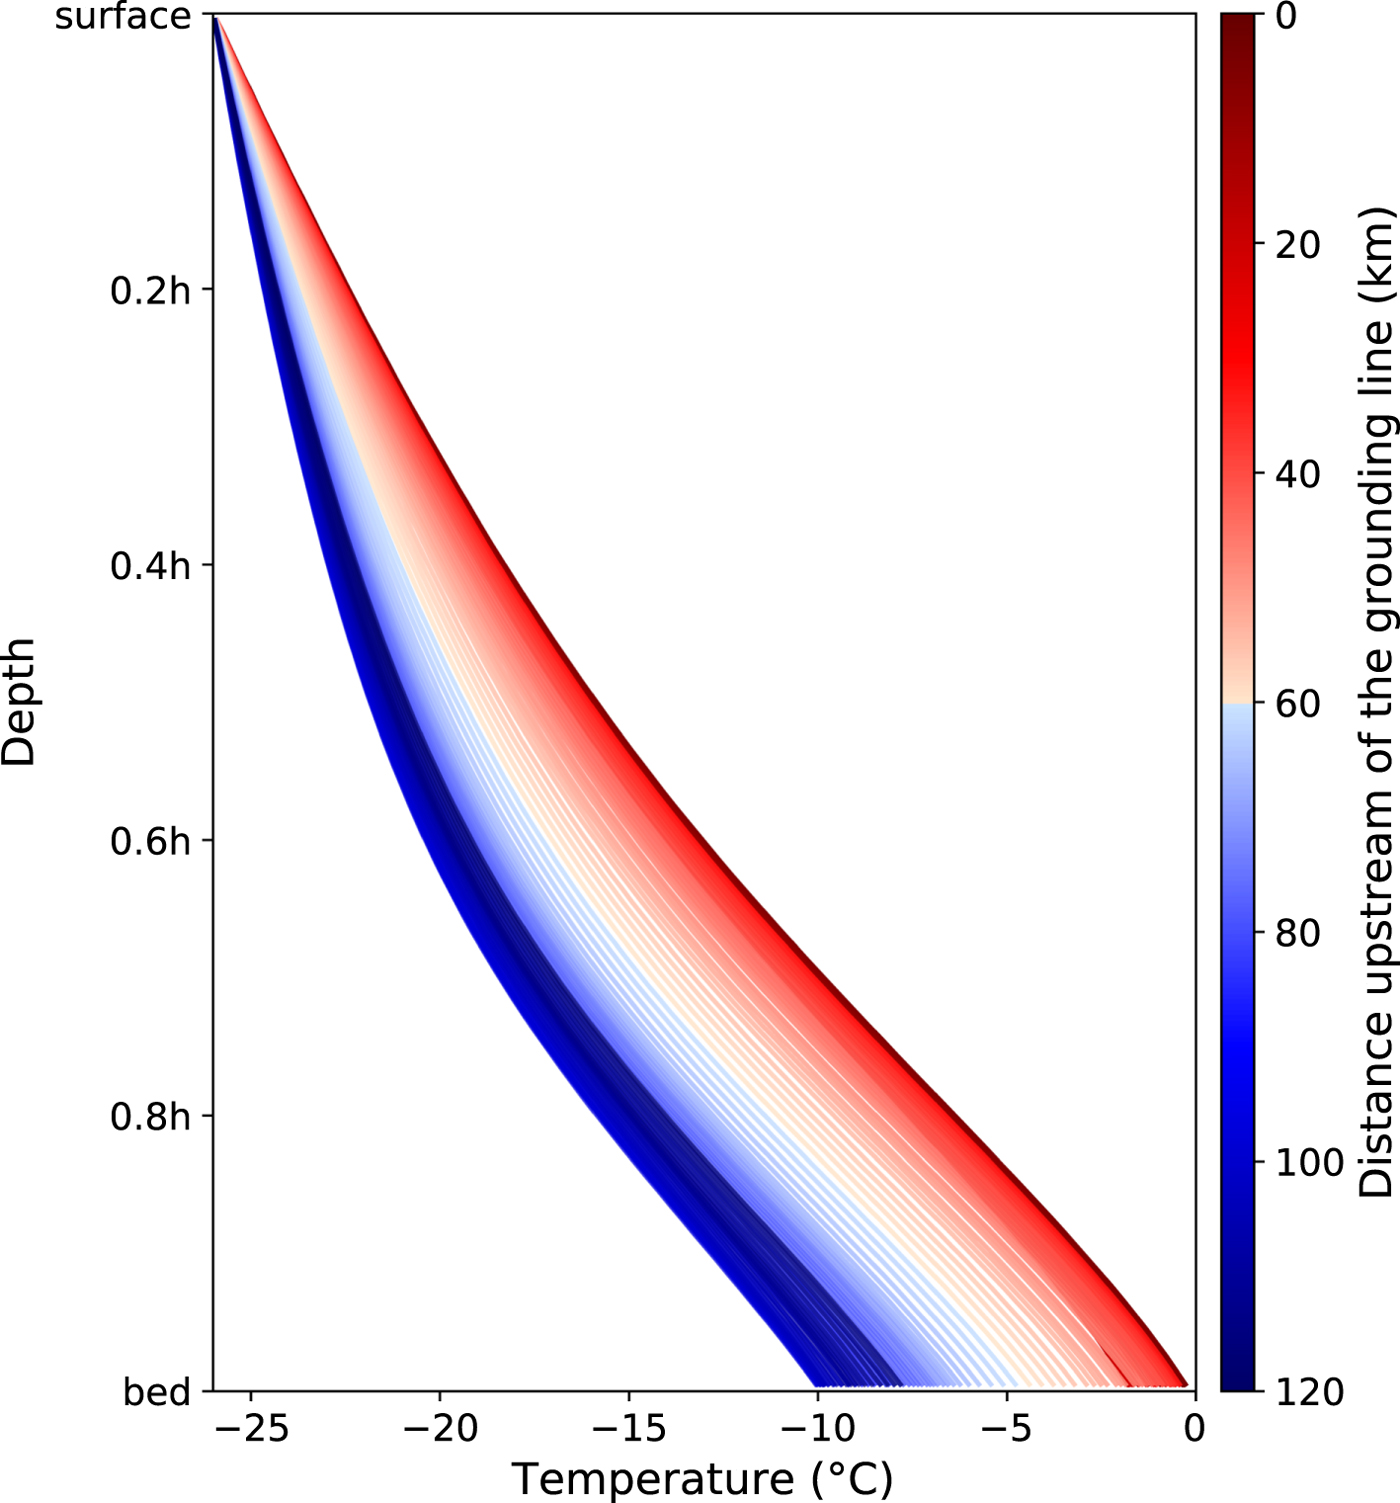
Fig. 4. Inferred vertical temperature profile in the Fletcher margin for transects shown in Fig. 1b. The vertical dimension is given as a function of ice thickness h, and the color scheme is the same as in Figs 1b and 2. Maximum values correspond to values shown in Fig. 3d and the profiles are the same as in Fig. 3e. The surface temperature is set to the mean annual atmospheric temperature of −26°C (Doake and others, Reference Doake, Alley and Bindschadler2001).
The along-margin agreement between E m and E T for a single value of E f indicates that E f remains approximately constant downstream. This conclusion is consistent with laboratory observations that show that fabric saturates under cumulative strain values (ε ~ 0.15) that are reached in the RIS margins within a few kilometers of the onset of flow (Jacka and Budd, Reference Jacka and Budd1989). Deformation in the Fletcher margin is consistent with simple shear (Minchew and others, Reference Minchew, Simons, Riel and Milillo2017), which can lead to the formation of multiple-maximum fabric, like that observed by Jackson and Kamb (Reference Jackson and Kamb1997) in the shear margin of a different ice stream, when crystals rotate and dynamically recrystallize under strains ε < 1 (Jacka and Budd, Reference Jacka and Budd1989; Cuffey and Paterson, Reference Cuffey and Paterson2010). Laboratory experiments show that under higher strains (ε > 2), crystal rotation weakens the second maximum, potentially to the point of vanishing, and causes the fabric to tend toward a single maximum (Bouchez and Duval, Reference Bouchez and Duval1982; Jacka and Budd, Reference Jacka and Budd1989; Cuffey and Paterson, Reference Cuffey and Paterson2010). For values of observed  $\dot {\varepsilon }_{lat} \sim 10^{-4}$ d−1 and typical horizontal speeds in the shear margin ~0.4 m d−1 (Figs 1 and 2), we expect strains ε > 2 within ~10 km of streaming flow, supporting our inference of E f values consistent with a single-maximum fabric.
Of all the mechanisms accounted for in the fabric enhancement factor E f, we propose that the development of crystallographic fabric is dominant in the Fletcher margin. Several lines of evidence support this hypothesis. Perhaps most notably is that our inferred range of 6 ≤ E f ≤ 10 is consistent with laboratory measurements (e.g., Hudleston, Reference Hudleston2015) and field observations on RIS (Smith and others, Reference Smith2017) of crystallographic fabric. Furthermore, the Fletcher margin has an ice-on-ice interface with no significant source of sediment or other impurities, and the influence of density and grain size variations on ice rheology is negligible below the depth of the firn layer (Budd and Jacka, Reference Budd and Jacka1989; Cuffey and Paterson, Reference Cuffey and Paterson2010), which is ~10% of the thickness of RIS (Smith and others, Reference Smith2017). As a result, density variations should have a negligible influence, rendering crystalline structure as the dominant mechanism in E f.
If the strength of fabric (E f) is constant along the margin and the influence of damage is negligible, then shear heating is the only mechanism that can drive variations in ice rheology over mesoscales (spatial scales of order tens of kilometers). The general along-flow trend in temperature is reflected in both the thermal (E T) and margin (E m) enhancement factors (Figs 3d–3f), indicating that shear heating is the primary mechanism for the mesoscale evolution of ice rheology within 100 km UGL. Inferred maximum temperatures, T max, are located at the bed and generally increase as a function of distance downstream (Figs 3d, 3f, and 4). The vertical temperature profile retains the same general shape along the margin (Perol and Rice, Reference Perol and Rice2015) and is skewed toward warmer temperatures closer to the GL, reflecting increases in the maximum temperature caused by higher rates of shear heating (Fig. 4). Within 60 km UGL, maximum temperatures increase by ~6°C and approach the melting temperature near the GL. Our results indicate that there is no significant meltwater production nor zone of temperate ice on RIS, though we note that these results apply only within the Fletcher margin and that basal temperatures within the trunk of RIS are likely at the melting temperature (Doake and others, Reference Doake, Alley and Bindschadler2001). Due to the lack of a temperate zone within the margin, temperature changes and fabric are the dominant mechanisms influencing ice rheology over short (~10 km) and long (~100 km) spatial scales, respectively.
The dominance of shear heating in driving mesoscale variations in ice rheology illuminates a positive, thermomechanical feedback in glaciers with topographically controlled widths. Glaciers can accelerate for a variety of reasons, such as subglacial hydrological feedbacks (e.g., Robel and others, Reference Robel, DeGiuli, Schoof and Tziperman2013, Reference Robel, Schoof and Tziperman2014) or reductions in buttressing stresses that can occur when ice shelves collapse or are thinned by warm ocean water (Scambos and others, Reference Scambos, Bohlander, Shuman and Skvarca2004; Dupont and Alley, Reference Dupont and Alley2005; Joughin and others, Reference Joughin, Alley and Holland2012; Mouginot and others, Reference Mouginot, Rignot and Scheuchl2014). Faster flow speeds will generate higher shear strain rates in the margins, leading to enhanced shear heating (softer ice) and further accelerations. This feedback is related to thermoviscous processes that have been studied in ice streams with near-planar bed geometries (Jacobson and Raymond, Reference Jacobson and Raymond1998; Schoof, Reference Schoof2012), and invoked to explain the formation of laterally unconfined ice streams via creep (Robin, Reference Robin1955; Clarke and others, Reference Clarke, Nitsan and Paterson1977) and fingering instabilities (e.g., Payne and others, Reference Payne2000; Hindmarsh, Reference Hindmarsh2004, Reference Hindmarsh2006, Reference Hindmarsh2009; Brinkerhoff and Johnson, Reference Brinkerhoff and Johnson2015). Some of the work on thermoviscous instabilities has focused on the ice near the bed (e.g., Clarke and others, Reference Clarke, Nitsan and Paterson1977; Fowler and others, Reference Fowler, Toja and Vazquez2009), but the fundamental mechanisms are the same as for shear margins. And though thermoviscous instabilities have been discounted as a candidate surge mechanism in mountain glaciers (e.g., Fowler and others, Reference Fowler, Toja and Vazquez2009), the potential for thermal runaway through viscous dissipation in laterally confined ice streams is, to our knowledge, an unexplored question, and one that could have important ramifications for future projections of sea-level rise. Our results indicate that thermoviscous feedbacks are an important mechanism in the evolution of glaciers flowing through bedrock channels and their response to changes at the ice/ocean interface (e.g., Joughin and others, Reference Joughin, Smith and Medley2014). Furthermore, our results indicate that thermoviscous effects help explain the downstream evolution of the velocity profile, from a plane Poiseuille flow upstream to a horizontal plug flow near the grounding zone (Pearson, Reference Pearson1977; Ockendon, Reference Ockendon1979), as seen in Fig. 2a. Since glacier flow governs the rate of mass loss from the Antarctic and Greenland ice sheets, this thermomechanical feedback could play a key role in the evolution of continental ice sheets.
5. CONCLUSION
We developed a new approach for using state-of-the-art remote-sensing data to understand the fundamental mechanisms that drive the spatial evolution of ice rheology in glacier shear margins. The broad spatial coverage, fine resolution and low noise provided by the data allowed us to decouple, for the first time, the influence of all known, prominent mechanisms that drive the evolution of ice rheology: the development of crystalline fabric, fracturing and heating. In our study area, and likely most Antarctic ice stream shear margins, surface crevassing plays a negligible role in the evolution of ice rheology because surface crevasses are shallow relative to the depth of the ice column. The crystalline fabric has a significant influence on ice rheology – softening the ice by approximately an order of magnitude – but evolves to steady state within a few kilometers of the onset of streaming ice flow. Shear heating drives mesoscale evolution of ice rheology in the shear margins. Though we do not infer the existence of temperate ice in our study area, the importance of shear heating to ice rheology will be important in areas where temperate ice is present because interstitial liquid water has a pronounced softening effect on the ice. The importance of shear heating in driving along-flow variations in ice rheology highlights the potential for a thermomechanical feedback in glaciers that flow through bedrock channels – wherein faster ice flow softens ice through shear heating – that likely plays a role in ice-sheet evolution.
ACKNOWLEDGMENTS
We thank Carlos Martin, Robert Arthern, Jenny Suckale, Cooper Elsworth and James Rice for insightful conversations. We also thank two anonymous reviewers for helpful comments. B.M.M. was funded by an NSF Earth Sciences Postdoctoral Fellowship award EAR-1452587. C.R.M. was supported by an NSF Graduate Research Fellowship, award DGE-1144152 and a David Crighton Fellowship. A.A.R. was funded through a NOAA Climate & Global Change Postdoctoral Fellowship and the Caltech Stanback Postdoctoral Fellowship.
APPENDIX: GLEN'S LAW
The constitutive relation for ice (Eq. 1) is commonly given in terms of effective stress and strain rate such that (Glen, Reference Glen1955; Cuffey and Paterson, Reference Cuffey and Paterson2010)
 $$ \dot{\varepsilon}_e = EA_0\tau_e^n,$$
where  $\dot {\varepsilon }_e = \sqrt {\dot {\varepsilon }_{ij}\dot {\varepsilon }_{ij}/2}$ (in summation notation) is the square root of the second invariant of the strain rate tensor $\dot {\bi \varepsilon }$, known as the effective strain rate, and $\tau _{\rm e} = \sqrt {\tau _{ij}\tau _{ij}/2}$ is the square root of the second invariant of the deviatoric stress tensor $ \bi \tau $, known as effective stress. To understand the relative contribution of each term in the strain rate tensor, we define a right-hand coordinate system oriented such that x is along the flow vector, y points across flow in the horizontal plane, and z points down. When shearing is dominant, as it is everywhere in our study area (Minchew and others, Reference Minchew, Simons, Riel and Milillo2017), $\dot {\varepsilon }_{\rm e} \approx \dot {\varepsilon }_{{\rm lat}}$, where $\dot {\varepsilon }_{{\rm lat}} = \vert \dot {\varepsilon }_{xy}\vert = \vert \partial u_x/\partial y\vert /2$ and τ e ≈ τ lat, where τ lat = |τ xy|. Therefore, Eqn. (1) is a reasonable approximation of the constitutive relation (Eqn (A1)) in areas where shearing dominates the stress field.


 Open access