


Plate 1. Thin section of undeformed ice viewed between crossed polarizing filters.
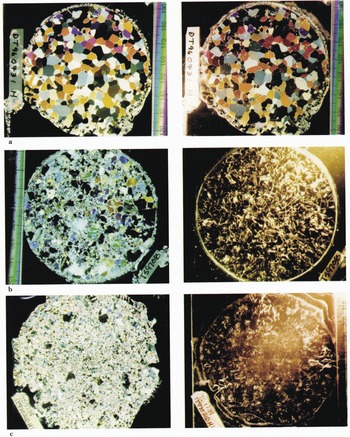
Plate 2. Photographs of thin sections for samples tested at a strain rate of 10−2 s−1 viewed between crossed polarizing filters (left photo), and viewed with side illumination with or without crossed polarizing filters (right photo). (a) Thin-section photographs of test to 1.0% strain at 10−2 s−1. (b) Thin-section photographs of test to 4.0% strain at 10−2 s−1. (c) Thin-section photographs of test to 28.8% strain at 10−2 s−1.

Plate 3. Photographs of thin sections for samples tested at a strain rate of 10−4 s−1 viewed between crossed polarizing filters (left photo), and viewed with side illumination with or without crossed polarizing filers (right photo). (a) Thin-section photographs of test to 1.0% strain at 10−4 s−1. (b) Thin-section photographs of test to 12.8% strain at 10−4 s−1.

Plate 4. Horizontal thin sections from samples deformed at Pc=5 MPa and s = 15 MPa (loading direction is perpendicular to the page). Sections are viewed between crossed polarizing filters alone, and between crossed polarizing filters with additional side lighting. Samples were deformed to strains of 4% (a), 10% (b) and 44% (c). Scale is in mm.

Plate 5. Enlarged view of thin sections from Plate 4. Samples were deformed to strains of 4% (a), 10% (b) and 44% (c). Scale is in mm.

Plate 6. Vertical thin sections from samples deformed at Pc=5 MPa and s = 15 MPa (loading direction is horizontal on the page). Sections are viewed between crossed polarizing filters alone, and between crossed polarizing filters with additional side lighting. Samples were deformed to strains of 4% (a),10% (b) and 44% (c). Scale is in mm.

Plate 7. Horizontal thin sections from samples deformed at Pc = 50 MPa and s=15 MPa (loading direction is perpendicular to the page). Sections are viewed between crossed polarizing filters alone, and between crossed polarizing filters with additional side lighting. Samples were deformed to strains of 4% (a), 10% (b) and 44% (c). Scale is in mm.

Plate 8. Enlarged view of thin sections from Plate 7. Samples were deformed to strains of 4% (a), 10% (b) and 44% (c). Scale

Plate 9. Vertical thin sections from samples deformed at Pc=50 MPa and s=15 MPa (loading direction is horizontal on the page). Sections are viewed between crossed polarizing filters alone, and between crossed polarizing filters with additional side lighting. Samples were deformed to strains of 4% (a), 10% (b) and 44% (c). Scale is in mm.

Plate 10. Vertical thin sections from two samples which failed along rupture planes (loading direction for (a) and (b) is vertical on the page). Sections are viewed between crossed polarizing filters alone, and between crossed polarizing filters with additional side lighting; (a) deformed at Pc=60 MPa, s=15 MPa; (b, c): deformed at Pc=30 MPa, s=30 MPa. Scale is in mm.
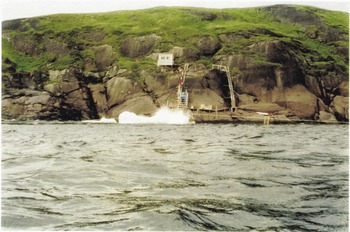
Plate 11. Photograph of impact number two of iceberg “Steve B”, 23 July 1995.

Plate 12. Photograph of contact zone (brown spot) on iceberg “Marlene”, 22 July 1995.

Plate 13. Photographs of global views of thin sections taken from IS and S2. In thin sections from IS, the top surface shown in the photograph is the impacted surface of the contact lone. (a) CZ1/IS/TS8, (b) CZ1/IS/TS1, (c) CZ1/IS/TS1a, (d) CZ1/IS/ TS1b, (e) CZ1/S2/TS1 and (f) CZ1/S2/TS3.

Plate 14. Photographs of magnified views of thin sections from IS. (a) CZ1/IS/TS1, (b) CZ1/IS/TS1, (c) CZ1/IS/TS1a and (d) CZ1/IS/TS1a.

Plate 15. Photographs later retaken under plain-lighting ( a) and side-lighting (b) conditions (photos taken by I. Meglis and P. Melanson), (a) CZ1/IS/TS8 and (b) CZ1/IS/TS1d.

Plate 16. Contact face at the end of indentation test 7 at Hobson’s Choice ice island, 1989, from Frederking and others (1990).
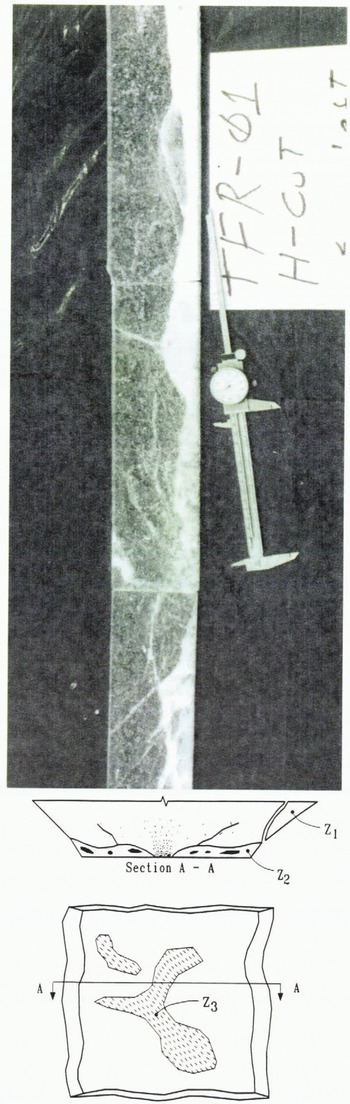
Plate 17. (a) Horizontal thick section of TRF-01 indentation test, Hobson’s Choice ice island, 1990, from Meaney (1992). Caliper was extended to 150 mm for scale. (b) Typical front view of test face, following indentation test, from Meaney (1992). Failure region was divided into three general zones: (i) spalled areas Z1, (ii) zones of pulverized ice, Z2, and (iii) zones of no distinct pulverized layer, Z3.


