


Introduction
During a journey through southern Peru in July 1964, some observations on the modern and Pleistocene snow lines were collected and these were then evaluated in relation to evidence from other parts of the Peruvian Andes (Reference HastenrathHastenrath, 1967). This study lead specifically to the problem of the Pleistocene snow-line depression and its large-scale variation, results indicating an increase of the Pleistocene snow-line depression southward, towards the interior of the desert areas, and a decrease from the Pacific coast towards the Amazonian slope of the Andes.
This study suggested that an extension of field observations into the extremely arid regions of the High Andes, straddling the borders of Bolivia, Chile and Argentina, could contribute to a better understanding of the spatial pattern of the Pleistocene snow-line depression and its palaeoclimatic implications. A preliminary survey with this objective finally became possible during a journey in June-July 1969. Various parts of the high mountain desert were visited on a route from the Salar de Uyuni on the Bolivian Altiplano to Ollagüe in the western Cordillera and the Chilean port of Antofagasta on the Pacific coast; and on a transect from Antofagasta up to Socompa, a mountain pass in the High Andes on the border between Chile and Argentina. The Andes were then crossed al the latitude of Valparaiso and Mendoza (Fig. 1).
Field observations were again evaluated in conjunction with the relevant literature and air photographs which were kindly made available by the Instituto Geogrâfico Militär m La Paz, Bolivia, and the Instituto Geogrâfico Militär in Santiago, Chile. The results are. reported in the present paper.

Fig.1 . Location map showing travel routes and the positions of the transects shown in Figures 2 (A—A), 3 (B—B), 4 (C—C), 5 (D-D), figure 4 in Hastemath (1967) (E-E), and the location of observation sites and cities
Modern Snow Line
The latitudinal variation of the present snow line in the western Cordillera is illustrated in Figure 2, in a schematic transect from lat. 12° to 33° S. The elevation of the 0°C annual isotherm shown in Figure a was computed from the radio soundings at Lima, Antofagasta and Quintero in 1958-62 (U.S. Weather Bureau, 1958-63). The corresponding elevations during the winter (May—October) and summer (November-April) half years are marked for the radiosonde stations only.
As far as possible, a cirque bottom was taken as an approximation of the snow line. Generally, a summit was considered to be above the snow line when it has at least one glacier or patch of perennial snow, i.e. essentially following the Richter-Dainelli criterion (cf. Reference LliboutryLliboutry, 1964-65). Difficulties in assessing a snow-line elevation are related to the phenomenon that areas of accumulation and ablation may show no sharp separation in this high mountain desert (e.g. Reference Lliboutry, Lliboutry, González and SimkenLliboutry and others. 1958).

Fig.2 . Schematic meridional transect along the western Cordillera between lat.12° and 33° S., showing the elevations of the modern snow line (MSL), the Pleistocene snow line (PSL) and the 0°C annual isotherm.
In Peru, the modern snow line in the western Cordillera rises from about 5 000 m in the latitude of Lima (lat. I2° S.) to more than 5 800 m on the volcanoes of El Misti (lat. 16° 17’ S.) and ChaChani in the Arequipa area (Hastenrath, 1967). According to Reference BrüggenBrüggen (1928, 1929, 1950), Tacora (5 950 m) at lat. 17° 24’ S. on the Chilean-Peruvian border has no perennial snow, while on Paillachata (6 240 m) at lat. 18° 18’ S. the modern snow line is ai less than 6 000 m. On Mt Sajama (6 520 m) at lat. 18° 07’S., which is somewhat more inland than either Tacora or Paillachata, the modern snow tine is near 5 900 m; the high volcanoes farther south, Aucanquilcha (6 180 m) at lat. 21° 20’S., and Ollagüe (5 870 m) at lat. 21° 20’S., stay below the present snow line (Reference KnocheKnoche, 1932; Reference Ahlfeld and BranisaAhlfeld and Branisa, 1960). About 150 km to the south-east, in the Cordillera de Lipez on the border between Bolivia and Argentina, remnants of snow are found throughout the year on Mt Uturunco (5 900 m) at lat. 22 ° 15’ S. and Mt Lipez (5 850 m) at lat. 21° 53’S. (Reference Ahlfeld and BranisaAhlfeld and Branisa, 1960).
As stated in the relevant literature, it was generally believed that Llullaillaco (6 723 m) at lat. 24° 43’ S. does not reach the modern snow line. However, Reference Lliboutry, Lliboutry, González and SimkenLliboutry and others (1958) have recently reported the existence of an ice slab on its western side between 6 500 and 5 600m. At Ojos del Salado (6885 m) in lat. 27° 07’S., two glaciers were found on the north-western slope extending between 6600 and 5400 m (Lliboutry and others, 1958). At Cerro Tres Graces (6 330 m) in lat. 27° 06’ S., somewhat west of Ojos del Salado, the modern snow line is near 6 300 m. according to Penck (1920) and Reference BrüggenBrüggen (1950). From the information given by Brüggen (1950), the recent snow line at Cerro Potro (5 830 m) in lat. 28° 23’ S. is at an elevation higher than 5 200 m. Cerro Dona Ana (5 950 m), at lat. 29° 46’ S., long. 70° 06’ W., carries several ice fields above 4 800 m except on its northern slope (Reference LliboutryLliboutry, 1964-65).
At Tórtolas (6 323 m) in lat. 29° 56’ S., a glacier spreads all over the south-eastern side between the top and 5 600 m (Lliboutry and others, 1958). Farther south, the modern snow line continues to drop drastically. For Ml Aconcagua (7 021 m; lat. 32° 05’S., long. 70° 00’ W.), Reference KühnKühn (1911) reported an elevation of 4 600 m; in the area of Rio Chicharra (about lat. 32°S., long. 70° 30’W.), Brüggen (1950) estimated the modern snow line at 4 200 m; and on Cerro Altar (5 222 m; lat. 33° 15’ S., long. 70° 15’W.) and Nevado Juncal (6 060 m; lat. 33° 06’ S., long. 70° 08’ W.) it is in the vicinity of 4 400 m, according to Reference BrüggenBrüggen (1950) and Reference LliboutryLliboutry (1954, 1964-65). For a discussion of the difficulties in assessing the snow line in this region, reference should be made to Lliboutry (1954, 1964-65).
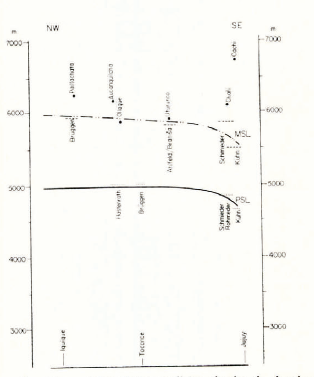
Fig.3 . Schematic north-west to south-east transect from Iquique to Jujuy, showing the elevations of the modern (MSL) and Pleistocene (PSL) snow lines. Horizontal and vertical scales as in Figure 2.
Figure 2 refers essentially to conditions in the western Cordillera. There are, however, pronounced variations from west to east, even at the same latitude. In southern Peru, the modern snow line drops from the Pacific to the Amazonian side of the Andes (Hastenrath, 1967). This pattern is also borne out by the schematic north-west to south-east transect from Iquique to Jujuy (Fig. 3). The value of 5 800-5 900 m for Chañi (6 100 m; lat. 23° 40’ S., long. 65° 20’ W.) was adopted from Reference SchmiederSchmieder (1922, 1923) and an elevation of about 5 500 m was given by Kühn (1911) for Nevados de Cachi (6 730 m; lat. 25°S., long. 67° W.).
A zonal transect across the southern fringe of the desert region, from Vallenar to Catamarca at about lat. 29° S. (Fig. 4), still shows a decrease in the modern snow-line elevation from the Pacific to the Atlantic side of the Andes. Data for Cerro del Potro, Cerro Très Cruces and Ojos del Salado have already been mentioned in connection with Figure 2. The modern snow-line elevations of 6 000 m for Cerro Bonete (6 850 m; lat. 27° 40’ S., long. 69° 00’ W.) and 5 700 m for Famatina (6 250 m; lat. 29° 00’ S., long. 67° 40’ W.) were adopted from Reference RohmederRohmeder (1941).

Fig.4 . Schematic zonal transect from Vallenar to Catamarca, showing the elevations of the modern (MSL) and Pleistocene (PSL) snow lines. Horizontal arid vertical scales as in Figures 2 and 3.
A west-east transect at about lat. 32° S. (Fig. 5) shows a pattern remarkably different from the previous profiles. Notwithstanding the slight latitudinal scatter of the observation sites, a rise in the modern snow line from the Chilean to the Argentine side of the Andes is clearly documented. Data for Rio Chicharra, Cerro Altar, Nevado Juncal and Aconcagua have already been mentioned and the value of 4 800 m for Ramada (6410 m; lat. 32° 15’ S., long. 70° 00’ W.) was adopted from Kühn (1911). According to Lliboutry (1956), the modern snow line at this latitude may rise above 5 500 m on the Argentine side. It is recalled that observations compiled here range over half a century and some discrepancies can be expected from the secular variation of the snow line. Lliboutry (1964-65) has pointed out that the crest height of the coastal mountains has a bearing on the snow-line elevation on the Pacific side of the Andes, and this reservation may apply particularly to Figure 5.
In general terms, this reversal of zonal variation at about lat. 30° S. is causally related to the change from an easterly to a westerly wind regime at the latitude of the sub-tropical high-pressure cells. In this connection, the zonal variation of the modern and Pleistocene snow lines may have a bearing on certain palaeoclimatic problems.
Evidence On The Pleistocene Snow Line
The latitudinal distribution of the Pleistocene snow line in the western Cordillera is also illustrated in Figure 2. This reconstruction is based exclusively on cirques. The occurrence of moraines and rock glaciers has been reported from numerous sites but these features are not generally suitable for an adequate assessment of snow-line elevation.

Fig.5 . Schematic zonal transect from Quintero to Mendoza, showing the elevations of the modern (MSL) and Pleistocene (PSL) snow lines. Horizontal and vertical scales as in Figures 2 and 3.

Fig.6 . Fossil cirque morphology in the region of Aucanquilcha and Ollagüe at about 4 800-5 200 m (photographs by S. Hastenrath, June 1969. The The marks identify some terrain features in relation to Figure 7.

Fig.7 . Air photograph of Aucanquilcha, showing indications of fossil cirque morphology (Nos. 35-9B-3273 and 3271 Instituto Geografico Militär, Santiago, Chile). The marks identify some terrain features in relation to Figure 6.
In the Arequipa area at about laL. 16° S., Hastenrath (1967) found fossil cirques at about 4500 m. This is in good agreement with Bruggen’s (1950) findings for Ml Tacora and Volcano Ghapire (5 995 m; lat. 19° 41’ S. long. 68° 40’ W.) in Cordillera de Sillajguay. for which he assessed the Pleistocene snow-line elevation at about 5 000 m. For Sajama, Reference Ahlfeld and BranisaAhlfeld and Braniäa (1960) reported evidence of a Pleistocene glaciation but it was not possible to establish the Pleistocene snow-line elevation from their data. Similarly, no relevant information seems to be available on Cordillera de Lipez. In the region of Aucanquilcha and Ollagüe, fossil cirque morphology was observed at 4 800-5 200 m during the June 1969 field trip. Figures 6 and 7 are ground and air photographs of the area. A Pleistocene snow-line elevation around 5 000 m in this area would seem consistent with some evidence from the adjacent areas to the south, as well as with the observations of Brüggen (1950) and Hastenrath (1967) at lat. 16-20° S. At Cerro Toconce (lat. 22° 12’S., long. 68° 12’W.), Brüggen found fossil cirques at 5 000 m. His findings have been further substantiated by Reference Hollingworth and GuestHollingworth and Guest (1967). During the June-July 1969 journey, landforms most suggestive of cirques were observed at about the same elevation and in the same general area, i.e. on the route from Ollagüe to Calama. However, it is believed that at least some of these phenomena may be pseudo-cirques of volcanic origin.
Interest focuses on the Pleistocene snow line in the core regions of the high mountain desert, at and south of the Tropic of Capricorn. In this respect, the high volcanoes Socompa (6 050 m; lat. 24° 19’ S., long. 68° 16’ W.) and Llullaillaco appear to warrant particular attention; but no evidence of a Pleistocene glaciation seems to have been reported so far. Observations during June 1969 were evaluated in conjunction with air photographs.
Concerning the huge volcanic block of Socompa, ground observations and air photographs consistently indicate the absence of any cirque morphology. Conceivably, this could be due to more recent volcanic events but there is no information on the age of volcanic activity.

Fig.8 . North flank of Mt Llullaillaco. Note the weak indication of possible cirque morphology to the right, below the summit (photograph by S. Hastenrath, June 1969). The mark identifies the location in relation to Figure 9.
On Llullaillaco, weak indications of a possible cirque were observed on the north-western slope at about 5 500 m. This phenomenon appears faintly both on the ground and the air photographs of Llullaillaco in Figures 8 and 9.
Landforms suggestive of cirques were also found in the area between Imilac and Socompa at an estimated elevation of about 5000 m.
On the whole, our knowledge of the Pleistocene snow line is most incomplete in the core region of this high mountain desert. Apart from the limited accessibility, this may be partly due to more recent volcanic activity which may have destroyed the Pleistocene landforms. Furthermore, the conclusions of Lliboutry and others (1958) regarding the character of the recent snow line and glaciers on the highest summits of the north Chilean desert may be relevant here; these glaciers supposedly show no sign of movement and they act in their whole area, according to the year, either as accumulators or ablators. From this description, one is led to conclude that their morphogenetic effect should be negligible. Similar characteristics may have prevailed on possible Pleistocene glaciers in this high mountain desert.

Fig.9 . Air photograph of Llullaillaco (18-8J-1031 and 1033, Institute Geografico Militar, Santiago. Chile). The mark identifes the location in relation to Figure 8.
From the core region of the desert, the modern snow line drops poleward, and a similar behaviour is indicated for the Pleistocene snow line (cf. Fig. 2). At Cerro Très Cruces. the Pleistocene snow line is set at more than 4 200 m, from end moraines reported by Penck (1920) and Briiggen (1950). Information on the Pleistocene snow line appears to be lacking for the areas of Ojos del Salado and Cerro Potro, in fact for the entire western side of the Cordillera south to almost lat. 30° S. Near Baños del Toro in the region of the Elqui Valley, in about lat. 29° 50’S., long. 70° 10’W., Brüggen (1950) found Pleistocene cirques at 4 300 m; and in the area of Upper Tascadero (about lat. 31° 00’ S., long. 70° 30’ W.) he established the Pleistocene snow line at 3 400 m, on the basis of cirques. Taking into account the rapid meridional variation, Reference MortensenMortensen’s (1928) observations from this general area are not sufficiently detailed concerning the latitudes of sites. To Reference HeinsheimerHeinsheimer (1946, 1947) we owe a survey of recent and fossil glacial morphology in the Cordilleras of Ansilta and Totora but these reports do not allow a reconstruction of snow-line elevation. Although Figure 2 illustrates the major latitudinal characteristics of the Pleistocene snow-line elevation in the western Cordillera, this survey at the same time identifies the region between about lat. 24° and 30° S. as the most serious gap in our present knowledge.
Regarding the variation of the Pleistocene snow-line elevation from the Pacific to the Atlantic side of the Andes, reference again should be made to Figures 3, 4 and 5.
Data for Aucanquilcha, Ollagüe and Toconce (Fig. 3) have already been discussed in connection with Figure 2. For Chañi, the Pleistocene snow-line elevation has been established at 4 600-5 100 m V Reference SchmiederSchmieder (1922, 1923) and Reference RohmederRohmeder (1941). The value of 4 650 m for Nevado del Cachi is due to Kühn (1911). Similar to the pattern of the modern snow line. this transect suggests a decrease in the Pleistocene snow line from the north-west across the Andes to the south-east.
The zonal variation of the Pleistocene snow-line elevation at the poleward fringe of the desert region is also illustrated in Figure 4. Data sources for the areas of Cerro Très Cruces, Baños del Toro and Tascadero, on the Pacific side of the Andes, have already been mentioned in connection with Figure 2. The Pleistocene snow-line elevations of 5 400 m for Cerro Bonete and 5 200-5 400 m for Famatina, on the Atlantic side of the Andes, have been given by Rohmeder (1941). In contrast to the behaviour of the modern snow line, Figure 4 illustrates a sharp drop of the Pleistocene snow line from the Atlantic to the Pacific side of the Andes. It is noted that this pattern is similar to the zonal variation of the modern and Pleistocene snow lines at a higher latitude (cf. Fig. 5).
Information on the Pleistocene snow line in the latitude of Quintero and Mendoza has been compiled in Figure 5. Brüggen (1950) set the Pleistocene snow line in the region of Rio Chicharra at an elevation of 3 400 m. During the journey from Valparaiso to Mendoza in July 1969, fossil cirque morphology was observed between Rio Blanco and Punta de Vacas, at elevations near 3 000 m, which would seem compatible with the large-scale meridional variation on the Pacific side of the Andes. For the Cordillera del Plata (about lat. 32° 50’ to 33° 20’ S., long. 62° 20’ W.) on the Argentine side of the Andes, Reference StappenbeckStappenbeck (1917) reported Pleistocene cirques at elevations between about 3 600 and 4000 m. In a good spatial consistency with the profile Vallenar-Catamarca, (Fig. 4), this indicates for the latitude of Valparaiso-Mendoza an increase in the Pleistocene snow line from the Chilean to the Argentine side of the Andes, analogous to the zonal snow-line pattern of the present day.
Snow-Line Depression And Atmospheric Circulation During The Glacial Period
The large-scale distribution of the Pleistocene snow-line elevation in relation to that of the modern snow line appears most relevant with respect to a possible reconstruction of the climatic pattern and atmospheric circulation during the glacial period.
As shown by the transect in Figure 2, the relative meridional pattern of the Pleistocene snow line is quite similar to that of the present; proceeding Equator-poleward in the western Cordillera, the snow line reaches its highest elevation around the latitude of most extreme aridity. In the Equatorward part of the arid area (Fig. 3) this is also true of the zonal variation, inasmuch as both the modern and the Pleistocene snow lines decrease from the Pacific to the Atlantic side of the Andes. At the poleward fringe of the desert (Fig. 4), however, the zonal pattern reversed during the Pleistocene, displaying an eastward increase of the snow line, as it is at present characteristic of Andean regions several degrees of latitude farther poleward.
The Pleistocene snow-line depression (i.e. the difference between modern and Pleistocene snow-line elevations) displays a rather consistent regional variation (cf. Figs. 2-5). For the Peruvian Andes, reference can be made (o an earlier survey (Reference HastenrathHastenrath, 1967). In the western Cordillera (cf. Fig. 2), the Pleistocene snow-line depression increases from 700 m in the latitude of Lima to about 1 000-1 300 m in southern Peru and northern Chile, and field observations in the areas of Baños del Toro, Tortólas, Très Cruces and Ojos del Salado would indicate a value of more than 1 500 m at about lat. 30 ° S. The north-west to south-cast transect from Iquique to Jujuy (Fig. 3) portrays a decrease of the Pleistocene snow-line depression from about 1 300 m in the Andes of northern Chile to about 700-1 200 m in the mountains of north-western Argentina. Reports along a tentative zonal transect (Fig. 4) across the southern fringe of the arid region indicate a depression of more than 1 500 m on the Pacific and about 600-400 m on the Atlantic side of the Andes.
Field observations thus indicate, for the western Cordillera, an increase of the Pleistocene snow-line depression from northern Peru (lat. 7° S.) to central Chile (lat. 30° S.); on the Atlantic side of the Andes, the Pleistocene snow-line depression seems to decrease from the Equatorward to the poleward fringe of the arid region, and it consistently decreases from west to east across the mountain system.
It is generally recognized that the last glaciation in the tropical Andes was characterized by both decreased temperature and increased precipitation (Reference KesslerKessler. 1963; Reference HastenrathHastenrath. 1967; Reference Van der HammenVan der Hammen, 1968). From a comparison with the present elevation of the 0°C annual isotherm, it was concluded that in the equatorial regions lower temperatures may have played a significant role for the Pleistocene snow-line depression. In the desert area, on the other hand, increased precipitation must have been the major factor (Reference HastenrathHastenrath. 1967), since the 0°C level is much below the present snow line (cf. Fig. 2). This should not exclude a simultaneous decrease of temperature throughout the tropical belt.
Furthering these considerations on the temperature and precipitation conditions, it is here suggested that the large-scale distribution of the Pleistocene snow-line depression arrived at in the present survey could, in qualitative terms, be understood from an Equatorward displacement of the atmospheric circulation belts during the glacial period (cf. Reference PaskoffPaskoff, 1967).
Figure to depicts the distribution of zonal winds during January and July along approximately long. 70° W., as compiled from available upper-air data for Lima, Antofagasta. Quintero and Puerto Montt in 1958-62 (U.S. Weather Bureau, 1958-63). The annual average of the boundary between temperate-latitude westerlies and tropical easterlies in the lower troposphere, where moisture is concentrated, is situated near lat. 30° S., that is, in approximate agreement with the latitude at which the zonal variation of the modern snow line was found to reverse (cf. Fig. 2). Westerlies in the upper troposphere extend considerably farther Equatorward in the mean, but moisture transport in the lower layers must be considered most significant in individual synoptic situations. Marked year-to-year variations in the boundary between westerlies and easterlies were found to occur. The seasonal change illustrated by Figure 10 may provide a very general idea on the magnitude of a possible shift of the zonal wind regimes during the glacial period.
A northward extension of the westerly wind regime during the Pleistocene, as suggested above, could have as a consequence increased precipitation (cf. Vita-Finzi, 1959), and hence a depression of the snow line throughout the arid Pacific regions. In latitudes with a well-developed westerly wind regime, an eastward rise of the snow line could result; and this is actually documented for lat. 29° S. in contrast to the present conditions. In fact, Figures 2-5 indicate that the latitude of reversal in the zonal pattern of the snow-line elevation during the Pleistocene may have been as far Equatorward as lat. 25° S., as compared to about lat. 30° S. at present.
The amount of snow-line depression was found to be smallest on the Argentine side of the Andes around lat. 28° S. Conceivably, this region would remain relatively unaffected. It would not share the increased precipitation associated with the prevalence of the westerly wind regime on the Pacific slope of the Andes; and the present snow line is well above the freezing level. The Atlantic regions on the Equatorward side of the desert (i.e. north-western Argentina and southern Bolivia) may have experienced a substantial increase in precipitation. It is noted that the modern snow line is well above the level of the 0°C annual isotherm. This may possibly point to an intensification of the easterly circulation regime in that latitude belt during the Pleistocene.

Fig.10 . Zonal wind regime (m/s) in a transect along approximately long, 70° W. during January and July1958-62.
For the north fringe of the high mountain desert, on the Peruvian-Bolivian Altiplano, geological-hydrological evidence points to a more humid climale during the Pleistocene (Reference TrollTroll, 1928; Reference KesslerKessler, 1963; Reference HastenrathHastenrath, 1967), thus indicating a narrowing of the arid belt also from its Equatorward side.
Such a climatic and circulation pattern appears as a counterpart to the southward shift of the North Atlantic and North Pacific anticyclones, an intensified westerly wind regime in temperate latitudes and increased rainfall activity in the tropics during the Pleistocene, as suggested by Reference VieteViete (1950),Reference WillettWillett (1950) and Reference FlohnFlohn (1952) from evidence in the Northern Hemisphere.
A preliminary attempt is made in the present paper lo examine the various geomorphic evidence in perspective with a view to a possible reconstruction of the atmospheric circulation pattern during (he Pleistocene. Regions which are gaps in our present knowledge have been specifically identified. It is hoped that this may serve as a framework for a systematic survey of Pleistocene morphology in the arid regions of the South American Andes.


