


Introduction
The Yukon River system of northwestern Canada and central Alaska is one of the great river systems of circumpolar regions. The river is navigable from its mouth on the Bering Sea to Whitehorse Rapids, Yukon Territory, Canada, about 2900 km. upstream; the river is icebound 7 months of the year. Fall freeze-up and spring break-up are transition periods of great interest.
Observations of the fall freeze-up and spring break-up on the river were made at a point 0.8 km. west of Beaver, Alaska (66° 21.6″ N., 147° 24.4″ W.), á small trapping village on the north hank of the Yukon River 1550 km. above its mouth and about 1335 km. downstream. from Whitehorse, Yukon Territory (Fig. 1, p. 489). Near Beaver the river flows in several broad meandering channels that are intricately connected with minor channels flowing among a mass of islands and gravel bars. The main channel is separated from the observation point by a bar and a side channel. The cold continental climate has extreme recorded temperatures of from 37.7° to –60° C. at nearby Fort Yukon, 15–25 cm. mean annual precipitation, and prevailing winds from the southwest in summer and north to northeast in winter.1

Fig. 1
Observations were made between 23 September and 7 December 1949, and 17 April to 7 June 1950. The writer appreciates the field assistance of N. C. Ross, of Beaver, valuable data furnished by residents of Beaver, and helpful discussion with colleagues of the U.S. Geological Survey.
Freezing of the Yukon River
First freezing air temperatures at Beaver occurred during August 1949; as the season progressed, freezing temperatures became more common and severe until in mid-October daily temperatures ranged between 0° C. and –19° C. (Fig. 2a, p. 491). During the brief period of daylight about 60 percent of the sky was covered with fog and clouds. River temperature began to drop in August from a summer peak of 16.5° C.; by 1 September it was 13.3° and on 14 October reached 0° C. (Fig. 2a).

Fig. 2
Cold weather in mountainous headwater regions in late August and September sharply reduces melting of glaciers that supply melt water to some headwater tributaries and converts precipitation to snow, thereby reducing the immediate precipitation run off. This decrease in flow of tributaries causes a drop in level of the Yukon River and decreases its discharge with an increasing proportion supplied by ground water. Reduction in quantity of glacial melt water diminishes the amount of glacial silt carried in suspension by the Yukon, and the river becomes less turbid. Clarke 2 reports that at Anvik (Fig. 1) the mean suspended load decreased from 366 ppm. for the week 23–29 August 1916, to a mean of 10 ppm. for the period 8 December 1916 to 8 March 1917. At Beaver the river was almost free of suspended sediment by mid-October 1949.
In early October 1949, ice began to form during cold, calm nights in slow eddies, in slack water along shore, and in channels blocked by gravel bars upstream. This ice gradually extended outward into the main channels of the Yukon.
On 14 October, river temperature reached 0° C., and small fragments of ice were seen floating down the river. These were probably broken by waves and current from previously formed shore ice. Ice pans up to 5 m. in diameter (Fig. 3, p. 486) began to move past Beaver during the night of 14–15 October and became more densely packed on 15 October. During progressive cooling of the river, turbulence kept the water sufficiently agitated to permit uniform cooling without temperature stratification. When water reaches 0° C., small ice crystals form and float to the surface, and freezing of surface water between them produces thin pans of ice.3 Because ice pans 31 began to float past Beaver at night it could not be observed whether they originated upstream or were formed locally by freezing of surface water.

Fig. 3 First day of floating ice, 15 October 1949. Circular ice pans with marginal ridges of ice fragments near observation point, 0.8 km. west of Bearer. See text p. 488–95
After 15 October, pans gradually increased in diameter and thickness. Rotation of pans upon impact against floating and shore ice knocked off angular edges and piled ice crystals and fragments around their margins (Fig. 3). Some circular pans were piled one upon the other by overriding or underriding. The outer margin of the ice anchored to shore was molded into a ridge of ice crystals by impacts from drifting ice (Fig. 4, p. 486).

Fig. 4 Yukon side channel near observation point, 24 October 1949. Overflow of ice by water rising through cracks is due to slight rise in river level
Grounded ice at shoals, together with a continued drop in river level, prevented ice from moving into some side channels. Water passing through ice pans grounded at these shoals produced a current that removed the ice in some channels, leaving open water that rapidly froze with a cover of smooth ice. In other channels, ice pans remained in place and were cemented together by freezing of water between them. Grounding of ice at shoals not only blocked side channels but constricted the river by funneling more floating ice through the main channels.
By 24 October, 9 days after the first appearance of floating ice, all but the main channel was frozen. The main channel, however, was clogged with ice pans that moved slowly downstream. The cross-sectional area available for river discharge was gradually reduced by combination of dense packing of floating ice pans in the main channel, encroachment of shore ice upon the main channel, and blocking of some side channels by grounded ice at shoals. The resulting constriction of the main channel caused a rise in river level of several centimeters on 24 October, causing ice covering the side channels to crack and water to overflow ice along shore (Fig. 4).
On 25 October, ice pans in the main channel stopped moving and jammed; the river level rose 0.6–1.2 m. (Fig. 5, p. 486). This sudden rise was similar to that commonly associated with freezing of other rivers in North America and Europe.3.4 The change from open-water flow to flow beneath an ice cover reduces the mean river velocity because of frictional losses against the rough undersurface of the ice and decreases mean discharge because a fixed ice cover reduces cross-sectional area available for flow. As the mean velocity is diminished, the discharge is also diminished, and a large quantity of water is stored upstream from the ice jam, producing a rise in river level. These jams are local, and, on the Yukon in 1949, several long reaches of the channel near Beaver remained unfrozen for over a month after freeze-up at Beaver. The rise of river level on 25 October at Beaver brought the Yukon back nearly to its September level (Fig. 2b, p. 491). Fish racks, beached boats and debris were pushed up the shore by rising water and ice. Some channels that had been blocked at an early stage of freeze-up were reopened, and ice that had been formed in them was broken and carried downstream.

Fig. 5 Yukon side channel following rise in river level caused by jam of floating ice in main channel on 25 October 1949. Cf. with Figs. 4 and 6
On 26 October, the river near Beaver had completed its adjustment to a channel under the ice, and river level fell to the approximate level of 24 October (Fig. 6, p. 486).

Fig. 6 Side channel, 26 October 1949; drop in river level followed adjustment to flow under ice-cover in main channel. Grounded ice and debris stranded on beach by rise of 25 October
Although all channels near Beaver were covered with ice by the end of October, some channels up- and down-stream remained unfrozen until after 7 December. Turbulence or warm groundwater seepages may account for persistence of some unfrozen reaches throughout the winter. Freeze-up, therefore, appears to be governed by local channel, current and ice conditions and has no definite progression, either up- or down-stream. Because of local variations, no effective long-range basis for predicting the date of first appearance of floating ice or the date of final freezing of the river has been established yet. In general, median dates for freezing of the upper Yukon as far downstream as Eagle (Fig. 1) are in the first or second week of November. For the shallow braided channels from Circle to Stevens Village median dates are about 1 November; on the Yukon delta, freeze-up occurs in late October. At nearly all stations where records are available, dates range from early to mid-October to late November, depending on local weather conditions.
Mid-winter Conditions
Beaver, only 8 km. south of the Arctic Circle, receives very little sunlight in December and January; the small amount that is received, however, is augmented by reflection from snow mantling the river ice. Two cold periods, one between Christmas and New Year’s Day, the other in February, brought 20 days of –34° to –50° C. temperatures. A brief warm period in Januarywith temperatures as high as –4° C. was accompanied by strong southwest winds that drifted the snow cover. During the remainder of the winter through 1 March, temperatures ranged from –12° to –40° C. Thus, no snow or ice was removed by thawing, and ice continued to thicken, particularly after the January winds, when snow was blown from many sections of the river channel.
From 1 November to 1 April the river level, together with the ice surface, fell gradually, reaching its estimated low level for the year in April. Main channel ice, floating on the water surface, had frozen as a jumbled mass of ice pans. Some pans projected through the light winter snow cover. Ice thickness was reported between 0.6 and 1.2 m. and probably was thicker in places where water had overflowed the ice. Overflows commonly result from ice freezing to the bottom of shallow sections of the channel or from constrictions in the channel due to freezing. Water dammed behind constrictions is under pressure and seeps through cracks upstream, flowing out and over the ice surface in thin sheets that are quickly frozen. Removal of insulating snow cover by flowing water permits freezing to greater depth, further constriction and continued overflows. In this manner freezing of repeated thin overflows can build ice thicknesses up to 3 m.
In late winter strong winds blew silt from exposed bars onto the snow, accelerating thawing during early spring. On 20 March 1950, only 20–30 cm. of snow remained in some places, with about 50 cm. in drifts.
Break-Up of Yukon River Ice
On 17 April 1950, when the writer returned to Beaver, the Yukon (Fig. 7, p. 486) was at or near its low stage for the winter; this was substantiated by local residents who reported no rise in river level. The 17 April level, therefore, was established as a reference plane for river levels; it was 5.3 m. below the top of the cutbank at the observation point 0.8 km. downstream from Beaver.

Fig. 7 Side channel of Yukon River at observation point 0.8 km. west of Beaver, 17 April 1950. Snow cover 30–50 cm. deep
Open water near Beaver in April 1950 was limited to a few open leads in the main channel. Some of these were adjacent to downstream margins of gravel bars where relatively warm water, seeping through the gravel, had either prevented formation of ice or had thawed earlier ice. Other leads appeared to be formed in especially turbulent parts of the river.
Thawing of the undersurface of the river ice and erosion by turbulent currents undercut the ice and in places formed open leads. The exact amount of thawing was not observed. Leads, opened in this manner, grew larger and coalesced as thawing progressed, and eventually formed some of the large expanses of open water noted before break-up. Such a lead opened on 1 May along the north bank of the river where two channels join at the downstream end of a gravel bar about 1.6 km. west of Beaver.
Thickness of ice was estimated at 30–60 cm.; ice floating on the water surface was covered by 24–46 cm. of slightly wind-crusted snow. Gibbs5 has reported ice 152 cm. thick at Tanana (Fig. 1), and ice pans from 213 to 275 cm. thick have been reported by residents of Beaver and Circle, who observed grounded or floating pans after break-up.
By the end of the first week in May much of the snow on both the river ice (Fig. 8, p. 487) and the banks had been thawed by warm air temperatures and more than 16 hours of bright sunshine daily. Water remaining on top of the ice along shore on 7 May indicated that the main ice body had not yet been raised enough to break away from shore. By 9 May, however, rising river level lifted the ice in mid-channel, and tension cracks formed in ice near shore, permitting water to drain from the ice surface to the river; river level was 46–60 cm. above that of 17 April (Fig. 2a).

Fig. 8 Yukon side channel at observation point, 5 May 1950. Water collects along margins of ice sheet as river rises, lifting ice in mid-channel
From 1 to 9 May, leads below Beaver continued to enlarge. Between Beaver and a point 29 km. upstream a swift current was reported to be flowing across the ice in a few places.
By 10 May, after thaw of snow cover, the character of the ice began to change from solid transparent ice to candle or honeycomb ice. Honeycomb ice is composed of long crystals oriented normal to the surface. Spaces between crystals were commonly filled with water so that the ice appeared dark when floating in the river.
On 10 May, river level had risen to 61 cm. (Fig. 2c, p. 491), and open leads began to develop along shore as the rising river continued to lift the ice. These leads increased in size until 13 May, when they were nearly continuous and the ice at Beaver was almost free from contact with shore (Fig. 9, p. 487). After 10 May the river rose at a more rapid rate (Fig. 2c); by 13 May it had risen 1.62 m. Moderate current was noted in open leads between shore and the main body of ice and in open leads downstream from Beaver where leads had coalesced and extended nearly across the river. Current in the leads along shore probably scoured material from the bank; this scour freed the remaining ice from contact with shore. Ice anchored to the bottom of shoal channels near Beaver was floated by rising water after a brief period during which water flowed over it. The underside was studded with river gravel that had been frozen into the ice.

Break-up of river ice is here defined as the breaking and moving downstream of ice in main river channels, followed by the eventual clearing of ice from all channels. Break-up of the main channels of the Yukon River had moved downstream past Dawson (Fig. 1) on 8 May and was reported at Eagle on 11 May, and at Fort Yukon on 13 May. At Beaver, late in the evening of 13 May, ice in the side channel downstream from the village floated downriver into the open lead 1.6 km. below the town, where it jammed against firm ice downstream. The side channel ice moved out in one large block about 900 m. long and 370 m. wide; its velocity was estimated at 3.3 km./hr. A rise in river level of 13 cm. accompanied ice movement, but no movement was noted in the main channel ice.
By 8.30 hr., 14 May, river level had reached 2.35 m. (Fig. 2c). The river continued to rise rapidly, and just before 10.00 hr., noise caused by grinding ice could be heard as break-up approached Beaver from upstream. At 10.00 hr., after a rise to a level of 3.9 m. above that of 17 April, the river ice in the main channel started to break and move slowly downstream. Movement was slow at first but rapidly accelerated. Break-up had taken one day to advance downstream from Fort Yukon to Beaver, a channel distance of about 150km. The first masses of ice moved were several tens of meters across and were those that had been in the channels near Beaver (Fig. 10, P. 487). These rammed the banks with tremendous force. The large pans were followed by smaller ones (Fig. 11, p. 487) that had traveled farther and had been broken from the larger masses by contact with river banks, floating ice, and other obstructions.
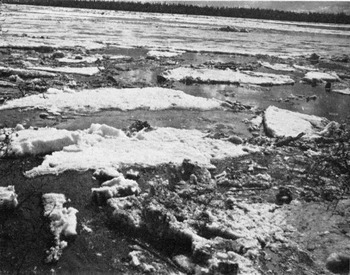
Fig. 10 Yukon side channel at 14.00 hr., 14 May 1950. Large ice pans moving downriver about 4 hours after ice break-up.
All the floating ice pans did not travel at uniform speed and were continually bumping each other. As they moved downstream pans were continually being rotated, overridden, underridden, turned over, and broken by impact from adjacent pans. Many attained rounded shapes with small marginal piles of ice crystals, similar to those noted at freeze-up. Between the large pans were small blocks and crystals of ice broken from larger ice masses. Some ice pans were grounded along shore and on river bars; these, when struck by floating ice, were driven up the shore. Piles of ice as high as 9 or 10 m. have been reported locally, but in 1950 only small piles were observed on upstream ends of gravel bars.
Local residents reported that the 1950 break-up was accompanied by the lowest river level in over 40 years. Ice pans were much thinner than in years having colder winters and later, less gradual spring thaw. In 1950 the ice was 0.3–1.2 m. thick at break-up; ice pans 1.8–2.7 m. have been reported in previous years.
River level fluctuated 0.30–0.52 m. during the period of floating ice (Fig. 2c). Higher levels coincided with periods when the channel was choked with ice (Figs. 10 and 11) and lower levels during periods when only a few pans were floating in the river (Fig. 12, p. 487). This relationship indicated that a heavy concentration of floating ice retards mean velocity of the river and causes a slight damming. Increase in concentration of ice pans with accompanying rise in level may also be the result of release of stored water and ice in ice jams upstream, flood crests of tributaries, or fluctuations in supply of water received from headwaters.
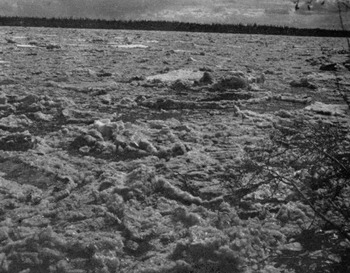
Fig. 11 Ice-choked side channel of Yukon River at observation point 17.00hr., 14 May 1950. Channel is packed with smaller ice pans that had travelled farther and were more broken than those in Fig. 10

Fig. 12 Low concentration of ice pans near observation point, 10 May 1950. River was about 30 cm. lower than when it was choked with ice
At Beaver, on 17 May, ice had been moving down the river for 3 days and the concentration of ice in the channel was so low that it was possible to cross the river in a canvas canoe. In late afternoon, however, a new, heavy concentration of ice moved past Beaver, preceded by very large ice pans. During this renewed run of ice, which may have originated in the Porcupine River (Fig. 1), another tributary, or in an ice jam in one of the Yukon channels above Beaver, the river reached its high level for the year on 18 May–4.18 m. above the 17 April level—and reportedly at least 1.2 m. below the usual break-up flood crest.
The concentration of ice pans gradually diminished after the 18 May flood crest until midmorning of 19 May, when the last floating ice was seen. The period of floating ice lasted 5 days, compared to the usual 4– to 6–day period reported by local residents. After the 18 May flood crest, river level dropped steadily (Fig. 2c) and by early June reached a level 2.65 m. below the 18 May peak. During the week 7–14 June river level rose again, but only about 1 m. In some years the June flood, due perhaps to rainfall, commencement of glacial melting or to late snow-melt runoff, is higher than the break-up crest.
Water temperature of 0° C. and above while ice was floating in the river indicated considerable thawing of floating ice by river water (Fig. 2a). After 19 May river temperature rose sharply and continued to rise until 28 May, when it was stabilized at 10°–11° C.
Break-up of the Yukon River appears to progress slowly downstream from its headwaters north and west toward its mouth. Progress of break-up downstream is well illustrated by observations of the 1945 break-up by Reed6 (Table I).
Table I 1945 Break-up, Yukon River Stations

Advance break-up of Yukon River ice at and below Tanana was caused by arrival at Tanana of the break-up flood crest of the Tanana River, the largest tributary of the Yukon from the south. The Tanana drains a major portion of the southern Yukon watershed in which spring thaws arrive earlier than in northern tributaries and along the Yukon River. The break-up from the upper Yukon did not reach Tanana for several days after the advance break-up had removed the ice below the confluence with the Tanana River. The orderly pattern of the 1945 break-up is unusual; downstream progress of break-up generally is interrupted by numerous advance breakups caused by tributary flood crests and is delayed by local ice jams such as the one that caused record flood levels at Fort Yukon in 1949, and those at Galena in 1943, 1944 and 1945. A summary of available records 1,7,8 for the years 1896–1950 at stations along the river is given in Table II.
Table II Dates of break-up for yukon river stations

Effects of moving ice on banks, river bars and rock outcrops have been described by Wentworth.9 Eardley10 and Williams11 have noted that erosion of banks during the short break-up period is minor compared to the work of current and wind waves, although ice lifted over the banks by high water can sweep through forests or river settlements.
Since present observations were limited to a single locality, they must be considered valid only for the village of Beaver, though general sequences of events are probably duplicated elsewhere along the river. Future studies of break-up and freeze-up should gather many quantitative data on hydrology and meteorology of the entire river system, together with systematic observations at many points over a period of several years.


