


1. Introduction
Forces exerted by ice have a great importance in the design of hydraulic and marine structures in northern countries. It is known that wind, currents, and the variation of air temperature will initiate the movement of an ice field that may then transmit its energy to any fixed boundary or structure that will oppose this movement. In fact, these forces are so high in Arctic regions that they are the highest forces that will have to be taken into account in designing any structure to be placed in the area.
The highest forces that floating ice can transmit to any structure is that of impact in any vertical part of it. This case has been the object of many recent studies and it is of high practical interest at the present time. However, an extensive bibliography by Reference KorzhavinKorzhavin (1962) shows that Russian studies on this question date back to the nineteenth century.
The problem of indentation of a floating ice sheet has been studied in many ways, with mathematical and physical models and also with measurements in the field. Unfortunately, many discussions in the literature are contradictory, and it is difficult to obtain a universally accepted view of a solution to this problem.
In the present study we have tested ice plates made of perfect columnar S2 ice indented at the edge with a flat punch. The objective was to cover the full range of loading rates of practical interest where failure would occur in all ranges from ductile behaviour to brittle fracture.
It was also important to study the form factors related to the size of the indentor that are much discussed in the literature. The results were used to identify the various mechanisms of indentation and develop a theoretical model to best solve the problem of indentation in the ductile range.
2. Present Position
The relatively simple case of indentation of ice by the vertical face of any structure shows that the largest forces arc associated with crushing along the contact perimeter in a more or less continuous manner. The force acting on the structure is usually defined by the effective ice pressure p:
where F is the force on the structure, p the effective ice pressure, b the width of the structure, and h the thickness of the ice. The main question, then, is to relate the effective ice pressure to the actual crushing strength of the ice and other geometrical factors.
One of the first and most widely used formulae is that of Reference KorzhavinKorzhavin (1962) for vertical piers :
where C is the indentation coefficient caused by biaxial stresses, increasing with the ratio of ice-sheet width B to pier width b and given as 2.5 by Korzhavin for B/b ≥ 15; m is the coefficient for the form in plan of the pier, equal to one for a rectangular-nosed pier; k is the contact coefficient allowing for incomplete simultaneous contact of ice over the whole area of ice bh; v is the velocity of the ice sheet related to V 0 a reference velocity, Korzhavin says this expression is valid for deformation rates of 10-3 to 10-2 S-1; and σ is the uniaxial compressive strength of ice.
Most discussion on the problem of ice indentation has centered around the dependence of the indentation coefficient C on the aspect ratio b/h of the indentor and on the validity of using the expression for the velocity in the formula.
The velocity term was included to allow for the observed dependence of the strength of ice on the strain-rate, as said previously, but the functional relationship given in the formula has not been supported in a general manner by more recent tests (Reference Frederking, Gold., Wetteland and BruunFrederking and Gold, [1972], Reference Frederking and Gold1975).
Recent research has been aimed at determining the effect of what is called the ratio factor b/h on the value of C. Experimental work was done by Reference Afanas’yevAfanes’yev and others (1971), Reference SchwarzSchwarz and others (unpublished), Reference Frederking and GoldFrederking and Gold (1975) and general reviews made by Reference MichelMichel (1970), Reference Assur, Wetteland and BruunAssur ([1972]) and Reference NeillNeill (1976).
The tests are usually done by indenting ice at a constant speed while varying the ratio b/h from 1 to 8. The results are close to those represented by Afanes’yev with the empirical relation :
which gives a value of C close to Korzhavin’s 2.5 for b/h = 1.
Reference Frederking and GoldFrederking and Gold (1975) have also found that the indentation factor does not depend on the ice thickness but only on the width of the indentor. Reference SchwarzSchwarz and others (unpublished) found a small dependence on the ice thickness, but they used natural ice made of a top layer of S2 ice with a random orientation of the c-axis followed by S2 ice of horizontal c-axes.
The present investigation deals both with the effect of the velocity of impact and the geometrical factors.
3. Experimental Set-Up
The experimental investigation was carried out in a cold room of the Laboratoire de Mécanique des Glaces et Université Laval. Tests were done on ice plates made of fresh-water S2 ice held vertically in a press and indented at various speeds with a rectangular indentor.
The ice plates were 81 cm by 81 cm in plan and their thickness varied from 2.5 cm to 10 cm. Ice was grown in a laboratory tank with standard techniques to produce S2 ice made of fine crystals with an average diameter of 7.5±2.5 mm. The ice was completely bubble-free and the technique of production is described by Reference Michel and RamseierMichel and Ramseier (1971). The ice plates were machined using a special rig to obtain regular and smooth surfaces with a maximum variation in thickness of 2.5 mm. The top 10 cm of the ice in the tank was made of P4 snow-ice and S2 columnar ice of random orientation of the c-axes; it was discarded in order to have only homogeneous S2 ice of horizontal c-axes.
An hydraulic press was designed to operate in the cold rooms for these tests at loads up to 12 000 kg. It is composed essentially of a rigid frame large enough to receive the plates, a cylinder, and piston with a high-pressure hydraulic pump where the oil discharge is variable. With this system the speed of the piston can be varied from 6 × 10⁻⁵ cm/s to 3 cm/s. Loads are measured with a load cell and displacements with a linear differential transformer. Recordings are made either with an X–ϒ recorder or an oscilloscope. Time-lapse pictures were also taken with cameras of various characteristics during the indentation process. Figure 1 illustrates the set-up of the testing machine.
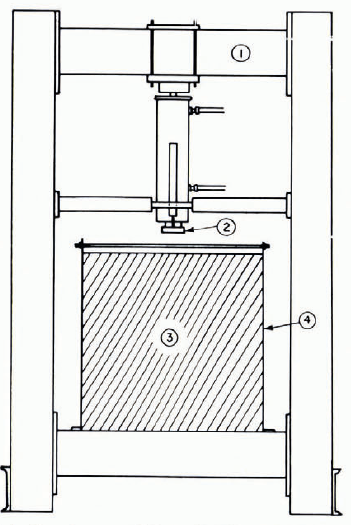
Fig. 1. Layout of experimental rig: (1) loading frame with hydraulic piston, (2) flat-edge indentor, (3) square ice plate, 81 cm sides, (4) rigid frame holding the ice plate.
4. Results of Tests
A total of 22 indentation tests were made: the test conditions and usable results are listed in Table I. Essentially, the tests were done to study the effect of the major parameters influencing the indentation process, the most important being the effect of the strain-rate on failure in the full range of ductile behaviour and of brittle fracture. Also studied was what we might call the scale effect, which depends on the scale of the set-up itself compared to prototype conditions, and was characterized here by the indentor width. Finally, evaluation was made of the effect of a most important factor which is defined as the ratio of b to h.
TABLE I. RESULTS OF TESTS

The failure mechanism differs considerably as a function of the rate of indentation. We will now describe these processes for the various failure modes.
4.1 Pure ductile behaviour
Under pure ductile behaviour, micro-cracks are formed under the indentor as shown in Figure 2. These cracks are randomly oriented and their length is of the order of magnitude of the crystal diameter. They tend to propagate to the full width of the plate along the longitudinal axis of the crystals. As the indentor progresses, the concentration of these minor cracks increases and a zone of continuous fissured material of a whitish appearance is formed right under the indentor. This zone, which we might call the zone of plastification, extends to about 1.6 times the indentor width where yield occurs. It was also noted, in all tests with a ductile behaviour, that very little cracking activity will appear at a distance beyond 2.5 times the indentor width.

Fig. 2. Formation of micro-cracks in pure ductile indentation. For loading curve see Figure 3.
This process of pure ductile behaviour appears to be valid with increasing strain-rates up to an effective indentation rate of 2.5 × 10⁻⁵ S-1.
The test for that rate is shown on Figure 2. The corresponding recording of load versus displacement is shown on Figure 3. It can be seen that the recording is continuous but that there is a large reduction in effective pressure after the peak has been attained. This reduction is in the order of 60%.

Fig. 3. leading curve—test number 13, b = 2.54 cm, h = 5.09 cm, v = 2.54 × 10⁻⁴ cm/s.
4.2 Failure in the transition zone
For an effective indentation rate of 6.25 × 10⁻⁵ 3-1 there is an important evolution of the failure mechanism. Because of the increase in the indentation rate, the stress concentrations at the corners of the indentor are high enough to propagate major cracks through the plate before yielding can occur in the ductile manner. These macro-cracks separate the plate in many sections but they do not attain the physical limits of the constrained plate. On Figure 4, the cracks at the corner make an angle of about 30° with the vertical. Other macro-cracks may also appear with increasing strain-rates.

Fig. 4. Macro-creek and micro-crack formation during indentation in the transition zone. For loading curve see Figure 5.
Because of the fact that these macro-cracks cannot fail the constrained plate as such, the mechanism of micro-crack formation is still repeated under the indentor as for pure ductile behaviour and the yield strength continues to increase with strain-rates up to a limit around 5 × 10⁻⁴ S-1.
Figure 4 shows the failure that gave the maximum pressure during this investigation at a rate of 2.43 × 10⁻³ S-1. The recording of the load is given on Figure 5. It can be seen that because of the major cracking within the plate, the recording fluctuates after the first peak and the residual load is only about 25% of the peak.
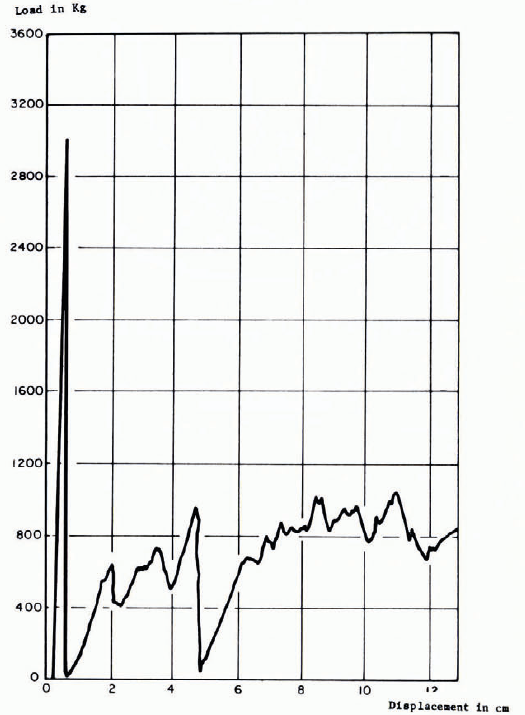
Fig. 5. Loading curve test number 10, b = 5.08 cm, h = 5.08 cm, v = 4.93 × 10⁻² cm/s.
4.3 Pure brittle fracture
Five tests were carried out at strain-rates higher than 2.3 × 10⁻² S-1 which showed completely brittle fracture. They were characterized by major crack formation, peeling of the ice and very little micro-crack formation. In fact, no plastification zone could be seen in front of the indentor.
The major cracks that formed were similar to those observed during the transition from ductile to brittle behaviour. The first micro-cracks appeared at the corners of the indentor making an angle between 30° to 40° with the vertical. Other major cracks were formed and sometimes a vertical fissure appeared separating the plate in two sections. However, these major cracks did not produce the failure of the plate.
The failure of the plate was produced by peeling of the ice on both sides of the plate under the indentor. Sometimes the peeling occurred over a very short distance under the indentor. At other times, one or two cleavage cracks would appear and extend inside and in the plane of the plate. They would then reappear on the sides to form a semicircular scale of ice that fell off. This cleavage process is very similar to that observed by Reference Shadrin and PanfilovShadrin and Panfilov (1962) and Reference HirayamaHirayama and others (1974), the latter suggesting that they are caused by tension inside the ice plate because of the lateral restraint of the indentor. The remaining ice layers were then finally crushed into very small pieces that fell off the side of the plate.
Figure 6 describes this type of brittle fracture and Figure 7 gives a recording of the load in a particular case. It can be observed that brittle fracture is accompanied by a considerable decrease in effective pressure on the indentor after the first peak, of the order of 30% of the maximum load.

Fig. 6. Brittle fracture—scaling and thinning: (1) indentor, (2) rigid frame, (3) internal crack appearing at the surface, (4) thinning of the ice plate.

Fig. 7. Loading curve—test number 4C, b = 5.08 cm, h = 5.08 cm, h = 3.30 cm/s.
5. Discussion of Results
We will now discuss the previous results in a quantitative manner.
5.1. Physical model of indentation in the ductile range
We have previously used the expression effective strain-rate, which need to be defined in such a way that it will be compatible with measurements of ice strength under uniaxial conditions in the ductile range. As said previously, it was observed in all tests that the area of micro-crack production did not extend beyond 2.5 times the width of the indentor and that this value appears to be a constant whatever be the width of the indentor, the thickness of the plate, or the rate of indentation in the ductile range. With this observation we have set up a physical model of deformation mechanisms shown on Figure 8. Close to the indentor is the plastification zone where the lines of slippage are shown, followed by a circular area of micro-cracking and ductile behaviour of the material. Outside of this area, the ice is deformed very little in the elastic range.

Fig. 8. Physical model of indentation process; (1) indentor, (2) zone of plastic flow, (3) zone of ductile deformation with micro-cracks, (4) zone of elastic deformation without crack.
From this model and taking into account the biaxial effect we can define the effective strain-rate as the rate of deformation in the zone of ductile behaviour with the expression:
where V is the rate of indentation and ![]() the equivalent uniaxial strain-rate in S-1.
the equivalent uniaxial strain-rate in S-1.
5.2. Scale effect
The scale effect may be defined as the measure of the influence of the size of the model tests to represent the actual behaviour of ice at full scale in Nature.
One way to assess this effect is to class the strength results as a function of the width of the indentor for a constant strain-rate. This was done for a strain-rate of 2.5 × 10⁻⁵ S-1 and indentor widths varying from 6.3 mm to 203.2 mm. The results are shown on Figure 9.

Fig. 9. Scale effect on model results.
It can definitely be seen that there is an increase in strength for indentor width equal to or smaller than 25 mm. This can be explained by the importance of the grain size (around 7.5 mm) compared to the indentor width and the fact that the particular orientation of only one grain might thus influence the results. Because of this, tests numbers 14–19 which slow this scale effect could not be used for further analysis.
As found previously by Reference Frederking and GoldFrederking and Gold (1975), the plate thickness, which varied from 25.4 mm to 101.6 mm in these tests, does not appear to influence the results.
5.3. Straing-rate effect
The results of tests numbers 1 to 13 inclusive can be used to correlate the indentation pressure to the strain-rate.
Figure 8 shows the physical model of indentation described previously. Close to the indentor we may use, according to Reference HillHill (1950), a zone of perfectly plastic material where the slip lines satisfy the equations of plasticity theory. The four equilateral triangles CMA-ANE-ESB-BTG represent regions where the glide lines are straight and make an angle of 45° with the plane of the indentor in contact with the semi-infinite material. Both corner triangles are tied with segments of circles whose respective centers are A and B. The zone which deforms plastically is then limited by the points CMNESTGC.
Adjacent to this fully plastic zone of large deformation there is a zone of ductile behavior of the material extending to the limit CVG where the maximum distance is EV = 2.5b. Outside this limit, the material behaves in a perfectly elastic manner as said previously.
With plasticity theory, the nominal pressure of indentation under the indentor can be computed. With the Huber- Von Mises failure criterion, this pressure is:
where σ is the uniaxial yield strength of the material in the zone of ductile behaviour.
Let us now compare the computed yield strength of ice obtained from indentation with that measured directly in uniaxial compression. This is done in Figure 10.

Fig. 10. Universal curve for uniaxial crushing and indentation of S2 ice at —10°C: О——— Reference Michel and ParadisMichel and Paradis (1976), uniaxial; О— — — Reference Garter and MichelCarter and Michel (1972), uniaxial; † Reference Frederking and GoldFrederking and Gold (1975), indentation; * Reference HirayamaHirayama and others (1974). indentation; × present study, indentation.
The strength of ice in uniaxial compression is a function of the strain-rate and is given in the ductile range by Reference Michel and ParadisMichel and Paradis (1976) and listed in Table II. The best-fit formula for the experimental results with S2 ice at — 10°C is:
with A = 470.76 and where Q is the activation energy of 21 662 cal/mole (90 694 J/mole) for S2 ice, R is the universal gas constant 1.986 2 cal/mole K (8.316 J/mole K), n is 3.097 for S2 ice and σ is in kPa.
TABLE II. EXPERIMENTAL DATA ON UNIAXIAL CRUSHING STRENGTH OF S2 ICE AT — 10°C

It can be seen that the value of n for this type of ice is very close to the 3 proposed by Reference GlenGlen (1955).
Explicitly, Equations (5) and (6) give the indentation pressure:
where C is the indentation coefficient equal to 2.97. This formula is valid in the ductile range for strain-rates ![]() from 10-8 to -1 to 5 × 10⁻⁴ S-1.
from 10-8 to -1 to 5 × 10⁻⁴ S-1.
In the brittle range, the strength of S2 ice in uniaxial compression for horizontal samples taken 10 cm below the surface at — 10°C is given by Reference Garter and MichelGarter and Michel (1972), and listed in Table II. The results are plotted on Figure 10. It may be observed that the ice strength increases in the ductile range up to a maximum for ![]() close to 5 × 10⁻⁴ S-1 and then stays a constant for higher strain-rates.
close to 5 × 10⁻⁴ S-1 and then stays a constant for higher strain-rates.
For the indentation tests, results from the present investigation, from Reference Frederking and GoldFrederking and Gold (1975), and some results from Reference HirayamaHirayama and others (1974), are listed in Table III. They were reduced with the value of C = 2.97 and are plotted on Figure 10.
TABLE III. INDENTATION PRESSURE FOR A RECTANGULAR INDENTOR AND S2 ICE AT – 10°C

It can be seen that the representation on this figure is universal both for uniaxial compression and indentation, and that the fit is very good for all tests in the ductile, transition, and brittle zones. For brittle fracture, the indentation process is however completely different and the theory of ductile behaviour does not apply.
It is most interesting to note that the influence of the strain rate is opposite that obtained by Reference KorzhavinKorzhavin (1962) and given by Equation (2). But Korzhavin’s results were valid for strain-rates from 10-3 to 10-2 S-1 where ice strength is decreasing in the transition zone as we have also found in this study.
The final formula for indentation for plates of S2 ice would then be, using a notation similar to that of Korzhavin:
(a) In the pure ductile zone
(8)
valid for 10-8 S-1 5 × 10⁻⁴ S-1 with C = 2.97, m = 1.0 for a rectangular indentor, k = 1.0 for full contact and 0.6 after or with incomplete contact, σ0 = 7 000 kPa is the maximum strength of S2 ice at — 10°C and a strain-rate ?0 of 5 × 10⁻⁴ S-1. This strength could be computed for other temperatures using Equation (6).
(b) In the transition zone
(9)valid for 5 × 10⁻⁴ S -1 10-2 S-1 with k = 0.25 for incomplete contact. This is very similar to the original Korzhavin’s formula where the pressure is decreasing with an increase in strain-rate.
(c) In the brittle zone
(10)valid for ε > 10-2 S-1 where σb0 is the uniaxial crushing strength of the ice under brittle conditions, C ≈ 3 and k = 0.30 for incomplete contact.
The recordings for five tests in that range could not be used but the mechanism of failure shows that the cleavage cracks that propagate under the indentor, followed by crushing, are similar to those obtained for conditions under uniaxial testing. The only valid test during this study, and those of Reference HirayamaHirayama and others (1974) corrected for an ice temperature of — 10°C, show that the coefficient C of around 3 could still be used in that range.
Table IV shows the rate of advance of an ice sheet that produces the maximum pressure and the limiting speed that gives the least pressure; the first one at a strain-rate of 5 × 10⁻⁴ s-4 in the ductile range and the second at 10-2 S-1 at the beginning of the pure brittle fracture. In applications with drifting ice, it can be seen that velocities of impact would normally be high enough to produce fracture in the brittle manner. The possibility of the maximum pressure occurring in the ductile range seems to be remote and limited only to the case of small-speed movements of large ice fields set up by the wind.
TABLE IV. CRITICAL RATES OF ADVANCE OF ICE

5.4. Aspect-ratio effect
Four tests were made specifically to study the influence of the aspect ratio b/h at a constant effective strain-rate. The results are shown on Table I.
The dispersion of results is small and they show essentially that the strength in indentation is independent of the aspect ratio b/h for this condition of constant strain-rate.
This is different from what has been reported by previous authors and the reason is that they have investigated the aspect ratio effect at constant rates of indentation instead of constant strain-rates.
If we try to represent our results at a constant rate of indentation V 0, we would have with Equations (4) and (8):
If we introduce the strain-rate effect into a new coefficient C’ and we compare its value with that of empirical Equation (3) where C‘ = 2.45 for b 0/h = 1, Equation (11) becomes:
The comparison between Equation (12) which represents our results and that of Equation (3) which represents most of the other investigators’ results, is shown on Figure 11. They are essentially the same, so that effect can be directly explained by the dependence of the strength of ice on the strain-rates.

Fig. 11. Influence of the aspect ratio b/h on the indentation coefficient C:--- Reference Afanas’yevAfanes’yev and others (1971), ——— present study.
6. Conclusion
The results of this experimental investigation tie in nicely with those of others and enable us to get a clear understanding of the mechanism of failure and of the values of indentation pressures which have been the object of discussion in the past.
The major factor that effects the behaviour of ice at failure is the rate of deformation. With a new definition of the effective strain-rate it is possible to express directly the indentation strength in the ductile range as a function of the uniaxial crushing strength of the ice with the theory of a perfectly plastic material which flows directly underneath the indentor. The maximum indentation pressure is obtained for the same strain-rate for which ice under uniaxial compression has its maximum yield strength and then there is a similar transition from the ductile to the brittle behaviour. For rates higher than about 10-2 S-1 failure under indentation changes completely in character and the ice is destroyed by peeling on both sides of the plate and local crushing under the indentor. This leads to a decrease in indentation pressure to about two-thirds of the value of the maximum pressure. Furthermore, for incomplete contact, the reduction in pressure in the brittle range can be as much as 80%.
Although no ratio effect can be found for indentor widths over 25 mm, there is some question as to the possibility of extrapolating to the real size where the ice is far from perfect and the uniaxial strength varies with the ice thickness. Furthermore, any vertical instability of a floating ice sheet would cause the ice to buckle before the maximum load could be attained. In the field, load would develop only with very slow ice movements which seem possible only when a large ice field is free to move with the wind. For normal drifting ice on rivers and in the sea the indentation pressure drops considerably in the brittle range. Thus it is of the highest importance that this sudden change in behaviour of the ice with a large reduction in pressure be verified in the field and fully investigated.
Discussion
F. D. HAYNES: Recent tests on polycrystalline isotropic ice have produced high values for uniaxial compressive strength. In Fact, these strength values are about double the values you show in the transition and brittle ranges on your universal curve. Would you expect the strength of columnar (polycrystalline, orthotropic) ice to peak and plateau in the transition and brittle ranges when polycrystalline (isotropic) ice does not?
B. MICHEL: We have some tests on two types of isotropic ice which are P1, snow ice and S4 congealed frazil ice. Both ices with smaller grains have shown higher values of uniaxial crushing strength than S2 columnar ice but they have also shown essentially the same phenomenon of transition from ductile to brittle behaviour with an intermediate zone where the ice may fail either in one mode of the other. As the strain-rate increased, the probability of ice failing in the ductile range at higher and higher strengths decreases considerably, so that eventually you have only brittle fractures at lower strengths.


