


Introduction
Snow crystals exhibit a variety of morphological changes which are driven by fundamentally different thermodynamic conditions. During growth in the atmosphere the problem can be well described by an isolated crystal in a supersaturated environment, which is a classical problem of single-crystal growth (Reference SaitoSaito, 1996). If the orientation of the crystal is taken into account, growth velocities can be measured on the singular surfaces (Reference LibbrechtLibbrecht, 2003) and the snow morphology or Nakaya diagram (Reference Furukawa and WettlauferFurukawa and Wettlaufer, 2007) can be reasonably well explained in terms of temperature, supersaturation and crystal properties (see Reference LibbrechtLibbrecht, 2005, for a review). If these non-equilibrium growth forms are deposited on the ground to form a seasonal snowpack the crystals no longer evolve in isolation. Structural correlations may be built up during atmospheric aggregation (Reference Westbrook, Ball, Field and HeymsfieldWestbrook and others, 2004) or during deposition on the ground (Reference Löwe, Egli, Bartlett, Guala and ManesLöwe and others, 2007). The subsequent evolution of the deposit is dominated by collective behavior of the crystal packing on different length scales. A unique characteristic of this packing is its bicontinuous nature, where both phases (ice and vapor) occupy a singly connected region in space. Gravity does not permit isolated ice crystals or isolated pores, i.e. vapor bubbles do not emerge until bubble close-off at volume fractions of ∼0.9 (Reference Arnaud, Barnola, Duval and HondohArnaud and others, 2000). The simplest cases of thermodynamic conditions are isothermal conditions where the relaxation to equilibrium is commonly referred to as isothermal metamorphism.
Previous work on isothermal metamorphism focused on possible transport mechanisms for the origin of interfacial relaxation (see Reference BlackfordBlackford, 2007, for a review). It is widely believed that evaporation/condensation of vapor is the dominant process of mass transport (Reference DominéDominé and others, 2003; Reference Legagneux, Taillandier and DominéLegagneux and others, 2004; Reference Legagneux and DominéLegagneux and Dominé, 2005). The dynamical evolution of ice morphology is then usually characterized in terms of specific surface area, which is the interfacial area of the ice/vapor interface per ice volume (Reference DominéDominé and others, 2003; Reference Flin, Brzoska, Lesaffre, Coléou and PieritzFlin and others, 2003; Reference Legagneux, Taillandier and DominéLegagneux and others, 2004; Reference Kaempfer and SchneebeliKaempfer and Schneebeli, 2007). Sometimes an ice thickness is used (Reference Kaempfer and SchneebeliKaempfer and Schneebeli, 2007), which is derived from a pore-size distribution of the ice phase. Another quantity monitored during isothermal metamorphism is the mean curvature (Reference Flin, Brzoska, Lesaffre, Coléou and PieritzFlin and others, 2003, Reference Flin, Brzoska, Lesaffre, Coléou and Pieritz2004). The evolution of the aforementioned quantities is then related to grain growth (Reference Legagneux, Taillandier and DominéLegagneux and others, 2004), sintering theory (Reference Kaempfer and SchneebeliKaempfer and Schneebeli, 2007) or a mean-field approach (Reference Legagneux and DominéLegagneux and Dominé, 2005), which is closely related to the Lifshitz–Slyozov–Wagner (LSW) theory of Ostwald ripening (Reference Lifshitz and SlyozovLifshitz and Slyozov, 1961; Reference WagnerWagner, 1961).
The majority of concepts put forward for isothermal metamorphism have two main shortcomings. First, LSWtype approaches usually employ a geometry which consists of spheres and neglects the bicontinuous nature of the ice matrix in snow. This makes it difficult to relate deviations of experiments from theory, either to deficiencies of the ice-phase geometry or to deficiencies of the physics which underlies LSW. Second, neither of the quantities employed to characterize the dynamics can detect anisotropic behavior. In view of the fact that gravity breaks the symmetry between vertical and horizontal directions, there is a demand for an orientation-dependent characterization which addresses the interplay between gravitational and surface energy. Though the recent Monte Carlo approach (Reference Vetter, Sigg, Singer, Kadau, Herrmann and SchneebeliVetter and others, 2010) does not have geometrical limitations, its comparison with experiments is still based on nondirectional quantities, such as the surface area or the ice thickness. There is a need to develop more distinguishing measures of isothermal metamorphism to provide a benchmark for theoretical models.
To contribute in this direction, we address isothermal metamorphism from a different perspective. The focus of the present paper is an anisotropic, multiple-scale characterization of isothermal metamorphism by means of spatial fluctuations of the microscopic density, or phase field, ϕ(x, t), as a function of position, x, and time, t. We employ Xraytomographyto measure ϕ(x, t) with high spatial resolution throughout an entire year for different temperatures, and take the novel approach of characterizing the dynamics by the anisotropic two-point correlation function. To strictly control the initial conditions, we use laboratory snow with crystals grown from vapor which are subsequently deposited into sample holders by sieving. By comparing the evolution of various length scales we are able to identify relevant scales and their interaction from different relaxation mechanisms during metamorphism.
This paper is organized as follows: The experimental setup is described in the next section. In the following section we describe our conceptual starting point. Subsequently we provide definitions of the correlation function and a thickness distribution and define various length scales. The measurement results for all quantities are then presented, followed by conclusions and suggestions for future work in the final section.
Experiments
Our general experimental set-up for the X-ray tomography follows Reference Kaempfer and SchneebeliKaempfer and Schneebeli (2007), with two important differences for the sample handling: (1) the isothermal storage was further improved to minimize the effect of predominant temperature gradients and (2) laboratory-generated new snow was used to guarantee similar initial conditions for the snow samples at different temperatures. Details are given below.
Snow sample preparation
All snow samples were prepared from laboratory snow which was produced in a simple snowmaker, with a design that basically follows Reference NakamuraNakamura (1978). A heated water reservoir is kept at a temperature of T = 30°C in a cold room environment at T = −25°C. The humid air above the water surface is continuously advected by a fan into a box at ambient temperature, where the vapor precipitates on thin nylon wires which serve as growth nuclei. By varying air and water temperature the method is able to qualitatively reproduce growth modes and crystal habits predicted by the Nakaya diagram (Reference Furukawa and WettlauferFurukawa and Wettlaufer, 2007). The ambient temperature in the vicinity of the wires was T ≈ −18°C and under these conditions growth is mainly dendritic. Snow crystals are periodically harvested from the wires by automatic vibration. The manufactured snow powder compact had a density ρ ≈ 172 kg m−3. With an ice density ρ ice = 917 kg m−3 this amounts to an initial volume fraction ϕ i = 0.188. The snow was stored for 24 hours at −25°C to allow for moderate, initial sintering of the crystals. Using a sieve with a mesh size of 2 mm, the snow was sieved into cylindrical sample holders (Fig. 1) until they were completely filled. The snow was then slowly compressed to provide space for the seal and avoid local densification of the top part when the seal was inserted. Before sealing, a small (0.2 g) aluminium weight was placed on top of the sieved snow to provide a reference line for the snow surface in the sample holder. There was always a gap between the aluminium plate and the seal, which increased throughout the experiment due to densification. For the seal we used a low-density polyethylene cap to avoid sublimation and obtain a closed system with respect to mass exchange.

Fig. 1. Schematic of the cylindrical tomography sample holder.
Sample storage
Overall, three identical snow samples under three different isothermal conditions (−3, −9 and −19°C) were examined using microcomputed-tomography scanning over the course of 1 year. To improve the isothermal conditions, the storage boxes used by Reference Kaempfer and SchneebeliKaempfer and Schneebeli (2007) were adapted to reduce thermal gradients. The storage boxes are constructed using layers of highly insulating and highly conducting materials. The highly conducting material with high heat capacity (steel) prevents the build-up of a temperature inversion in the air, and eliminates temperature fluctuations. From the inside out, the packaging was constructed as follows: The sample cylinders were fixed in a StyrofoamTM mask inside a steel cylinder with 1 cm thick walls. The steel cylinders were capped from both sides with 1 cm thick steel lids. This steel cover was packed into a small Styrofoam box with 5 cm thick walls. The box was again surrounded by 5 mm thick steel plates and then enclosed in a vacuum-insulated box. The improvement over the previous storage box was an additional conducting layer and the vacuum-insulated box in the packaging. The temperature was recorded inside each steel cylinder by two temperature sensors (iButtons DS1922L). These sensors have an accuracy of ±0.5°C (from −10 to +65°C) and a resolution of 0.0625°C. They were calibrated before the measurements. Recorded temperatures were almost constant, with mean values and standard deviations of T = −3.7±0.7°C (sample 1), T = −9.5 ± 0.1°C (sample 2) and T = −18.6 ± 0.8°C (sample 3). This corresponds to homologous temperatures of 0.99, 0.97 and 0.93.
Tomography
At the beginning of the experiment each sample is measured at ∼3 week intervals. Since the evolution slows down during the experiment (Reference Kaempfer and SchneebeliKaempfer and Schneebeli, 2007) we decreased the measuring frequency in the late stage of the experiment. For measurements the samples were transported from the storage room in a small Styrofoam box. The computed-tomography (CT) scanning (micro-CT 80, Scanco) was done with a nominal resolution (pixel size) of 10 μm and a modulation transfer function at 10% contrast level of 12.4 μm. The scanning region was fixed in space at 13 mm height from the bottom of the sample holder (Fig. 1). The height of the scanning region was 5.2 mm (520 voxels). The CT chamber was kept close to the nominal storage temperatures (−3, −9 and −19°C). After measurement the sample was placed in the transport box and returned to the storage box.
From the attenuation image of the scanned region a cube of 5203 voxels = 5.2 mm3 was extracted (Fig. 1), which was twice as large as the representative volume of 1–2 mm for the considered properties (Reference Kaempfer, Schneebeli and SokratovKaempfer and others, 2005). The grayscale images were filtered using a Gaussian filter with a kernel size of 53 and standard deviation of 1.2 voxels to improve the signal-to-noise ratio. A binary image was then obtained by segmentation of the filtered data. A single segmentation threshold was used for all images. This threshold was the average over thresholds determined for each sample individually such that its density was matched.
Theoretical Background
Phase-ordering dynamics
Isothermal metamorphism of snow can be conveniently described (Reference Legagneux and DominéLegagneux and Dominé, 2005) by coarsening following the basic principles of the LSW theory of Ostwald ripening (Reference Lifshitz and SlyozovLifshitz and Slyozov, 1961; Reference WagnerWagner, 1961). The LSW idea can be summarized as mass transport between spheres of different radii, driven by chemical potential differences due to the Gibbs–Thompson condition. (For details and variants of LSW see Reference Ratke and VoorheesRatke and Voorhees, 2002.) The LSW theory assumes an assembly of spheres which imposes a severe limitation on admissible microstructural geometries. As a consequence, apparent deviations of experiments from theory cannot be unambiguously traced back either to deficiencies of the ice-phase geometry or to deficiencies of the physics which underlie LSW. It is therefore desirable to discuss isothermal metamorphism of snow in a wider context, where the geometrical constraints can be relaxed.
It has long been recognized that Ostwald ripening is a particular example of coarsening which can be found in many systems undergoing phase ordering or phase separation (see Reference BrayBray, 1994, and references therein). In this context the dynamics of phase morphologies is studied via evolution equations for a so-called ‘order parameter field’ which describes the spatio-temporal distribution of the phases. For dry snow the phases are solid ice and vapor and a suitable order parameter is a phase-field function, ϕ, attaining ϕ = 1 in the ice phase and ϕ = −1 in the vapor phase (Reference Kaempfer and PlappKaempfer and Plapp, 2009). The most prominent phase-field models are the Cahn–Hilliard or Allen–Cahn equations, which describe the dynamics of a conserved or nonconserved order parameter, respectively (Reference Balluffi, Allen and CarterBalluffi and others, 2005). The terminology discriminates whether or not phase changes, as described by an order parameter, are locally constrained by a conservation law. Though these models provide a highly idealized starting point, they essentially contain the same physics as LSW (Reference WangWang, 2008) and can be applied to arbitrary microstructures. Thus results obtained for these phase-field models are also of relevance for isothermal metamorphism.
In general, the dynamics of microstructures is characterized by evolving length scales. This is often employed via a growth form, R(t) z − R(0) z = Kt (Reference GowGow, 1969; Reference Legagneux, Taillandier and DominéLegagneux and others, 2004) for the mean radius, R(t), in terms of the growth rate, K, and an exponent, z (which we refer to as the ‘dynamic exponent’ hereafter). This form is a characteristic of the LSW analysis, and there is no a priori justification for a generalization to l(t) z − l(0) z = K’t for different length scales, l, with a different rate, K’, in arbitrary microstructures. We note, though, that this generalization works reasonably well for the ice thickness in the work of Reference Kaempfer and SchneebeliKaempfer and Schneebeli (2007). Henceforth, however, we restrict ourselves to the power-law form, l ∼ t 1/z , which can be likewise inferred for long times from the LSW growth law given as R(t) ∼ t 1/z .
It is widely accepted (Reference BrayBray, 1994) that the value of the dynamic exponent, z, is essentially dependent on whether the order parameter is conserved or nonconserved. In either case, all length scales, l, will evolve with the same power law, l ∼ t 1/ z , for long times, where z = 3 for Cahn–Hilliard (conserved) and z = 2 for Allen–Cahn (nonconserved) dynamics. These two cases correspond precisely to the two cases addressed in LSW theory, namely transport limited by surface kinetics and diffusion in the gas phase. Both cases are treated by Reference Lifshitz and SlyozovLifshitz and Slyozov (1961), whereas Reference WagnerWagner (1961) considers only the kinetics-limited case. A crossover between these cases can be achieved by a variation of either the diffusion constant of vapor or the kinetic coefficient (Reference LibbrechtLibbrecht, 2005) which controls the attachment kinetics of vapor molecules on the ice surface. The observed crossover between z = 2 and z = 3 in the mean-field model (Reference Legagneux and DominéLegagneux and Dominé, 2005) triggered by a variation of the kinetic coefficient is thus a direct implication of the underlying universality classes of conserved or nonconserved dynamics.
It is interesting that both exponents have also been verified in simulations of the Cahn–Hilliard or Allen–Cahn equations for coarsening of bicontinuous structures (Reference Kwon, Thornton and VoorheesKwon and others, 2007). In both cases the so called ‘dynamic scaling’ hypothesis has been verified. This means that in either case the system is truly characterized by a single length scale, l ∼ t 1/z . Given the connection of Cahn–Hilliard or Allen–Cahn dynamics to snow metamorphism, three main implications can be drawn from Reference Kwon, Thornton and VoorheesKwon and others (2007): (1) the bicontinuous nature of the ice matrix has no a priori influence on the exponents (they are not a distinctive feature of the approximation of the geometry by spheres used in LSW theory); (2) the evolution of snow should be governed by z = 2 or z = 3 if no additional mechanisms play a role besides those contained in LSW; (3) any of the commonly investigated quantities, such as specific surface area, mean or Gaussian curvature or ice thickness, can be used in the same way as the characteristic length scale. All should evolve with the same power-law exponent, z.
Indeed we expect that snow displays deviations from this idealized dynamics. This is a consequence of emerging, competing length scales. The origin of additional scales can roughly be distinguished by the following cases: (1) transient behavior from initial conditions which may involve a wide distribution of persistent length scales and (2) the emergence of additional physical mechanisms beyond LSW. Signatures of different competing length scales can easily be detected by the behavior of length distribution functions. If these distributions are rescaled by their time-dependent mean but fall onto a single master curve (data collapse), different length scales must evolve under different dynamics. This has been observed by Reference Legagneux and DominéLegagneux and Dominé (2005) for the curvature distribution in snow. This breakdown of dynamic scaling may, however, be due to either case 1 or 2 mentioned above.
It is thus inevitable that a scale-dependent characterization of the microstructure must be used, which can be objectively defined for bicontinuous media. Though interfacial curvature distributions are popular (Reference Mendoza, Alkemper and VoorheesMendoza and others, 2005) and have been applied to snow (Reference Legagneux and DominéLegagneux and Dominé, 2005), the interpretation of the observed absence of data collapse and the inclusion of anisotropic behavior is rather difficult. We therefore follow the traditional route of characterizing heterogeneous systems and investigate the equal-time, two-point correlation function of the microscopic density which has been widely used to characterize random media (Reference TorquatoTorquato, 2002). The long tradition of using the correlation function for disordered systems stems from the fact that its Fourier transform is directly accessible via the scattering intensity obtained from small-angle scattering (Reference Debye and BuecheDebye and Bueche, 1949). This relation to scattering intensity is also the foundation of the applicability of the correlation function to optical properties of snow (Reference Vallese and KongVallese and Kong, 1981; Reference MätzlerMätzler, 1998; Reference Wang, Pulliainen and HallikainenWang and others, 1998). For snow optics, the correlation function is required to interpret scattering from remote-sensing or field measurements. The correlation function has also been used for stochastic reconstruction of snow microstructure to study mechanical properties of high-density snow (Reference Yuan, Lee and GuilkeyYuan and others, 2010).
Two-point correlation function
For time-dependent, continuous mass distributions the microscopic density is defined in terms of the phase indicator function, ϕ i(x, t), of the ice phase, which is defined by ϕ i(x, t) = 1, if at time t the three-dimensional position vector, x, lies in the ice phase and zero otherwise. The microscopic mass density, ρ i(x, t), is related to ϕ i by the intrinsic density of ice (ρ ice = 917 kg m−3) via
The simplest first-order statistical quantity of a two-phase random medium is its volume fraction
where the overbar denotes ensemble averaging. Practically, we replace ensemble averages with volume averages and thus implicitly assume a statistically homogeneous system. The simplest, higher-order statistical quantity of a random, two-phase medium is given by the equal-time, two-point correlation function
which characterizes spatial fluctuations of the density around the mean. Note that r is a vector, so we explicitly account for anisotropic behavior. Below we restrict ourselves to the behavior along different Cartesian-coordinate directions with unit vector e α , α = x, y, z, and define Cα (r, t) = C(r e α , t).
We note that a link to common microstructure parameters can be established via the expansion of the correlation function at the origin. In the isotropic case, for smooth interfaces the expansion
is determined by the volume fraction, φ
i, the surface area per unit volume, s, the average squared mean curvature,
![]() , and the average Gaussian curvature,
, and the average Gaussian curvature,
![]() (Reference Kirste and PorodKirste and Porod, 1962; Reference TorquatoTorquato, 2002). Higher-order terms have been omitted in the expansion, as indicated by the Landau symbol,
(Reference Kirste and PorodKirste and Porod, 1962; Reference TorquatoTorquato, 2002). Higher-order terms have been omitted in the expansion, as indicated by the Landau symbol,
![]() . The expansion reveals that the volume fraction and the specific surface area can only characterize spatial density fluctuations for small distances and thus provide only limited insight into the snow structure.
. The expansion reveals that the volume fraction and the specific surface area can only characterize spatial density fluctuations for small distances and thus provide only limited insight into the snow structure.
In order to characterize the dynamics quantitatively, we derive various length scales from the two-point correlation function. For purposes that will become clear below, we follow Reference Lipshtat and MeersonLipshtat and Meerson (2002) and employ the normalized function, C(r, t)/C(0, t), and define a length scale from its slope at the origin via

From the expansion of the correlation function (Equation (4)) we can infer that for isotropic media in spatial dimension d = 3 the length scales, lα
(t), are related to the surface area, s per unit volume, through
![]() for α = x, y, z (e.g. Reference TorquatoTorquato, 2002). Henceforth the lα
are referred to as interfacial correlation lengths. Since they determine the behavior of the correlation function at the origin, we refer to them as a characteristic on the smallest scales.
for α = x, y, z (e.g. Reference TorquatoTorquato, 2002). Henceforth the lα
are referred to as interfacial correlation lengths. Since they determine the behavior of the correlation function at the origin, we refer to them as a characteristic on the smallest scales.
If optical properties are considered, the correlation function of snow is usually only parameterized by a single length scale (Reference Wang, Pulliainen and HallikainenWang and others, 1998; Reference MätzlerMätzler, 2002), which is obtained from a fit of the correlation function to a single-scale form (e.g. an exponential). In the following we are instead guided by microstructures of disordered, bicontinuous systems. During phase ordering (Reference Fratzl and LebowitzFratzl and Lebowitz, 1989) a damped oscillatory form,
is predicted. The same form is also found in bicontinuous microemulsions where it is usually referred to as the Teubner–Strey form (Reference Teubner and StreyTeubner and Strey, 1987). In addition to the interfacial correlation length, l ∼ s −1, it involves another length scale, l 0. The latter determines the first zero-crossing of the correlation function, C(l 0) = 0, which is usually interpreted as a typical domain size.
In view of the two-scale approximation for bicontinuous microemulsions (Equation (6)) we additionally define the first zero-crossing,
as another characteristic length scale, which is henceforth referred to as the structural correlation length. Contrary to the interfacial correlations which determine correlations on the smallest scales (at the origin), we refer to this structural correlation length as a characteristic of larger scales.
Finally, we define the ratio of ice volume and surface area as an additional length scale
This is simply the inverse of the specific surface area, i.e. the surface area per ice volume, which is commonly used in studies of snow metamorphism.
Thickness distribution
To compare this study with previous work, we also employ another commonly used distribution of length scales for porous media, p th(r, t), defined by Reference Hildebrand and RüegseggerHildebrand and Rüegsegger (1997) as a thickness distribution. Its definition deviates from the common pore-size distribution (Reference TorquatoTorquato, 2002) and can be written as
where r max(x) is the radius of the largest sphere that (1) contains the point x (not necessarily as its center) and (2) is itself contained completely in the ice phase. Note that this definition of the distribution provides an implicit definition of thickness via r max. An important implication of the thickness definition is revealed by the following example. Consider a collection of non-overlapping spheres of radius r 0 which indeed implies a Dirac thickness distribution pth(r) = δ(r ∼ r 0). If the material contained in the spheres is reshaped (under volume conservation) to long cylinders of radius r0 which are terminated by hemispherical caps at both ends, the thickness distribution remains invariant. This property will be important later when discussing the behaviour of the thickness distribution.
As a characteristic length scale of the thickness distribution we use its mean value, given by

Results
Overview
The structural analysis of the snow samples is evaluated within the (5.2 mm)3 cubic subsets (Fig. 1). With a voxel size of 10 μm this leads to lattice sizes of 5203 voxels. A visual impression of the three-dimensional evolution of the ice matrix is shown in Figure 2. The samples evolve from bicontinuous, highly branched, fresh snow in the initial conditions to a bicontinuous, rounded structure. Warmer samples evolve faster than colder samples.
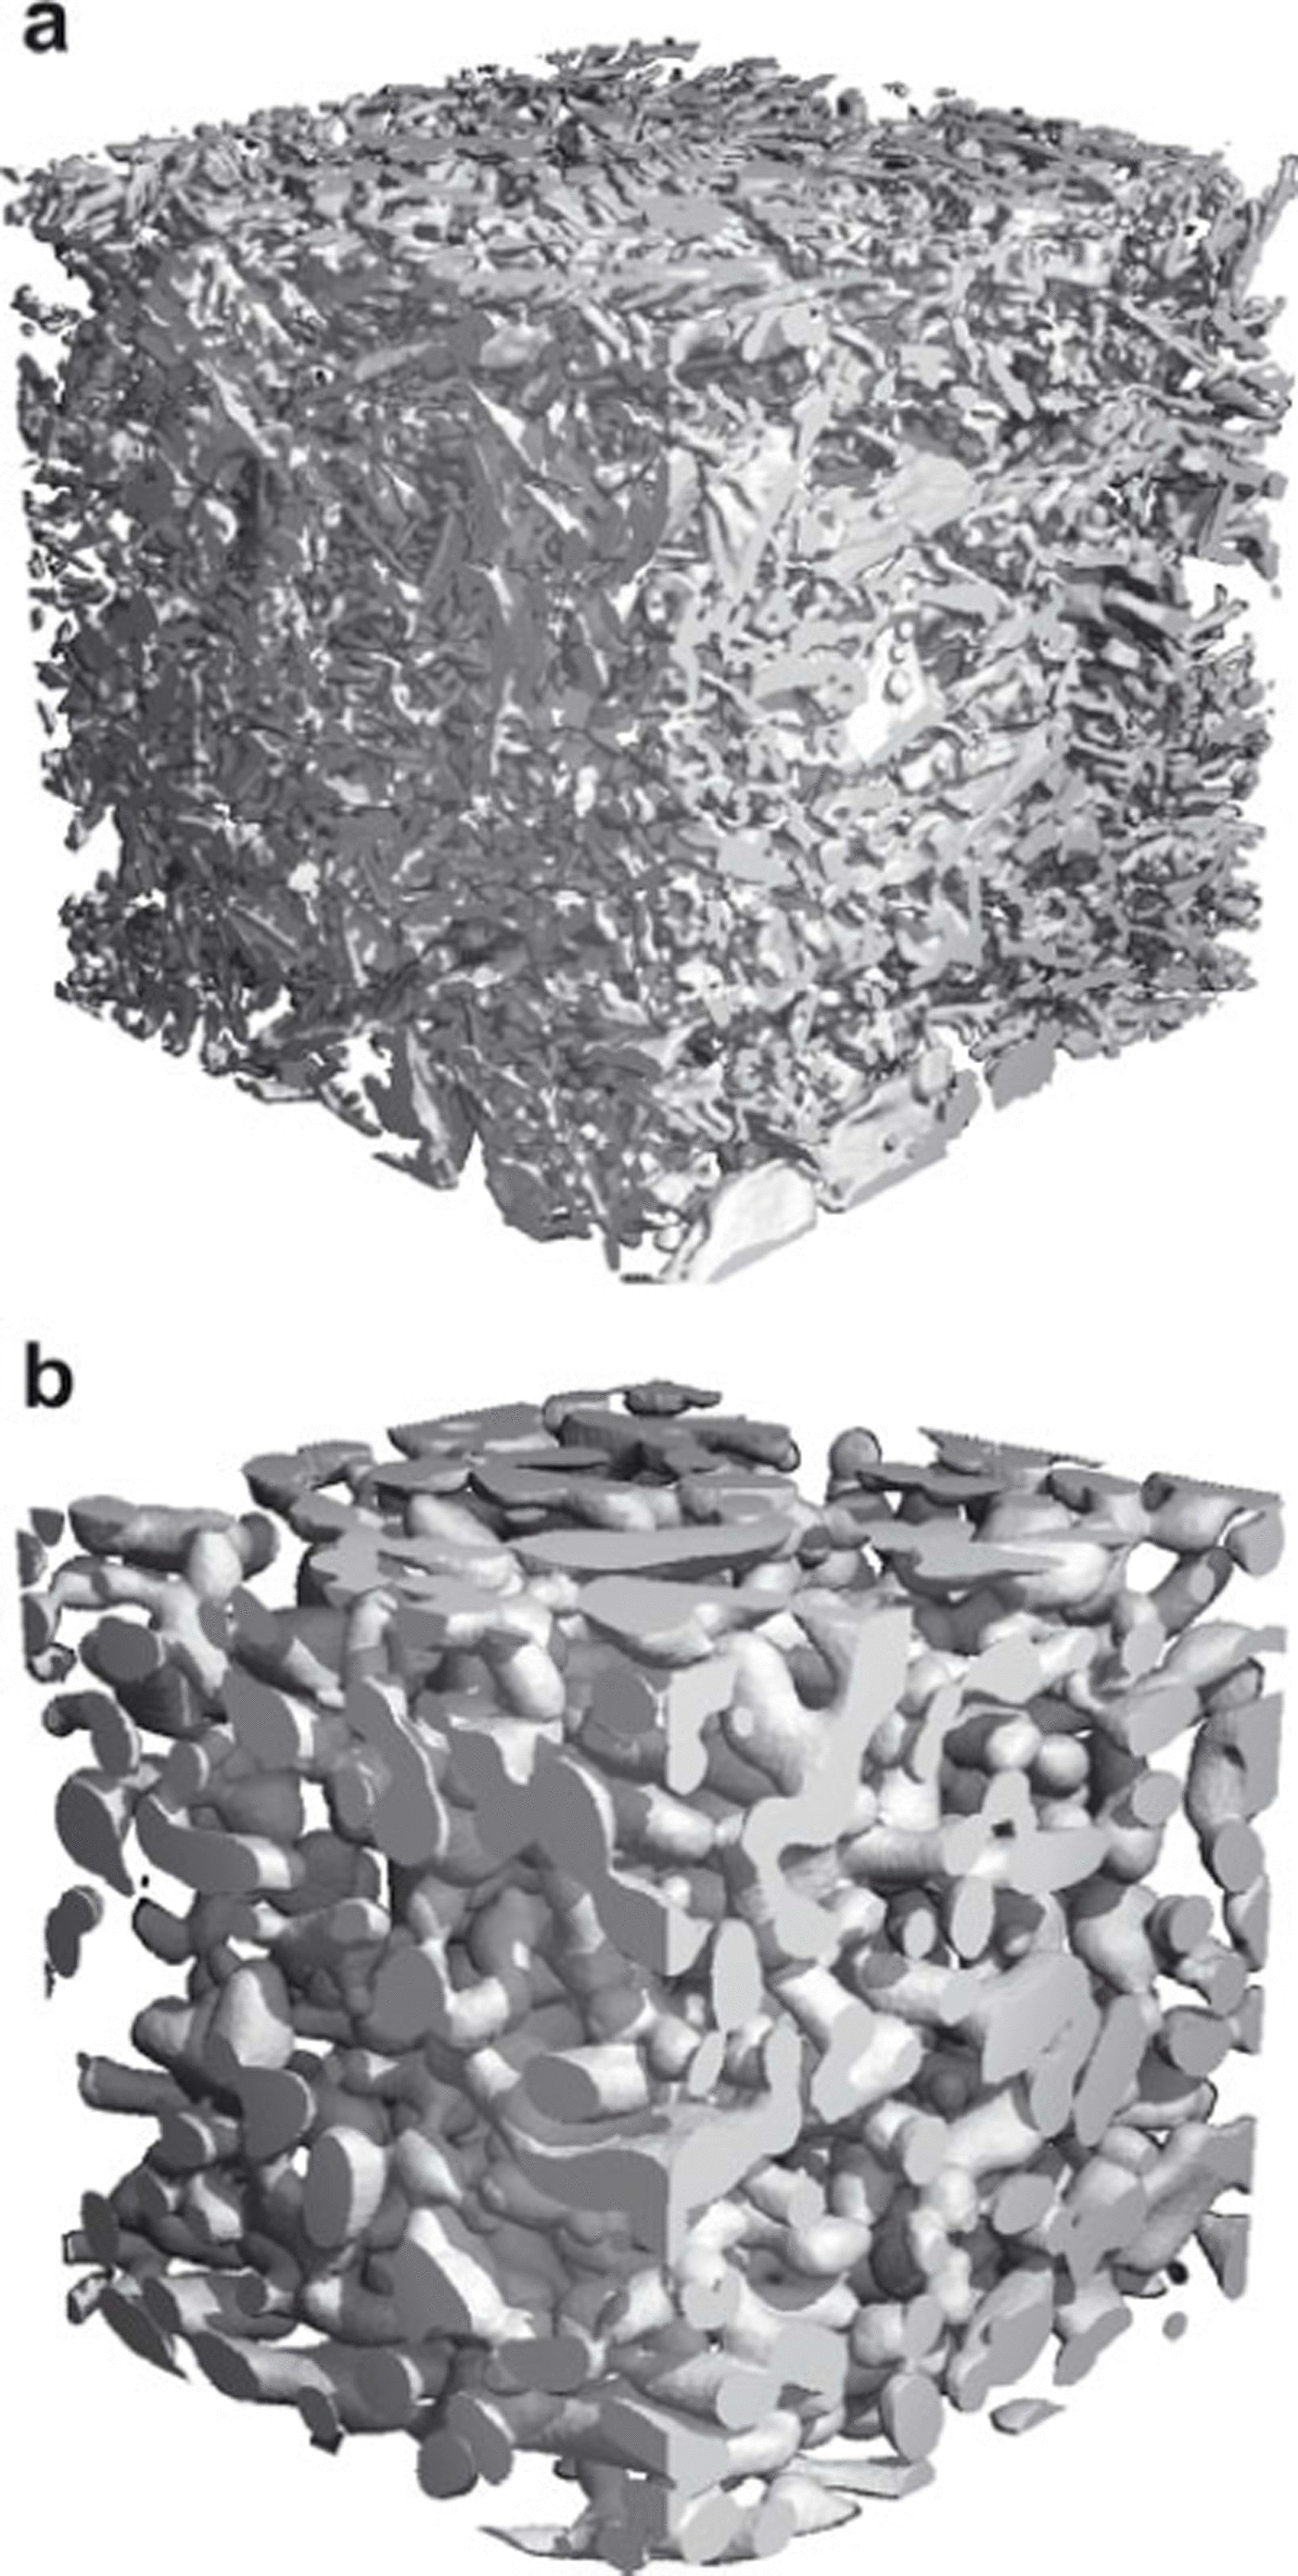
Fig. 2. Qualitative evolution of a snow cube at T = −3°C, (a) at the beginning and (b) at the end, after almost 1 year. The length of the cube is 5.2 mm.
Density
The evolution of the volume fraction (Equation (2)) of the samples is shown in Figure 3. Note the log–log scale and a guide to the eye from fitting given as a reference for a possible power-law evolution at the late stage. However, the experimental data suggest deviations from a straight line caused by modulations.

Fig. 3. Temporal evolution of the volume fraction, ϕi(t), at all temperatures.
Two-point correlation function
Scaling
Here we follow Reference Lipshtat and MeersonLipshtat and Meerson (2002) and normalize the correlation function (Equation (3)) by the value at the origin, Cα (r, t)/Cα (0, t). The evolution of the two-point correlation function, Cx(r, t), at T = −3°C is given in Figure 4. All samples clearly display a cusp at the origin which indicates linear behavior of Cα (r, t)/Cα (0, t) − 1 on the smallest scales. This is known as the Porod law (Reference BrayBray, 1994), and indicates a smooth ice/vapor interface on the scale of 10 μm throughout the entire experiment. The smooth appearance of the interface on these scales has been confirmed by a comparison between X-ray tomography and gas absorption derived surface area (Reference Kerbrat, Pinzer, Huthwelker, Gäggeler, Ammann and SchneebeliKerbrat and others, 2008). We expect the accuracy of the surface area estimate at the start of the experiment to be better than the estimates for fresh snow of Reference Kerbrat, Pinzer, Huthwelker, Gäggeler, Ammann and SchneebeliKerbrat and others (2008) since our CT resolution was higher.

Fig. 4. Evolution of Cx (r, t) at T = −3°C for different times (h). On a linear scale the evolution at all temperatures appears to be similar.
Next we consider the possibly anisotropic, dynamic scaling and rescale Cα (r, t) by the correlation lengths, lα (t), which are obtained by fitting the cusp at the origin against Cα (r, t)/Cα (0, t) = 1 − r/lα (t). These slopes increase over time, revealing a coarsening of the structure. From the perspective of dynamic scaling, the results at T = −9°C cannot be distinguished from those at T = −3°C, so we concentrate on the comparison between T = −3 and T = −19°C. In addition, at both temperatures the x- and y-directions can be regarded as equivalent, so we concentrate on the comparison between the x- and z-directions. We explicitly note that z is the direction of gravity.
The results for the rescaled correlation functions at high temperature, T = −3°C, are given in Figure 5, and for the low temperature, T = −19°C, in Figure 6. All plots are on a log–log scale. On a linear scale it usually remains unrevealed that the rescaled correlation functions do not fall onto a single master curve (data collapse). At the largest scales, the small number of available data points gives rise to poor statistics and an apparent stochastic behavior. However, important qualitative conclusions can be immediately drawn from the overall behavior of the correlation function at smaller scales. For both temperatures a reasonable data collapse in the z-direction is established after a short time and extends beyond the first zero-crossing, which is above r/lα (t) ≈ 1. The zero-crossings are located in the first gap of the data in Figures 5 and 6 in the logarithmic plot. A quantitative evaluation of the zero-crossings will be presented subsequently. In contrast to the z-direction, the data collapse in the x-direction is poor and hardly extends beyond r/lα (t) ≈ 1. The quality of scaling is only comparable with that in the z-direction at a very late stage, i.e. after almost 1 year. The overall rescaling behavior of C is poor in all cases, indicating the absence of dynamic scaling and the existence of different relevant length scales.

Fig. 5. Rescaled two-point correlation functions at T = −3°C for different times (h): (a) horizontal direction, C x, and (b) vertical direction, C z. The behavior at T = −9°C is similar.
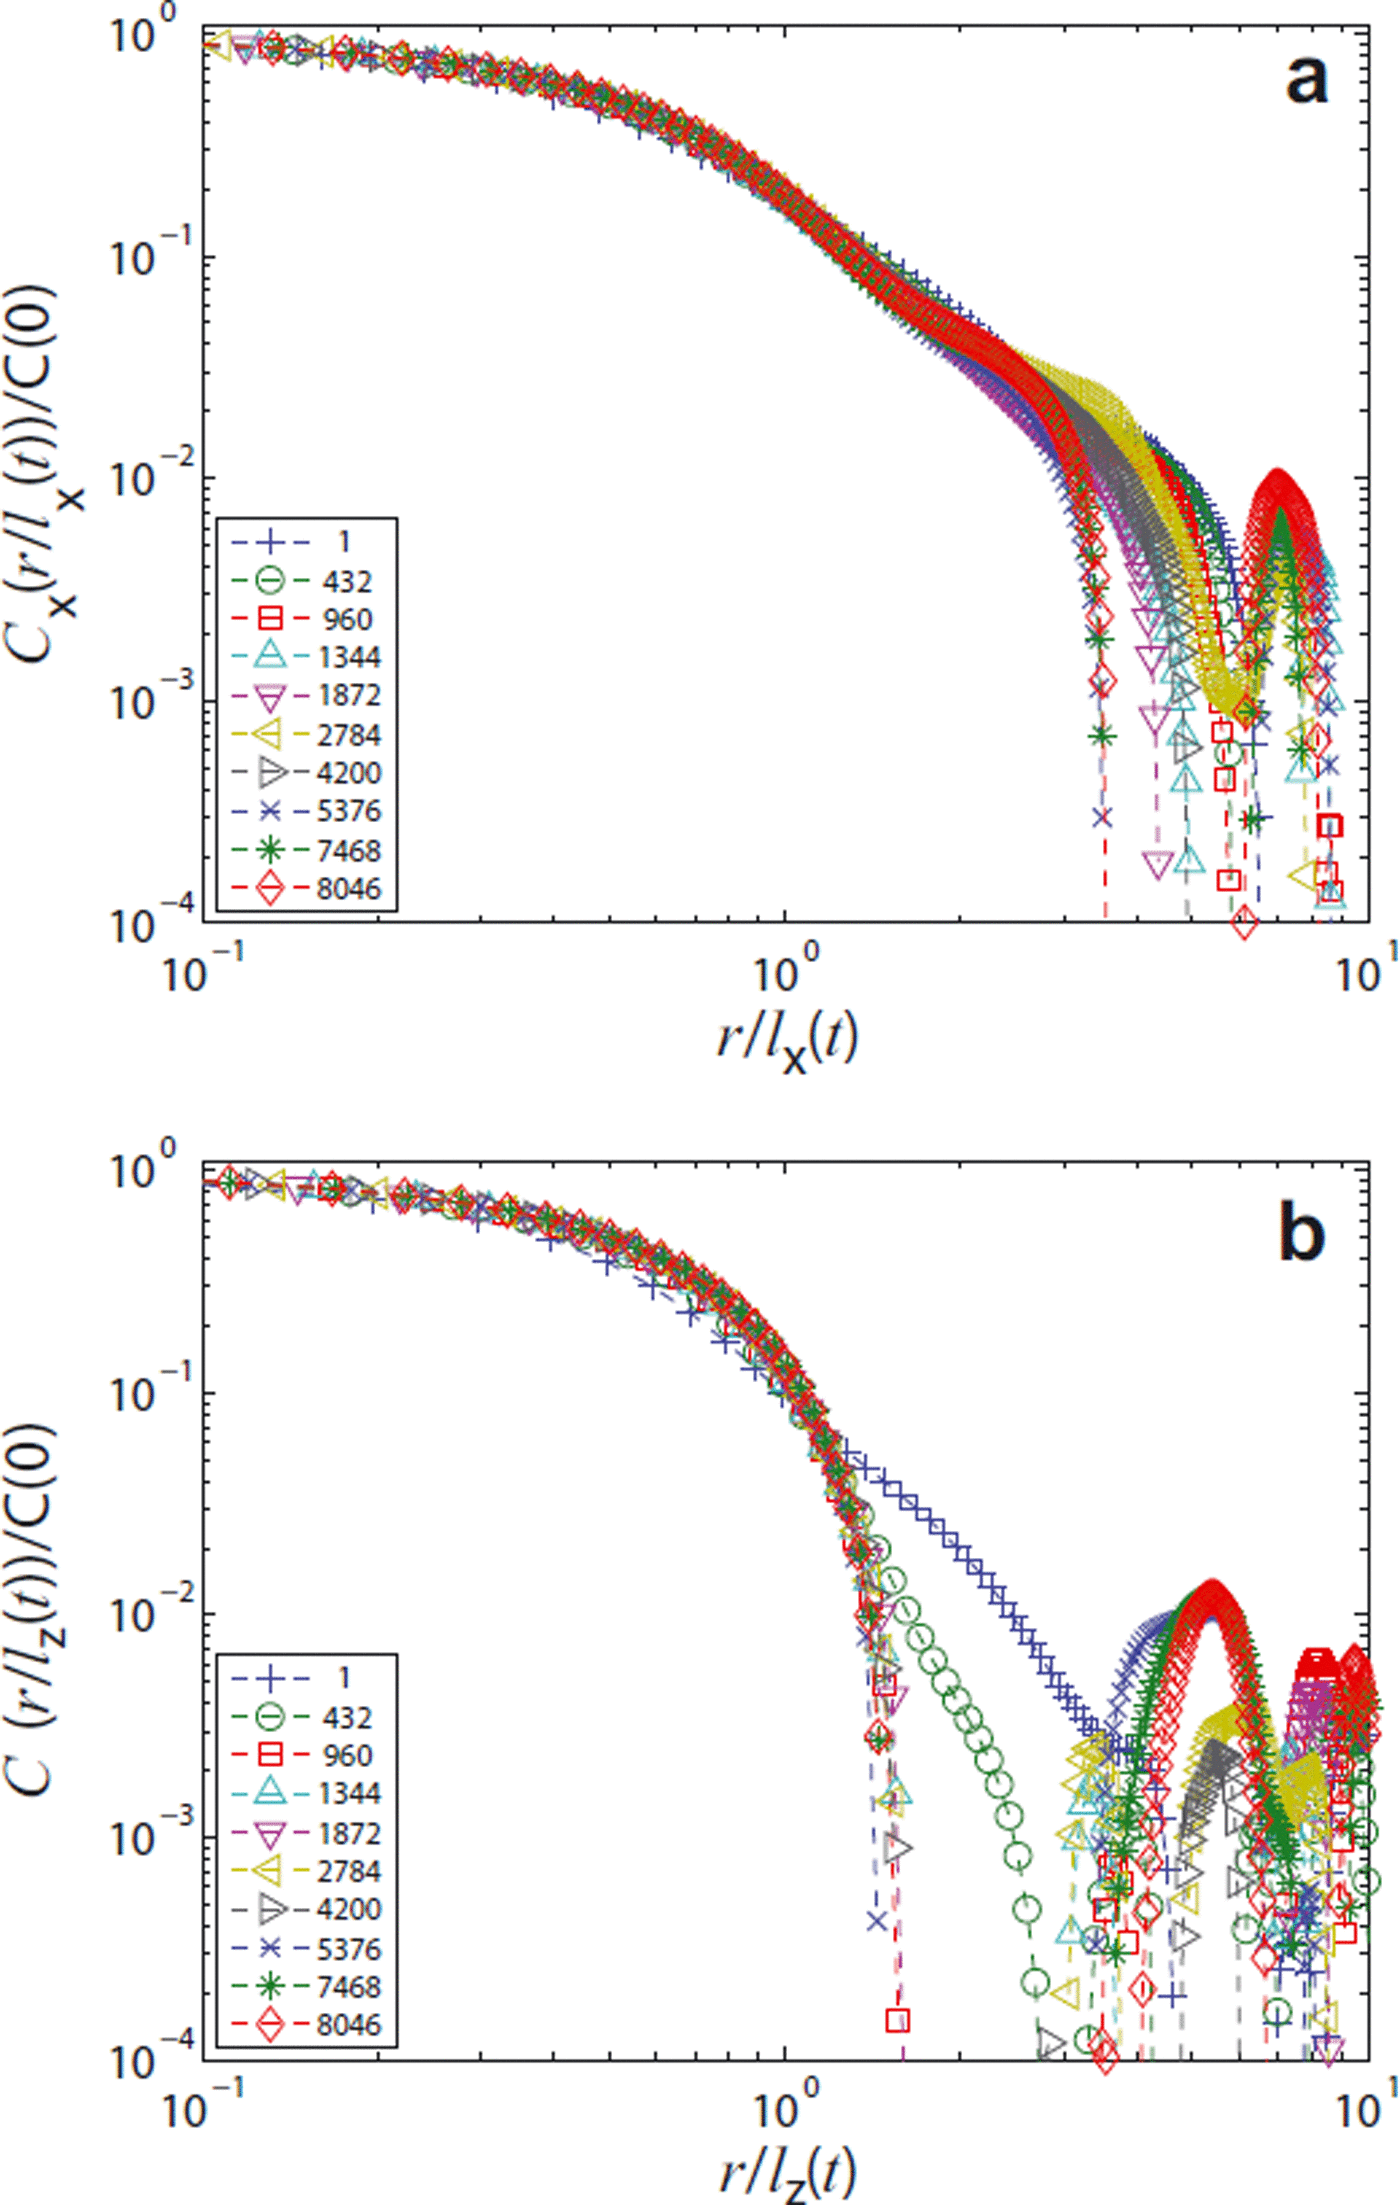
Fig. 6. Rescaled two-point correlation functions at T = −19°C for different times (h): (a) horizontal direction, C x, and (b) vertical direction, C z.
Initial condition and final state
To shed additional light on the initial condition and the final states obtained after the entire year of coarsening, the correlation functions for both states are compared for all temperatures in Figure 7. Initially, correlations clearly exist beyond r/lα (t) ≈ 1 in all three coordinate directions. The decay can be approximately described by a power law with exponent C(r/lα (t)) ∼ (r/lα (t)) −β , with β = 1.8. This behavior is not very striking and extends only over a range of one order of magnitude. However, it clearly indicates the presence of structural correlations on scales that are large compared with lα (t). The origin of these correlations is revealed by a closer, visual inspection of the sample, which shows the presence of dendritic structures, (Fig. 8). For the lowest temperature the structures persist throughout the entire year. Again by (subjective) visual inspection we confirm that after 1 year at T = −19°C, dendrites can only be found in the x-y plane (Fig. 8); we could not find dendritic structures from views in the x-z or y-z planes. This is in agreement with the behavior found for the correlation function (Fig. 6). In the x-direction (also in the y-direction, not shown) at T = −19°C the initial power law is still visible in the form of a knee-like feature prior to the first zero-crossing of the correlation function. In contrast, in the z-direction any sign of the initial power-law correlations immediately disappears. Before investigating the time evolution of the correlation lengths in detail, we consider the distribution of ice thicknesses.
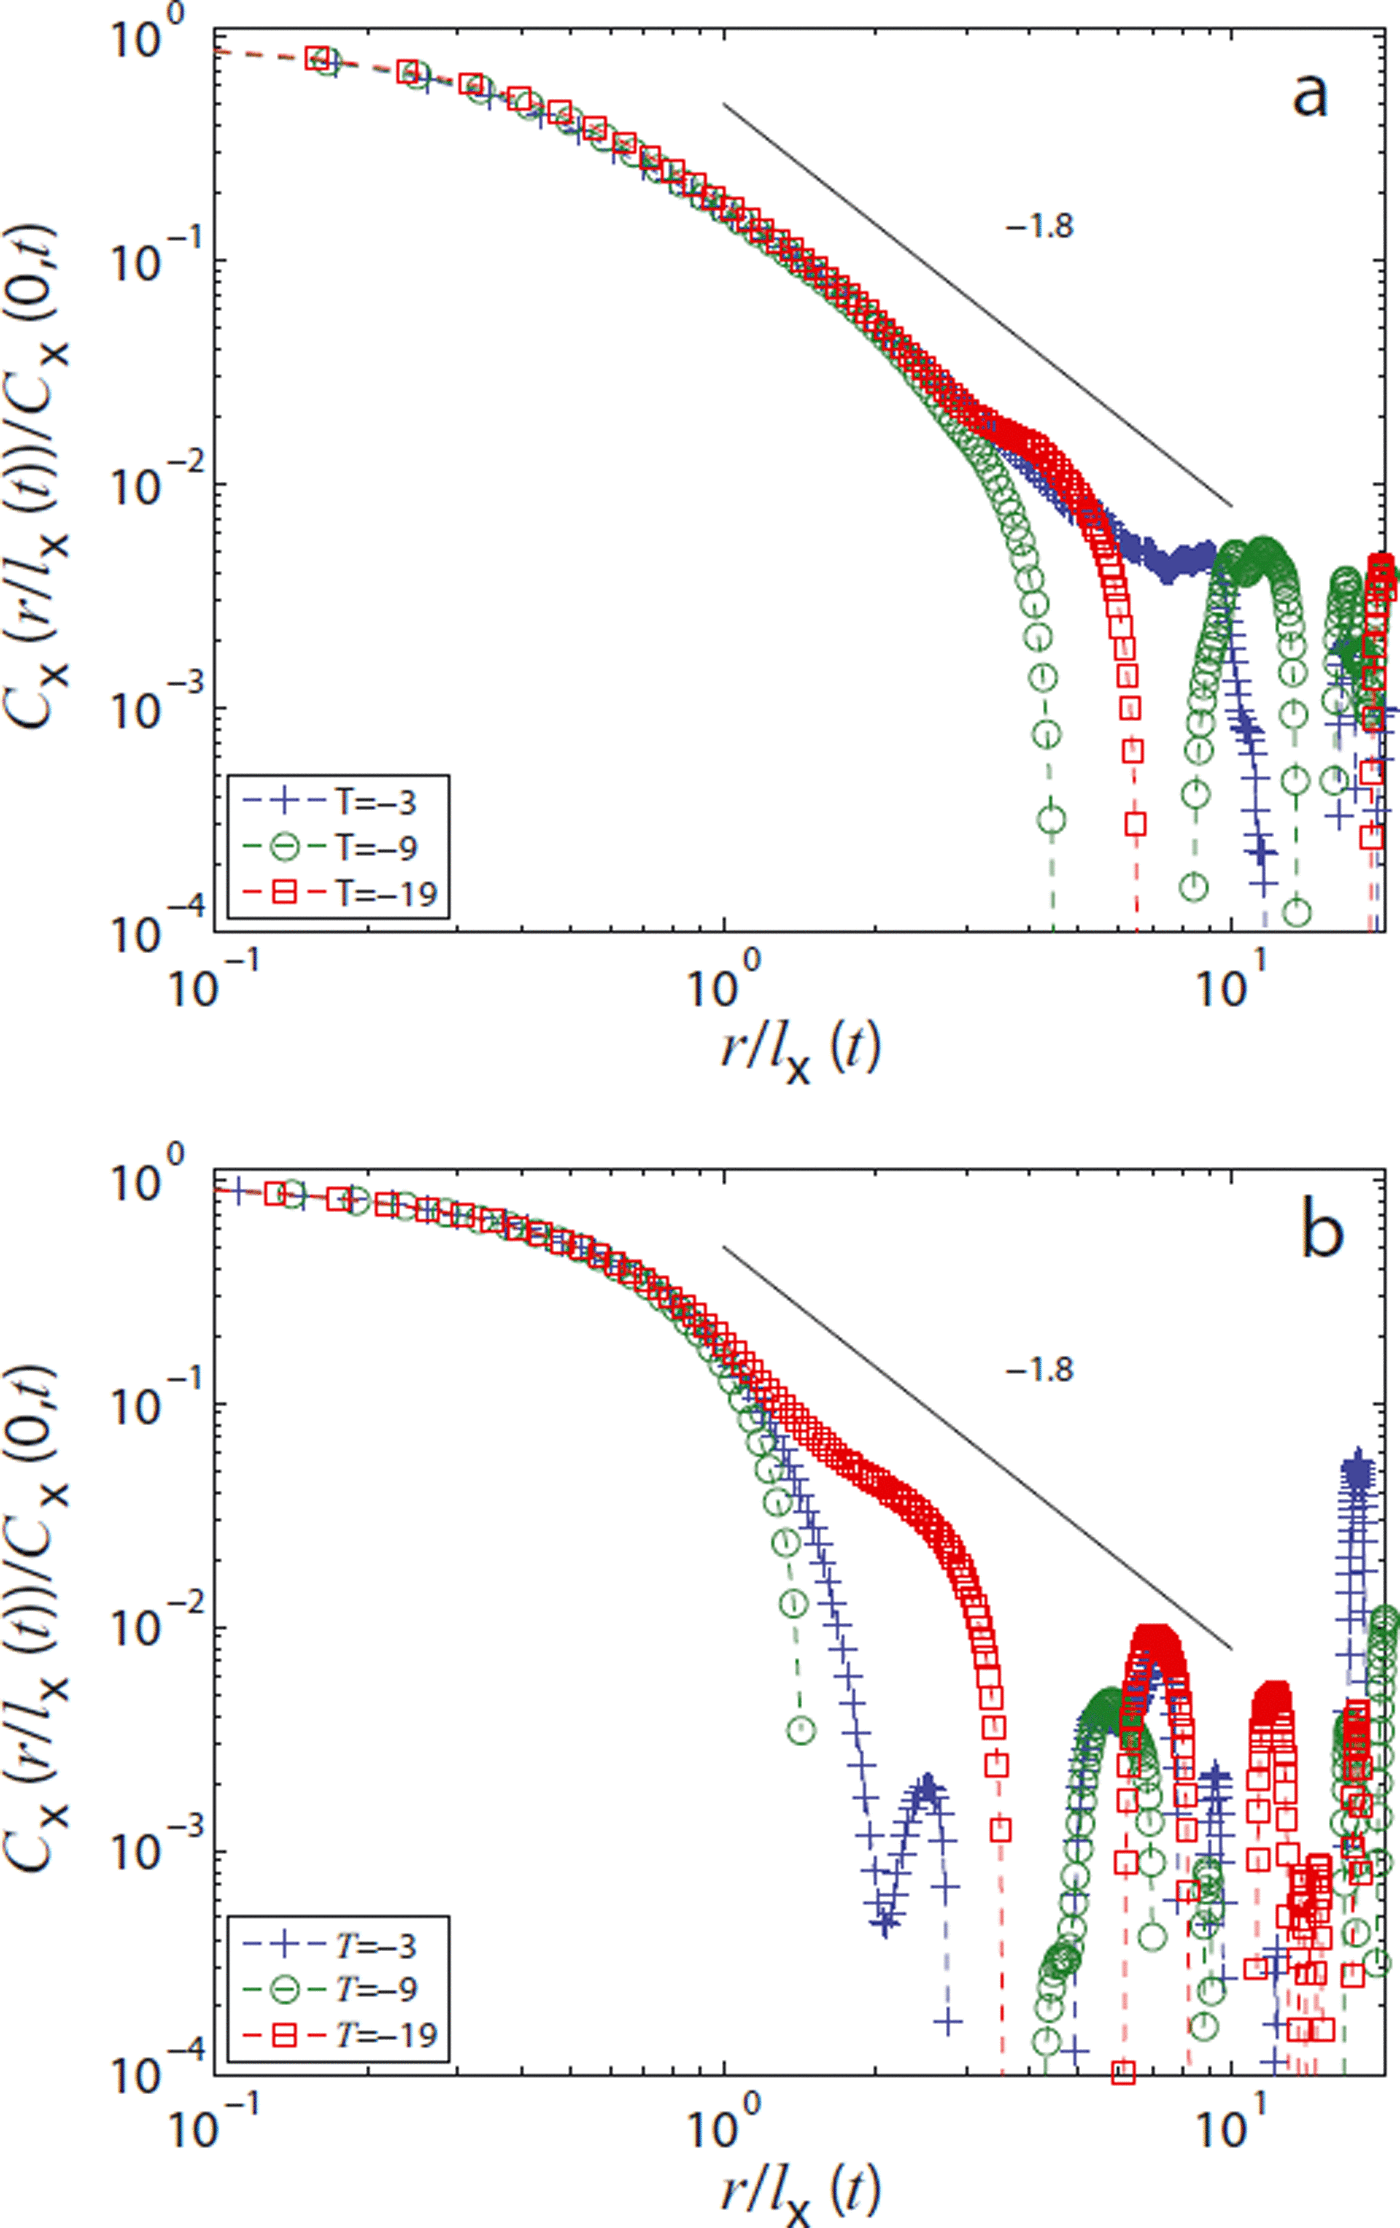
Fig. 7. Rescaled correlation functions for all temperatures (a) at the beginning and (b) at the end of the experiment.
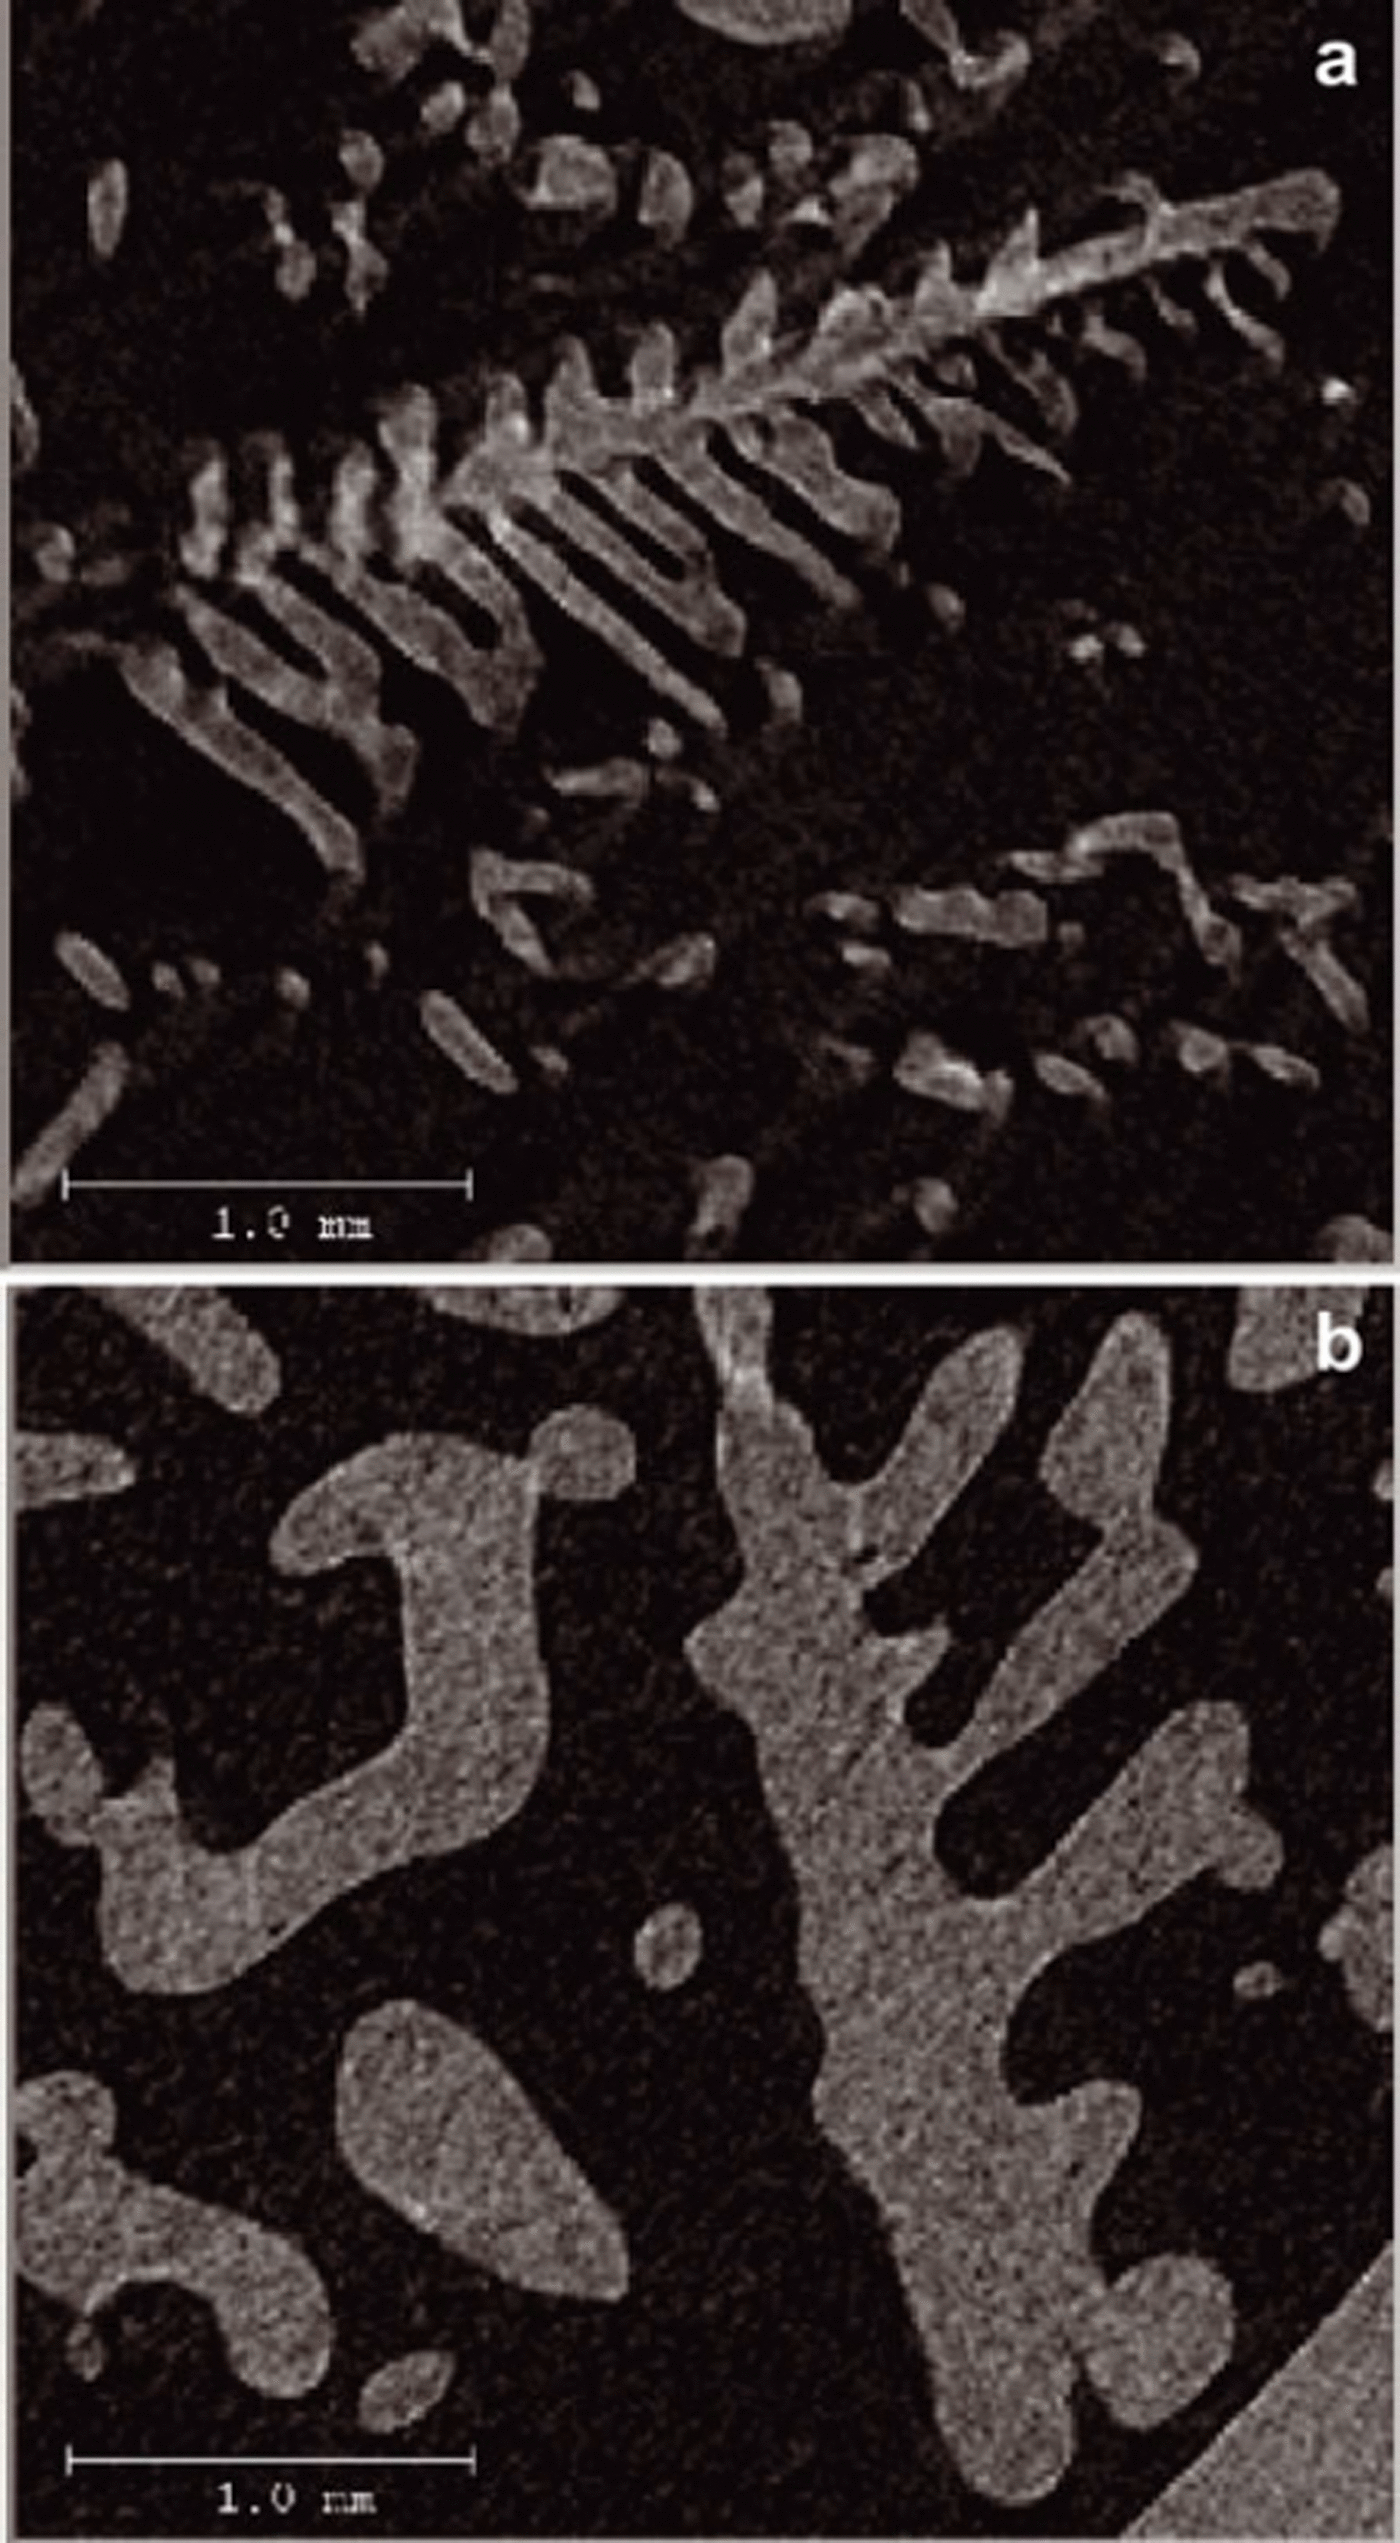
Fig. 8. Dendritic structures in snow at T = −19°C in the x-y plane. (a) Initial condition and (b) after 1 year. Note that the structures are not identical.
Ice-thickness distribution
Scaling
The ice-thickness distribution (Equation (9)) is computed from the vendor software of the CT device by a distance transform of the ice phase (Reference Hildebrand and RüegseggerHildebrand and Rüegsegger, 1997). The evolution of the rescaled (by the mean l th) thickness distributions is given in figure 9. Since the thickness is a measure for an approximation of the structure by spheres, we also compare the thickness distribution with the classical radius distribution of Reference Lifshitz and SlyozovLifshitz and Slyozov (1961), the dashed curve in Figure 9. Up to normalization the analytical form is given by p LSW(y) ∼ y 2 (y + 3)−7/3 (3/2 − y)−11/3 exp[3/(2y − 3)]. Again we concentrate on the comparison between T = −3 and −19°C.
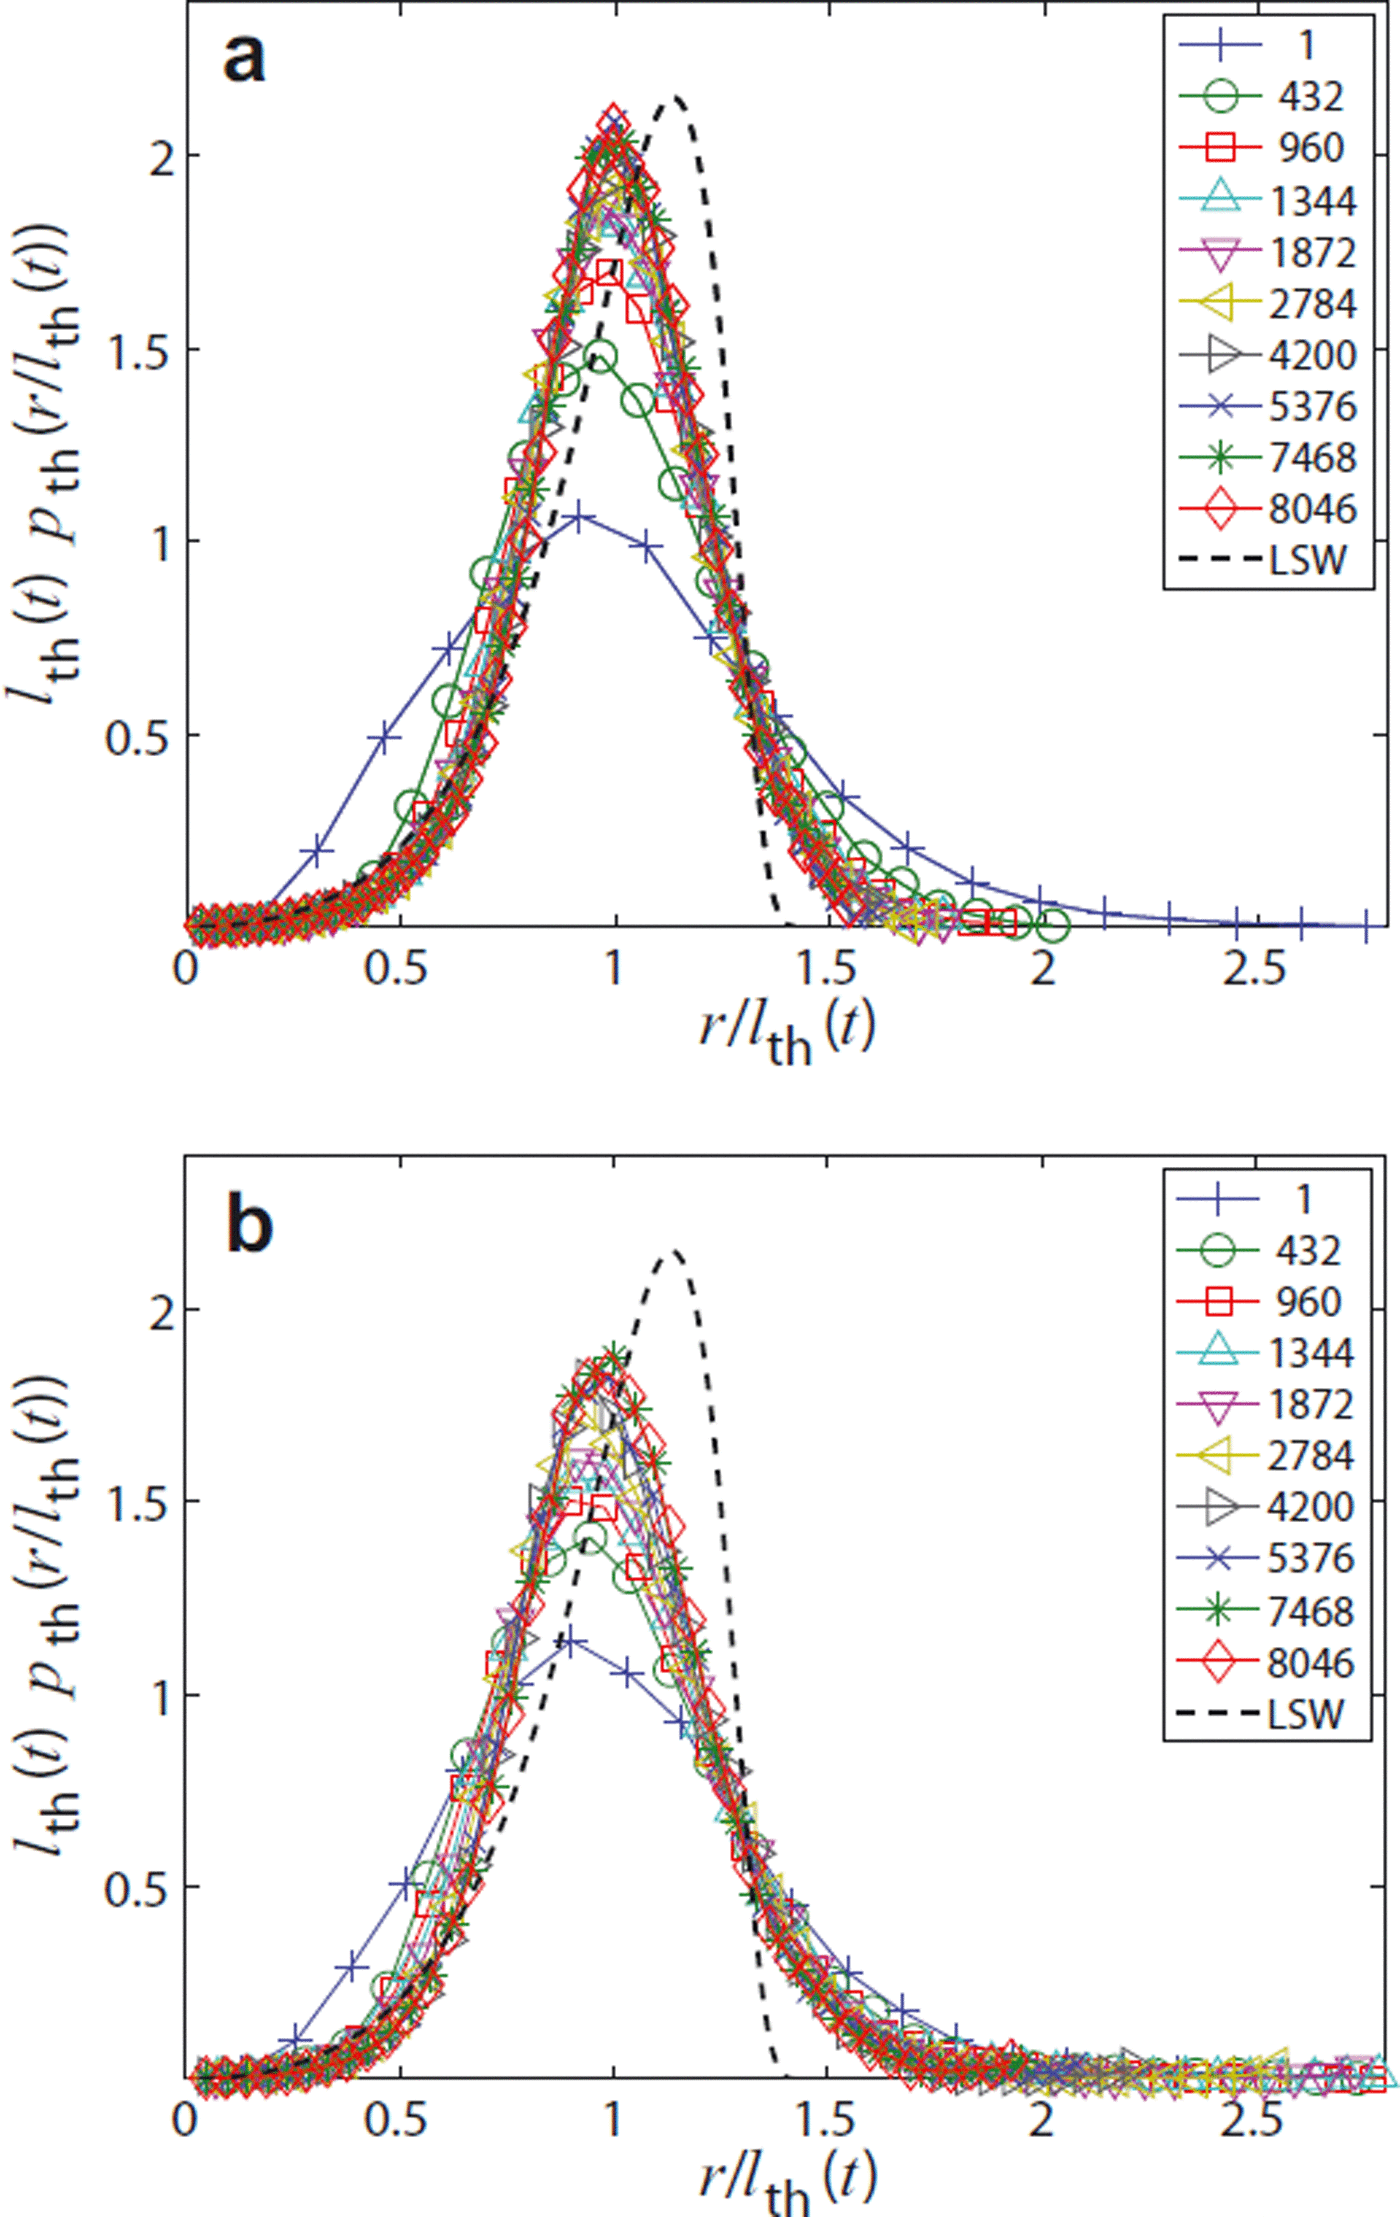
Fig. 9. Rescaled ice-thickness distribution functions at (a) T = −3°C and (b) T = −19°C for different times (in hours).
Initial and final state
The ice-thickness distribution of the initial and final states is shown in Figure 10, on a log-linear scale. In contrast to the correlation function, it is difficult to observe the existing correlations beyond r/lα (t) ≈ 1 from the dendrites in the thickness distribution. This is due to the limitation that the thickness distribution does not capture the length of the cylindrical filaments (dendrite backbones), as outlined in ‘Thickness distribution’ in the previous section. The interpretation of the distribution is therefore difficult. Since p th(r, t) is an isotropic measure, the emerging anisotropy detected by the correlation function in different coordinate directions also remains unrevealed.
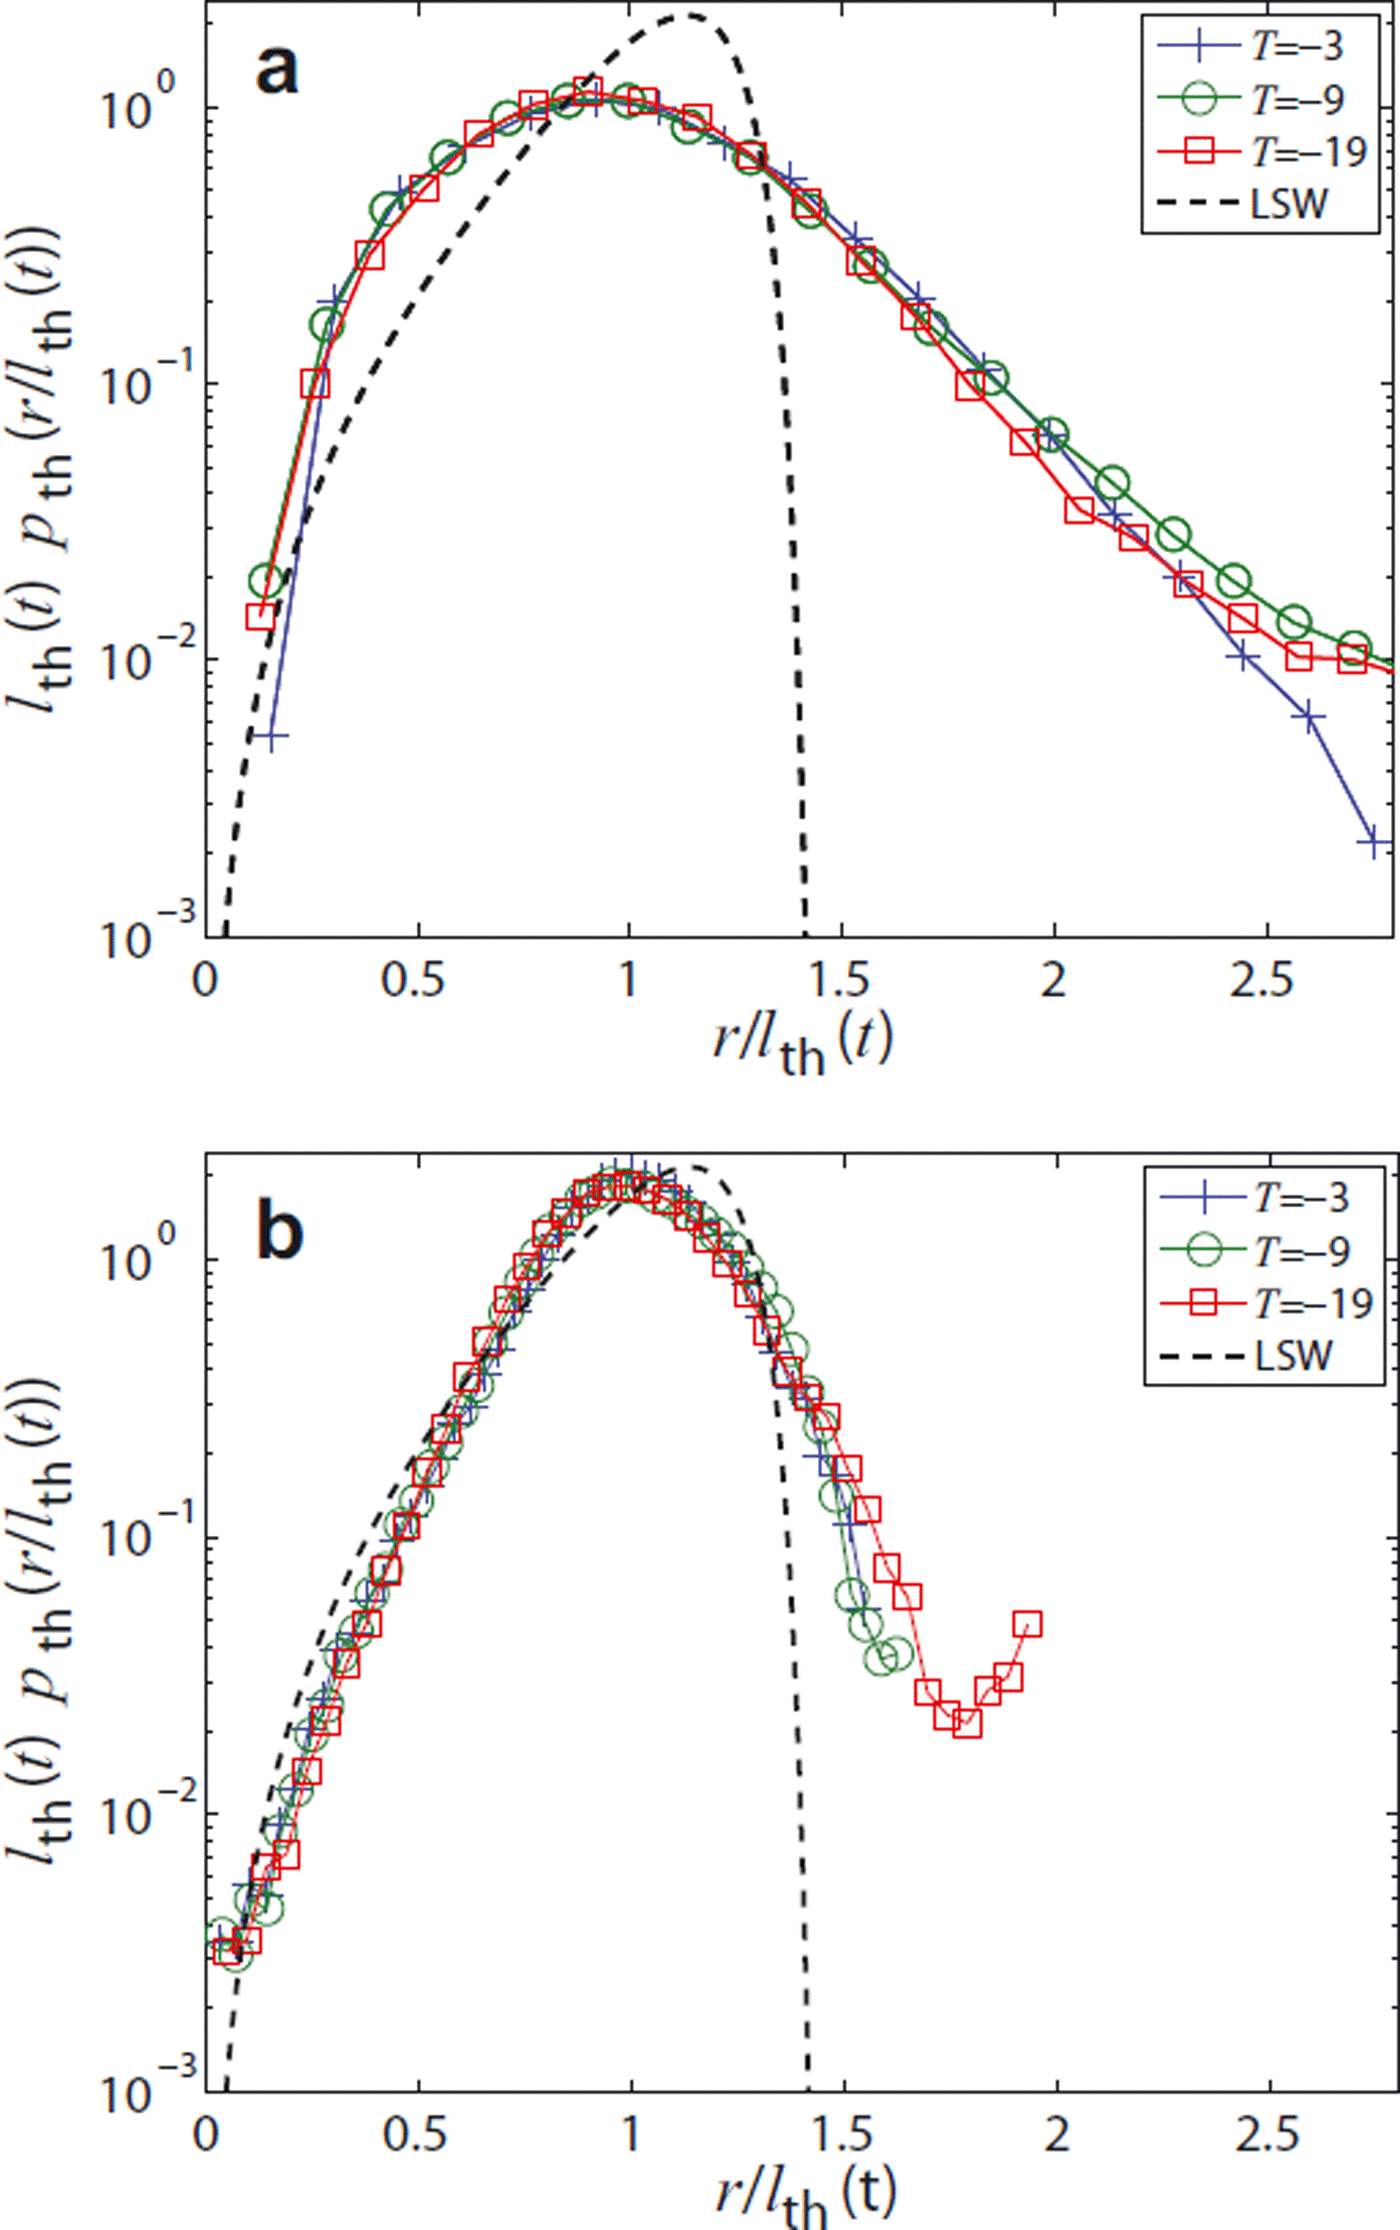
Fig. 10. Rescaled ice-thickness distribution at (a) the beginning and (b) the end of the experiment.
Length scales
Finally we compare the time evolution of all length scales defined in the previous section, which are derived from C(r, t) and pth (r, t).
First we compare the interfacial correlation lengths, lα , the mean thickness, l th, and the inverse specific surface area, l ssa. For a better comparison we normalize all lengths by their initial values, since absolute values of growth rates are not of interest in the present study. The various length scales are shown in Figure 11. All of them show reasonable power-law behavior with two different exponents which are given as straight black lines as a guide to the eye.
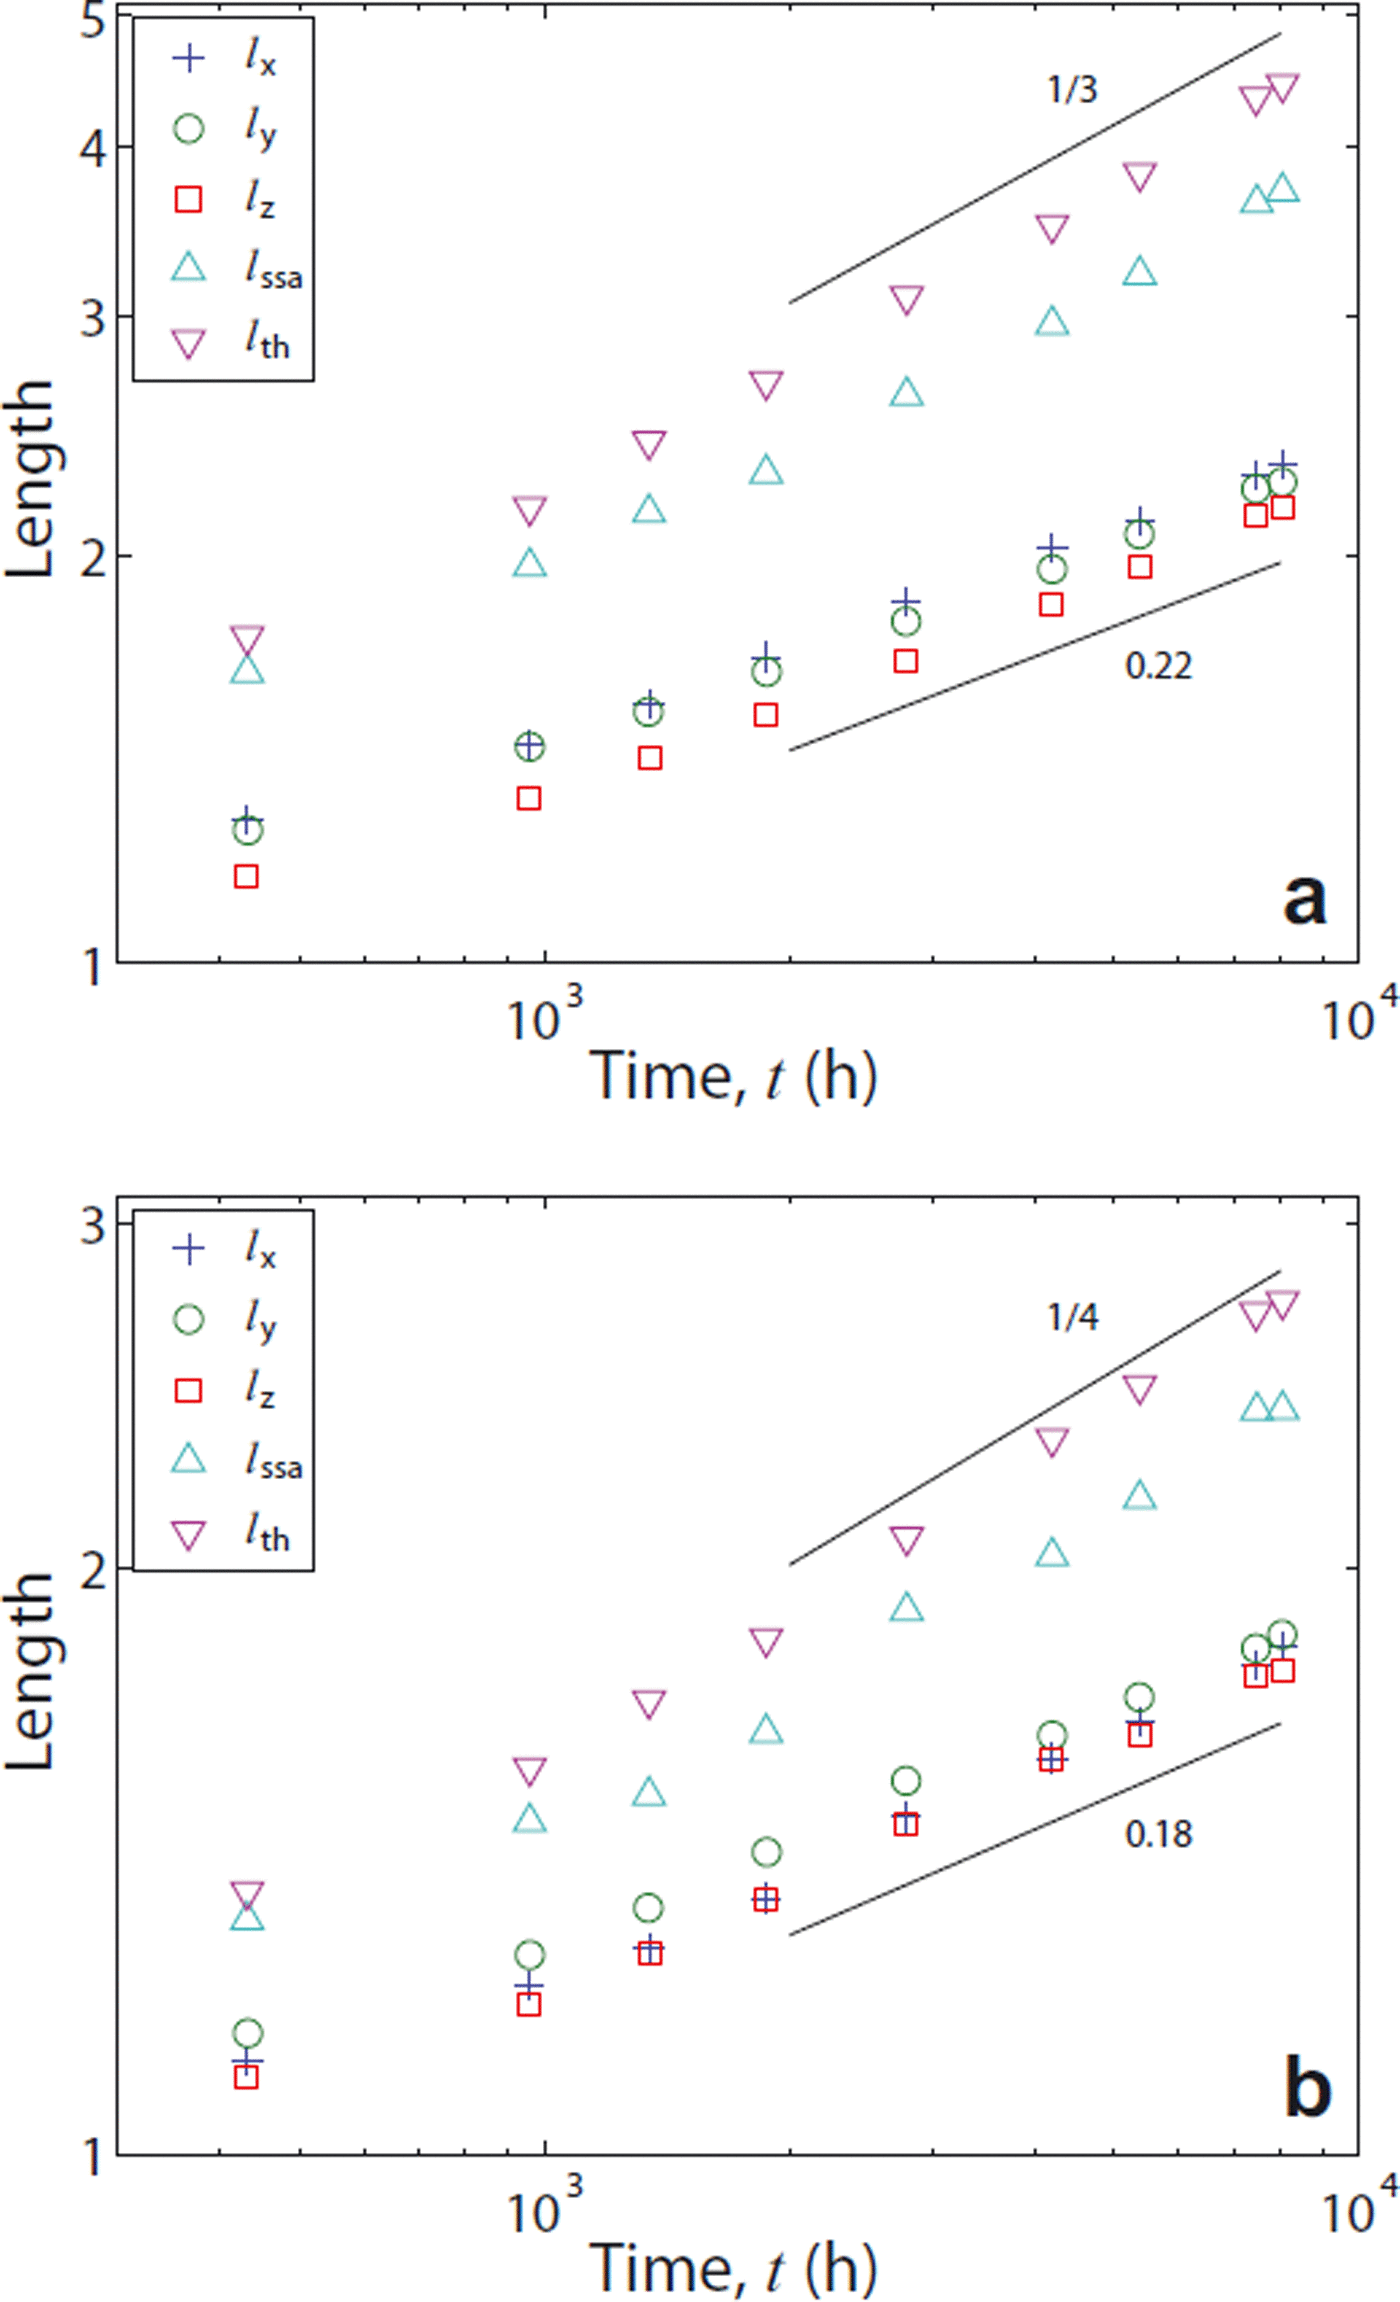
Fig. 11. Time evolution of the interfacial correlation lengths, lα , the ice thickness, l th, and the inverse specific surface area, l ssa, at (a) T = −3°C and (b) T = −19°C.
Finally, in Figure 12, we evaluate the first zeros, l 0, α , of the correlation function in the x- and the z-direction, again normalized by their initial values. Interestingly, a completely different, nonmonotonic behavior is observed: the first zero of Cz (r, t)/Cz (0, t) always decreases in the beginning, reaches a minimum after two time-steps and increases subsequently. The time at minimum coincides with the beginning of the onset of data collapse of the correlation function, Cz (r, t)/Cz (0, t), observed in Figures 5 and 6. In contrast, the first zeros of Cx (r, t)/Cx (0, t) always display transient behavior in the beginning, which is difficult to characterize. After attaining a maximum at intermediate times, all the x curves seem to follow the slow growth of the z curves at the very late stage, where all zeros grow in unison.
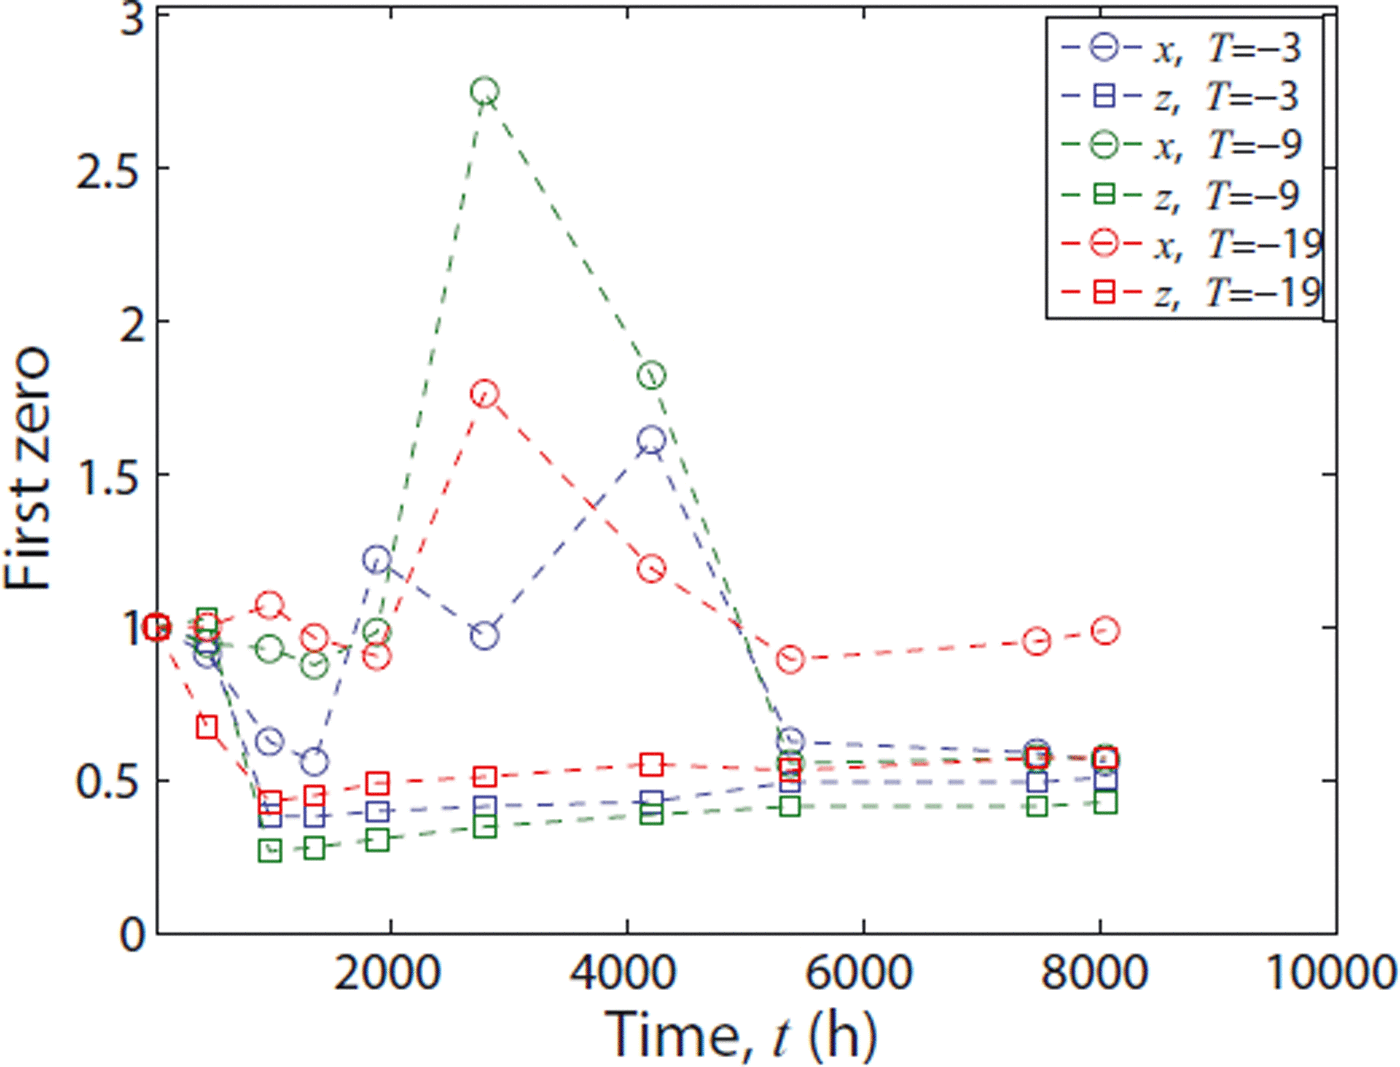
Fig. 12. Time evolution of the structural correlation lengths, l 0,α , for α = x (circles) and α = z (squares), for T = −3, −9 and −19°C.
Discussion
General behavior of the correlation function
We start our discussion by making some general qualitative comments on the observed properties of the correlation function. In the initial state (Fig. 6a), correlations clearly extend beyond r/lα (0) = 1, signaling a wide distribution of length scales. The apparent power-law decay beyond r/lα (0) = 1 (Fig. 7) stems from the initial crystal aggregate, which contains a wide distribution of particle shapes and resembles an irregular dendritic, fractal-like morphology. During metamorphism the correlation function always evolves to an oscillating form with emerging zero-crossings. This is independent of temperature and coordinate direction. Higher-order zero-crossings are visible, but these scales are not resolved statistically with sufficient accuracy. Thus a parameterization that is characterized by a single length scale (Reference Wang, Pulliainen and HallikainenWang and others, 1998), such as the exponential form C(r)/C(0) = exp(−r/l), cannot be supported. We rather find that the slope of the correlation function at the origin and the first zero-crossing are governed by different dynamics. A detailed discussion of the distinguished dynamics of these length scales is given below. The existence of different scales requires at least a two-scale form similar to other disordered, bicontinuous systems, which can be reasonably well described by the Teubner–Strey correlation function (Equation (6)).
For a quantitative discussion we first resort to the idealized picture of phase ordering (given in the ‘Theoretical background’ section) and the usual assumption of dynamic scaling (Reference BrayBray, 1994). This would imply a scaling form
for the correlation function at long times independent of the direction, α. Our measured correlation functions clearly reveal the breakdown of this scaling form during isothermal metamorphism of snow in all coordinate directions. This is analogous to the breakdown of scaling observed for the curvature distribution of Reference Legagneux and DominéLegagneux and Dominé (2005), which indicates a coupling between several length scales that has to be elucidated.
Hierarchy of length scales
Our first result is the existence of different classes of length scales which can all be described by a power law, but with different exponents (Fig. 11). This is precisely the behavior reported by Reference Lipshtat and MeersonLipshtat and Meerson (2002) for the coarsening of fractal clusters simulated via the Cahn–Hilliard equation. The key ingredient is the presence of power-law correlations in the initial conditions, which give rise to an additional relevant length scale during coarsening. In our case, the initial conditions contain irregular, dendritic structures. These structures are revealed in the correlation function by signatures of a power-law tail well above the interfacial correlation length, r/lα (t) ≈ 1 (Fig. 5). The decay can roughly be described by C(r, 0) ∼ r− 1.8 (Fig. 7). These correlations survive in the form of a ‘knee-like’ feature (a dip) in the correlation function (Figs 5 and 6) over a long period of time, as observed by Reference Lipshtat and MeersonLipshtat and Meerson (2002). In the z-direction the knee-like feature almost immediately turns into a zero-crossing after two time-steps, and the correlation function shows reasonable data collapse, up to its second zero-crossing.
At high temperatures (T = −3°C) the observed exponent values in Figure 11a are close to 1/z = 0.33 for l ssa and l th, and 1/z = 0.22 for lα . The smaller value for lα (t) is in agreement with that obtained by Reference Lipshtat and MeersonLipshtat and Meerson (2002). We note that our definition of lα (t) coincides with the one given in their work, though the correlation function slightly differs: Reference Lipshtat and MeersonLipshtat and Meerson (2002) consider the two-point correlation function of a single, fractal cluster with respect to the origin, which decays to zero for large distances. However, we are dealing with an assembly of these clusters, which is homogeneous on large scales. Accordingly, the two-point correlation function, as defined by Reference Lipshtat and MeersonLipshtat and Meerson (2002), will decay to a nonzero value at large arguments. For comparison we have defined C(r) to be the covariance of the random microstructure which likewise tends to zero for large arguments. The larger of our power-law exponents is close to the LSW value, z = 3.
At low temperatures (Fig. 11 b) the scenario is qualitatively identical to the high-temperature case; only the values of the exponents have changed, suggesting different underlying dynamics. Here, l th and l ssa follow an evolution which is close to 1/z = 1/4, whereas the exponent for the interfacial correlation lengths lα is again well below this value. In analogy to the high-temperature case, we attribute the exponent z obtained from l th and l ssa to the true dynamical behavior whereas the dynamics of lα (t) is subject to anomalous behavior with a larger z, due to the persistence of initial conditions. A dynamic exponent z = 4 is, in general, characteristic for surface diffusion (Reference Balluffi, Allen and CarterBalluffi and others, 2005), as previously suggested by Reference Vetter, Sigg, Singer, Kadau, Herrmann and SchneebeliVetter and others (2010). Some support for this conjecture can be found in the work of Reference LibbrechtLibbrecht (2003), where the role of surface diffusion on ice changes at T ≈ −15°C. However, Libbrecht’s work focused on the dynamics on the principal facets of ice, whereas our snow still has a round appearance, signaling the dominance of relaxations on rough orientations. On general grounds, one may expect that surface diffusion is only an intermediate dynamical regime of a surface since the l ∼ t 1/3 growth due to evaporation/condensation will eventually always dominate over a l ∼ t 1/4 behavior of surface diffusion. Thus it is likely that even at low temperatures a terminal LSW value of z = 3 is attained at even later times.
We acknowledge that the low exponents obtained for low temperatures might also be a consequence of more pronounced transients at low temperatures, as suggested by Reference Legagneux and DominéLegagneux and Dominé (2005). However, the absence of data collapse, as observed for our correlation function or for the curvature distribution of Reference Legagneux and DominéLegagneux and Dominé (2005), does not necessarily imply that the exponent is estimated incorrectly. As a counter-example, during coarsening of dendritic Pb–Sn microstructures the measured exponent attains its correct value, while curvature distributions still show transients (Reference Kammer and VoorheesKammer and Voorhees, 2006). It is reasonable that the crossover timescale, where initial conditions have died out, depends on temperature. Likewise, fitting growth laws in the same interval will lead to effective (time-dependent) dynamic exponents, z(t) = d ln(l)/d ln(t) (Reference HuseHuse, 1986) and an apparently continuous increase of the measured exponents with decreasing temperature (as observed by Reference Vetter, Sigg, Singer, Kadau, Herrmann and SchneebeliVetter and others, 2010). To resolve these apparently contradictory interpretations of the low values of the exponent at low temperature, experiments are required which disable the evaporation/condensation mechanism while enabling surface diffusion. This can be achieved by replacing the air in the pores by a fluid. Work along these lines is ongoing.
It is illustrative to draw the link between the observed exponent, z = 3, and the dynamics of a conserved order parameter. Nominating evaporation/condensation as the dominant mechanism of mass transport does not immediately imply conserved dynamics for the order parameter. It is rather the fact that the evaporation/condensation dynamics is limited by diffusion in the gas phase, which ultimately fixes z = 3 (Reference Lifshitz and SlyozovLifshitz and Slyozov, 1961). If instead the evaporation/condensation dynamics were limited by surface kinetics we would find z = 2 (Reference Lifshitz and SlyozovLifshitz and Slyozov, 1961; Reference WagnerWagner, 1961), though diffusion is still an indispensable component of vapor transport between successive, rate-limiting evaporation and condensation events. In the kinetics-limited regime, diffusion can be regarded as infinitely fast, hence evaporated mass is immediately available for condensation at remote parts of the structure, only subject to a global mass conservation. This effectively translates into an order parameter, which is only globally conserved and which still leads to z = 2 (Reference Lifshitz and SlyozovLifshitz and Slyozov, 1961), similar to the dynamics in the absence of any conservation law. The kinetics-limited case requires a small condensation coefficient (Reference Legagneux, Taillandier and DominéLegagneux and others, 2004; Reference LibbrechtLibbrecht, 2005) on the interface and thus the result z = 3 is consistent with diffusion-limited evaporation/condensation.
Despite the absence of dynamic scaling, all length scales discussed so far display a monotonic increase. They can be reasonably well described by a power law which is the same for all coordinate directions. A completely different behavior is observed for the structural correlation lengths, l 0,α, which are nonmonotonic and anisotropic. Remarkably, the observed anisotropy between the rescaling properties of C(r, t) in the z- and the x-direction (Figs 5 and 6) has no influence on the evolution of the interfacial correlation lengths, lα , in the respective directions (Fig. 11). This implies that the dynamics on the smallest scales remains isotropic. In general, one can expect a dependence of the growth rate of lα on the volume fraction (Reference Ratke and VoorheesRatke and Voorhees, 2002) and thus implicitly a dependence on time. However, this effect cannot be resolved from our data. The isotropy on the smallest scales holds true at all temperatures and suggests that the anisotropy emerges from larger scales. This is confirmed by the evolution of the first zero-crossing, l 0, α , of Cα (r, t)/C(0, t), which displays a complicated, anisotropic behavior. Since gravity is the only mechanism that breaks the symmetry between horizontal and vertical directions it is likely to be the origin of the anisotropy. Usually, the zero-crossing is interpreted as a typical domain size (Reference Teubner and StreyTeubner and Strey, 1987). Hence one can define Ω(t) = (l 0, x , l 0, y , l 0, z ) as an oriented structural unitof the ice network. The dynamics of Ω(t) characterizes the evolution of some orientational order which does not show any qualitative differences between different temperatures (Fig. 12). The z-component of Ω(t) always decreases rapidly, followed by a slow monotonic increase. The rapid decrease might be caused by some rotational motion under gravity. This might be corroborated by the fact that after 1 year the long arm of the dendrite is predominantly found in the x-y plane. In contrast, the x, y components of Ω initially show some transient behavior which is followed by a maximum where correlations roughly double when compared to the initial value. The temporal resolution is too coarse to investigate this phenomenon in quantitative detail, but the qualitative features of the evolution are present at all temperatures. A quantitative investigation of these structural rearrangements, their possible impact on modulations of the bulk densification rate and their possible initiation by interfacial-scale coarsening is left for future work.
Relation to curvature distributions of snow
The observed properties of the correlation function can be discussed in connection with interfacial curvature distributions which are sometimes used to characterize the evolution of snow (Reference Flin, Brzoska, Lesaffre, Coléou and PieritzFlin and others, 2003; Reference Legagneux, Taillandier and DominéLegagneux and others, 2004). Similar to our case, those authors observe the absence of scaling of the curvature distribution. It is likely that their distributions are also influenced by larger-scale structural rearrangements or the persistence of initial conditions. Our analysis above suggests that this is an implication of the structural reorganization at larger scales and thus cannot be predicted by coarsening mechanisms alone. Previous work on isothermal metamorphism has usually focused on the specific surface area and its interpretation in terms of modified LSW approaches. The expansion of Equation (4) unambiguously reveals that the specific surface area only describes spatial correlations of snow on the smallest scales. This appears to be insufficient, due to the existence of different relevant length scales which are influenced by memory effects of initial conditions or gravity. A first attempt to include gravity in isothermal metamorphism has been made using Monte Carlo simulations (Reference Vetter, Sigg, Singer, Kadau, Herrmann and SchneebeliVetter and others, 2010). Future effort in this direction is highly desirable. Apparently, the structural ordering on larger scales leaves the interfacial phase ordering nearly unaffected. This can be inferred from Figures 10 and 11. While the interfacial scales already evolve monotonically (beyond t = 2000 hours), the structural scales still display nonmonotonic and anisotropic behavior. This suggests an appealing simplification for modeling macroscopic densification: one might solely focus on how structural mobility is induced by small-scale interfacial coarsening, which can be regarded as externally imposed.
Relation to radiative properties of snow
Finally, we comment on a possible application of our results to field measurements. The Fourier transform of the correlation function naturally emerges in certain approximations for the scattered intensity of radiation in snow as a random medium (Reference Vallese and KongVallese and Kong, 1981; Reference MätzlerMätzler, 1998; Reference Arslan, Hallikainen and PullinainenArslan and others, 2005). Thereby ad hoc assumptions for the functional form of the correlation function are employed to match the measured intensity with a single length scale and microstructural information is commonly required to provide this length scale. If these steps were to be reversed, more accurate microstructural information could be obtained from optical measurements in the field. However, a procedure analogous to small-angle scattering (Reference Debye and BuecheDebye and Bueche, 1949) will be difficult, since relevant structural length scales of snow fall precisely into the wavelengths of the far-infrared spectrum in which ice strongly absorbs.
Conclusions
We have employed the density correlatio function to investigate the dynamics of direction-dependent spatial fluctuations of the microscopic density of snow during isothermal metamorphism. The observed correlation function always evolves to a state where the decay of correlations is modulated by oscillations indicating a certain order, i.e. alternating arrangement of ice and pores. Thus non-negative, single-scale parameterizations, such as an exponential form for the correlation function, seem to be inaccurate. Different types of dynamics have been revealed by closer inspection of the slope and the first zero-crossing of the correlation function. The behavior of the slope of the correlation function is quantitatively reminiscent of coarsening of fractal clusters and argued to be a consequence of dendritic initial conditions which persist at low temperatures over an entire year. The similarities between dendritic and fractal coarsening must, however, be further elucidated. The dynamics of the specific surface area seem to be governed by the ‘true’ dynamic exponent which suggests the dominant underlying pathway of mass transport: diffusion-limited evaporation/condensation with z = 3 at high temperatures, and surface diffusion with z = 4 at low temperatures. The slowing down of growth might be likewise caused by continuously increasing transients to a final scaling state. With regard to applications it will be interesting to see whether the two-scale Teubner–Strey form of the correlation function provides missing geometrical information for scattering problems.
Acknowledgements
We gratefully acknowledge the valuable support of M. Jaggi and S. Steiner during the experiments in the cold laboratory. C. Mätzler, P. Voorhees, N. Dawes and two anonymous reviewers provided helpful suggestions on the manuscript.


