


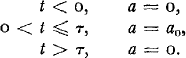
On 4 April 1972 the AIDJEX (Arctic Ice Dynamics Joint Experiment) camp, located on the pack ice of the Beaufort Sea, experienced a number of shocks that felt like earthquakes and shook the buildings. One of these shocks, occurring at 10.21 G.M.T., was recorded on a biaxial tilt-meter used to measure ocean and ice tilts.
The tilt-meter consisted of two hydrostatic levels, each 120 m long, oriented perpendicular to each other. The displacement of the fluid in the pots at opposite ends of each level were sensed with floats and displacement transducers and were recorded on strip chart. The dynamic response of the fluid was such that the system was critically damped. The theory of hydrostatic levels and description of the apparatus is given in Reference WeberWeber (1974) and Reference Weber and ErdelyiWeber and Erdelyi (1976). The sudden apparent tilt changes recorded by the tilt meter during the event (Fig. 1) are probably due to a rapid horizontal acceleration or deceleration of the station floe. The deflections are both positive and correspond to apparent downward tilts of 29.1 μrad to the east and 27.3 μrad to the south. The records therefore indicate an apparent tilt of 39.9 μrad caused by either an acceleration of a north-west (317°) drifting floe, or by a deceleration of a south-east (137°) drifting floe. From NavSat positions recorded on 4 April at 00.00 G.M.T. (lat. 75° 01.5′ N., long. 148° 24.1′ W.) and at 13.00 G.M.T. (lat. 75° 02.1′ N., long. 148° 32.6′ W.) it was determined that the station was drifting in the direction of 285° clockwise from north at an average speed of 325 m/h. At the time of the event the wind was blowing to the west-south-west (242°) at 5.2 m/s. The parameters are illustrated in Figure 2. Because the drift direction is to the north-west and in the same general direction (west-northwest) as the apparent tilt axis (north-west), it is thought that the shock was caused by a sudden acceleration, preceded by collision of a faster drifting ice floe with the station floe. The records show that the displacement of the floats in the pots due to the collision lasted less than two minutes after which the floats resumed their former positions.

Fig. 1 East–west and north–south components of ice tilt measured with an orthogonal pair of hydrostatic levels. Positive tilt (downwards on the chart) is caused either by the downward tilt of the ice floe to the east and south, respectively, or by horizontal accelerations to the west and north, respectively. The event at 10.21 G.M.T. is interpreted as having been caused by a faster drifting ice floe colliding with the AIDJEX station floe.

Fig. 2 Average drift direction between 00.00 and 13.00 G.M.T. and wind direction at collision time. Direction of acceleration (or deceleration) of station floe determined from the tilt-meter.
The magnitude of the acceleration can be estimated by considering the differential equation of motion of the vertical displacement h(t) of the fluid column in the pots of the hydrostatic level.
(Reference WeberWeber, 1974, equation 9) where A 1 and A 2 represent the cross-sectional areas of the tube
(1.27 × 10⁻⁴ m2) and the pots (16.9 × 10⁻⁴ m2) respectively, and a represents a constant horizontal acceleration in the direction of the level axis. Assuming that the acceleration lasts for a duration τ and has the shape of a box-car pulse of magnitude a 0, then for
By substituting the apparent tilt α(t) for h(t)/s where s represents the level length (120 m) and by using Laplace transforms, the following solution for the equation of motion is obtained:
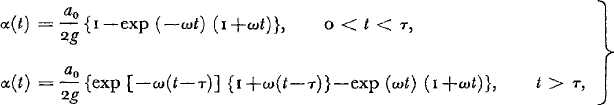
in which ω 2 equals 2gA 1/sA 2 where g represents the gravitational acceleration (9.82 m/s2). A plot of Equation (2) with τ as parameter is shown in Figure 3. From the records (Fig. 1) it can be seen that for the east–west component the pulse width is 120 s at the most. For the north–south component the pulse is easier to interpret and its width lies between 72 and 96 s. Comparison with Figure 3 shows that this corresponds to a pulse with an acceleration of duration τ between 20 and 40 s. For τ = 20 s the maximum tilt change of 39.9 μrad corresponds to 68% of the value a 0/2g. Therefore
or

Fig. 3 Apparent tilt with time α(t) of a tilt-meter caused by a constant acceleration a0 of duration τ in the direction of the instrument axis.
The velocity increase Δ V over the time period τ = 20 s is
For τ = 40 s the maximum tilt change is 94% of a 0/2g. The corresponding figures are a 0 = 8.33 × 10⁻⁴ m/s2 for the acceleration and ΔV = 3.34 × 10⁻² m/s or 120 m/h for the velocity increase.
The energy imparted to the AIDJEX floe during the collision process is equal to the difference between the energy lost by the faster drifting floe and the energy dissipated by deformation (break-up, rafting, and formation of pressure ridges). We can estimate the energy imparted per square kilometer of floe area to the AIDJEX floe. If m is the ice mass, V 0 is the average drift velocity and ΔV is the velocity increase, the energy ΔE imparted per unit area is
For an average floe thickness of 3 m and an ice density of 0.9 Mg/m3, the mass m is 27 × 108 kg. For an acceleration lasting 20 s the imparted energy is 5.6 × 10⁶ J or 1.6 kWh and for a 40 s acceleration the corresponding figure is 8.1 × 10⁶ J or 2.3 kWh. In other words, the energy imparted per square kilometre of ice-floe area during the collision was about equal to the energy used to supply to AIDJEX camp with electric power for five minutes.
The station was equipped with an acoustic bottom reference (ABR) system that sampled the positions once every minute (Reference ThorndikeThorndike, 1973). The ABR position fixes for the period from 09.30 to 10.40 G.M.T. surrounding the event are illustrated in Figure 4. The scatter of the position points is caused partly by the geometrical configuration of the transducer–transponder array and partly by variations in the sound velocity of the water. In reality the drift path ought to be an almost straight line. The average velocity over the 50 min period is 286 m/h in almost exactly the same direction (286°) as the average velocity over the 13 h period determined from the NavSat fixes (285°).

Fig. 4 Station position fixes at minute intervals between 09.50 and 10.40 G.M.T. determined from acoustic bottom reference system, and average drift direction over the same time period.
It would be interesting to see whether the velocity change caused by the collision process could be detected in the ABR data. In order to minimize the effect of the scatter, the position fixes were first projected onto the average drift direction and the drift speed variations calculated at one minute intervals. The angle of projection was then chosen for minimum velocity scatter (in this case 49°, Fig. 4). The drift speed, as a running average over 4 min periods, was determined and is plotted in Figure 5, lower graph. The scatter is still large and it is of the same magnitude as the velocity change we are trying to detect. These values were averaged a second time over 7 min intervals (upper graph) and show that the average

Fig. 5 Drift speed computed from the positions determined from the bottom reference system with one minute sampling rate. Bottom curve: 4 min running average; top curve: 7 min running average of bottom curve.
speed increases, reaching a maximum at collision time and then decreases slowly over the next twenty minutes. The result is not entirely convincing. The velocity increase is probably, but not necessarily, due to the collision. The scatter of the position points is too large and the collision event is too short to be detected reliably. This example demonstrates that it is impossible from the ABR data alone to detect, much less measure, a velocity change caused by a collision event unless the sampling rate is much increased and the geometrical configuration of the transducers–transponder array is more favourable.


